

Abstract
Low-voltage activated CaV3 Ca2+ channels have an activation threshold around −60 mV, which is lower than the activation threshold of other voltage-dependent calcium channels (VDCC). The kinetics of their activation at membrane voltages just above the activation threshold is much slower than the activation kinetics of other VDCCs. It was demonstrated recently that the intracellular loop connecting repeats I and II of all three CaV3 channels contains a so-called “gating brake.” Disruption of this brake yields channels that activate at even more hyperpolarized potentials with significantly accelerated kinetics.
We have compared gating of a wild type CaV3.3 channel and a mutated ID12 channel, in which the putative gating brake at the proximal part of the I-II loop was removed. Voltage dependence of the gating current activation was shifted by 34.6 mV towards more hyperpolarized potentials in ID12 channel. Kinetics of the on-charge activation was significantly accelerated, while kinetics of the off-charge was not altered. We conclude that the putative gating brake in I-II loop hinders not only the opening of the conducting pore but also the activating movement of voltage sensing S4 segments, stabilizing the channel in its closed state.
Introduction
Voltage-gated calcium channels (CaV) enable entry of calcium ions into cells upon membrane depolarization. Entering Ca2+ serves a double function as both a mediator of depolarizing inward current and as a second messenger triggering intracellular processes such as contraction, secretion, neurotransmission, and gene transcription [10]. CaV channels are composed of four homologous domains, each containing six transmembrane segments S1–S6 and a pore loop (P) between segments S5 and S6. As in the case of voltage gated potassium channels, four voltage-sensing domains, each composed of the transmembrane segments S1 – S4, are placed peripherally to a central pore domain formed by four sets of S5-P-S6 [29]. It is accepted that activation of a voltage sensor precedes opening of the channel pore [5]. Movement of the voltage sensor during activation is reflected in a gating current while the pore opening is manifested by macroscopic inward current.
T-type or low-voltage-activated (LVA) calcium channels are distinguished by their low voltage threshold for activation, which is about −60 mV. Such negative activation voltage enables them to participate in an initial phase of cell depolarization and play an important role in neuronal firing and neurotransmitter release [26] or in initiation of epileptic seizure activity [6, 15, 16]. Further, T-type calcium channels differ from high-voltage activated channels by the shape of the voltage dependence and kinetics of their activation and inactivation. Both processes are slow at relatively negative voltages above the activation threshold, accelerate sharply within an interval of 20–30 mV, and remain virtually voltage-independent at positive membrane potentials [17, 19]. Among the LVA calcium channels, notable differences exist between CaV3.1–CaV3.2 channels and CaV3.3 channels. Kinetics of the CaV3.3 channel gating are about one order of magnitude slower [4].
Structural determinants underlying the voltage-dependent activation and inactivation of T-type calcium channels are the subject of much study. The first insight into a differential contribution of individual domains to channel gating was obtained by a domain swapping approach between the LVA CaV3.1 and the HVA CaV1.2 channel. These experiments demonstrated that domains I, III, and IV determine the midpoint for voltage-dependent activation [20]. An exchange between parts of CaV3.1 and CaV3.3 channels pointed to a central role of the fourth domain and to a lesser impact of the first domain in channel activation [9]. A more subtle approach demonstrated participation of the IIIS6 segment in inactivation from the open state [23]. Transfer of the I-II loop from a high to a low-voltage-activated channel shifted activation of LVA channels towards even more negative voltages [2]. In line with this finding, a gain-of-function point mutation leading to childhood absence epilepsy was discovered in the proximal I-II loop of the CaV3.2 channel [6]. This mutation seems to destabilize the closed state of the CaV3.2 channel. Such interpretation is supported by the recent discovery of the gating brake in the I-II loop of the Cav3.2 channel [3, 31], which is conserved in all three CaV3 channels [4] and prevents CaV3 channels from opening at membrane voltages close to the cell resting potential.
Analysis of the gating current of the CaV3.1 channel showed that it precedes the ion current by less than 10 mV; and that only about 20% of the total charge is moved when inward current activation is already saturated [18]. The gating current reflects the activation movement of the S4 segment in the putative voltage sensor, while the activation of an inward current reflects the opening of the channel pore. These results suggest that the pore of T-type calcium channel may be partly open before its voltage sensor is fully transferred into an activated state.
Here we investigated the role of the putative gating brake in the I-II loop of the CaV3.3 channel for the activation of the S4 segment. We compared gating currents measured from the CaV3.3 channel and from the ID12 channel (according to naming scheme of Baumgart et al., 2008) with the gating brake removed. Without the gating brake we find that the voltage dependence of gating current activation is shifted towards more negative membrane potentials, and the kinetics of the gating current are accelerated. We hypothesize that the putative gating brake interacts with the charged S4 segment and hinders its movement to stabilize the channel in its closed state.
Materials and methods
Mutagenesis and transfections
Construction of the ID12 mutant of the CaV3.3 was described in a detail [4]. Briefly, amino acids 414–457 in the proximal portion of the I-II loop of the CaV3.3 channel (Genbank accession number AAM67414) were deleted using the QuikChange protocol (Stratagene, La Jolla, CA).
HEK 293 cells (DSMZ, Deutsche Sammlung von Mikroorganismen und Zellkulturen GmbH, German Collection of Microorganisms and Cell Cultures) were grown in MEM with Earle's salts, containing 10% fetal calf serum and 100 U/ml penicillin-streptomycin in an atmosphere of 5% CO2 and 95% air at 37°C. The cells were transiently transfected with wild-type CaV3.3 channel or deletion mutant ID12 using LipofectAMINE 2000 (Invitrogen, Carlsbad, CA). Transfected cells were incubated 2 to 3 days prior electrophysiological measurements.
Electrophysiology and data analysis
The whole cell Ca2+ current was measured using the HEKA-10 patch clamp amplifier (HEKA Electronic, Lambrecht, Germany). The extracellular solution contained (in mM): CsCl, 105; HEPES, 10; glucose, 10; TEA-Cl, 40; CaCl2, 2; MgCl2, 1; pH 7.4 (CsOH). The intracellular solution contained (in mM): CH3SO3Cs, 130; EGTA, 10; MgCl2, 5; TEA-Cl, 10; Na-ATP, 5; and HEPES, 10; pH 7.4 (CsOH). Extracellular solutions were exchanged by a gravity-driven system with manually controlled valves. 10 mM stock solution of ErCl3 was prepared daily in deionized water and diluted in the bath solution to a desired concentration prior to the experiment.
Patch pipettes were made from borosilicate glass (Sutter Instrument, Novato, CA). When filled with the intracellular solution input resistance was between 1.6 and 2.0 MΩ. The capacitance of individual cells ranged between 10 and 30 pF. Series resistance reached values between 2.5 to 6 MΩ and was compensated by built-in circuits of the EPC 10 amplifier. Data were sampled at 10 kHz and filtered at 3 kHz. Data were recorded with HEKA Pulse 8.5 and analyzed off line using HEKA Pulsefit 8.5 and Origin 7.5 software.
The holding potential (HP) in all experiments was -100 mV. Gating currents were measured by 50 ms long depolarizing pulses to membrane potentials between −90 mV and +70 mV. Three identical pulses were averaged for each trace. The linear component of leak current and capacitive transients were subtracted using the P/8 procedure. Total charge transferred during each pulse was evaluated by integrating the area below gating current trace at the beginning (Qon) and after the end of each depolarizing pulse (Qoff).
Voltage dependencies of gating current activation were fitted by Boltzmann equation:
where Q(V) are amplitudes of gating charge measured at the test potential V, Qmax represent maximal gating charge amplitude, V0.5 is the half-maximal voltage and dV is the slope factor.
Data are presented as mean ± S.E.M. Statistical significance of differences was determined by unpaired Student's t-test and considered significant when p < 0.05.
Drugs and reagents
All drugs and chemicals were obtained from Sigma-Aldrich, St. Louis, MO, USA except when noted otherwise.
Results
To isolate and measure the gating current that reflects the movement of the putative voltage sensor in S4 segments, inward calcium current must be blocked. 30 μM of Er3+ was sufficient to block calcium inward current completely while the charge movement was not affected (Figure 1 A and B). When inward current was fully blocked, fast on-gating currents with relatively high amplitude and slow off-gating current with a relatively small amplitude were observed (Figure 1 A and B). The total charge transferred during the outward movement of the S4 segments corresponding to channel activation (Qon) and return movement (Qoff) upon membrane repolarization was evaluated as an integral of the area below each current trace. Voltage dependencies of Qon and Qoff for both CaV3.3 and ID12 channels are demonstrated in Figure 1 C and D. Voltage dependencies of Qon and Qoff for individual cells were fitted by a single Boltzmann function. The resulting values are summarized in Table 1. The removal of the putative gating brake caused a significant hyperpolarizing shift in the voltage dependencies of both Qon and Qoff by −34.6 mV and −30.5 mV, respectively. Deletion of the gating brake did not significantly alter the slope factors of Q–V relations. To facilitate comparison, Boltzmann fits of individual voltage dependencies are shown in insets to Figure 1 C and D normalized to the unity.
Figure 1. Effect of gating brake deletion on voltage dependence of gating currents.

Exemplar gating currents measured from cells expressing CaV3.3 channels (A) and ID12 channels (B). Initial phase of current activation before (solid line) and after (dashed line) equilibration with 30 μM Er3+ is enlarged in insets. (C) Qon was evaluated by integrating the area under the gating current traces at the beginning of each depolarizing pulse. Values obtained from CaV3.3-expressing cells (n = 6) and ID12-expressing cells (n = 6) were averaged. Solid lines are fits of experimental data by the Boltzmann equation. Boltzmann fits normalized to unity are shown in the inset (CaV3.3 - solid line; ID12 - dashed line). (D) Qoff was evaluated by integrating the area under the gating current traces at the end of each depolarizing pulse and averaged. Solid lines are fits of experimental data by the Boltzmann equation. Boltzmann fits normalized to unity are shown in the inset (CaV3.3 - solid line; ID12 - dashed line). Voltage dependencies of Qon ( - experimental points, solid lines – Boltzmann fits) from panels (C) and (D) are depicted together with voltage dependences of steady-state activation of ionic current in (E) for the CaV3.3 channel and in (F) for the ID12 channel.
Table 1.
Effect of gating brake deletion on voltage dependencies of ion and gating currents activation.
| V0.5 (mV) | dV (mV) | ||||
|---|---|---|---|---|---|
| Cav3.3 | ID12 | Cav3.3 | ID 12 | ||
| tail IV | −23.0±1.7*** (18) | −35.3±1.2 (17) | 11.6±0.2 | 11.1±0.4 | |
| Qon | +8.5±4.7*** (6) | −26.1±3.6(6) | 17.4±0.9 | 14.0±1.6 | |
| Qoff | −10.4±5.5***(7) | −40.9±2.0 (6) | 16.6±1.9 | 12.3±1.9 | |
Results of Boltzmann fits to voltage dependencies of activation of inward current and gating current for the Cav3.3 channel and the ID12 channel. V0.5 and dV are parameters of Boltzmann fits of steady-state activation of inward current (Figure 1 E, F), Qon (Figure 1 C) and QOff (Figure 1 D). Significant difference between Cav3.3 and ID12:
p < 0.001. All values are mean±S.E.M. Number of tested cells is in brackets.
Voltage dependencies of charge movements are compared with voltage dependencies of current activation in Figure 1 E and F. Voltage dependence of steady-state activation of both channels was measured as follows: first, time-to peak for current traces activated by depolarizing pulses to membrane voltages between −90 mV and +50 mV was evaluated. Steady-state activation of both channels was determined by measuring tail current amplitudes during membrane repolarization to −100 mV following depolarizing pulses with a duration adjusted to average time-to-peak values at corresponding membrane potentials. As noted previously, this method of assessing activation reveals a second component, requiring a double Boltzmann fit for both Cav3.1 [18] and Cav3.3 [8]. Nevertheless, 80% of activation occurs at +20 mV (+10 mV for ID12) allowing for a single Boltzmann fit (dashed lines in the Figure 1 E and F). The average values for half-maximal activation voltage V0.5 and for slope factor dV of activation voltage dependence are summarized in the Table 1.
Charge movement was first detectable after depolarizations to −60 mV in the CaV3.3 channel and −70 mV in the ID12 channel. Only 15% of total ON-charge was transferred at −23 mV, the same point in which the half-maximum of the steady-state activation of ionic current was reached in the CaV3.3 channel (Figure 1 E; measured in the absence of Er3+). About 60% of the total ON-charge was transferred when 80% of total ionic current was saturated. In the ID12 channel voltage dependencies of the ON-charge and the first component of steady-state activation nearly overlapped (Figure 1 F). When the steady-state activation saturated, about 80% of ON-charge was transferred.
Acceleration of gating current traces in the ID12 construct was apparent (Figure 1 A and B). In Figure 2 A individual on-gating current traces measured from the CaV3.3 channel and the ID12 construct are compared at increasingly depolarizing pulses. To facilitate comparison both traces were normalized in respect to their maximal values. In the ID12 construct gating current starts almost immediately and decays rapidly. The gating current of the CaV3.3 channel rises and decays relatively slowly. The descending part of the gating current traces at depolarizations above −40 mV can be fitted by a single exponential. At lower depolarization amplitudes, the fitting procedure was not reliable due to low amplitude of the CaV3.3 gating current. As shown in the Figure 2 B, removal of the putative gating brake accelerated the ON-charge movement several-fold. OFF-charge movement (Figure 3 A) was largely unaffected. The peak of individual OFF-charge current traces (Figure 7 A) was delayed in the CaV3.3 channel, but the delay was smaller than in the case of ON-charge. Time constants of the descending part of the OFF-charge current traces were not different (Figure 7 B).
Figure 2. Effect of gating brake deletion on activation kinetics of the ON-charge.
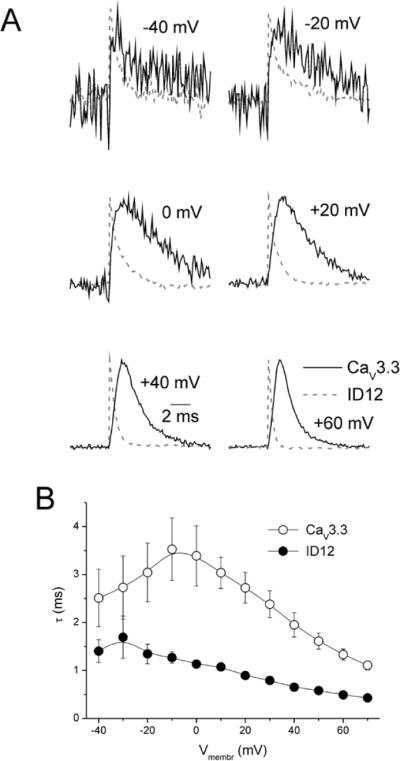
(A) Examples of on-gating currents recorded from the CaV3.3 channel (solid black lines) and from the ID12 channel (dashed grey lines) are shown. Gating currents were activated by depolarizing pulses to selected membrane voltages as marked and normalized to unity. Descending parts of gating current traces activated by depolarizing pulses to membrane voltages greater or equal to −40 mV were fit by a single exponential. The time constants from these fits were averaged and plotted versus membrane depolarization in (B).
Figure 3. Effect of gating brake deletion on activation kinetics of the OFF-charge.
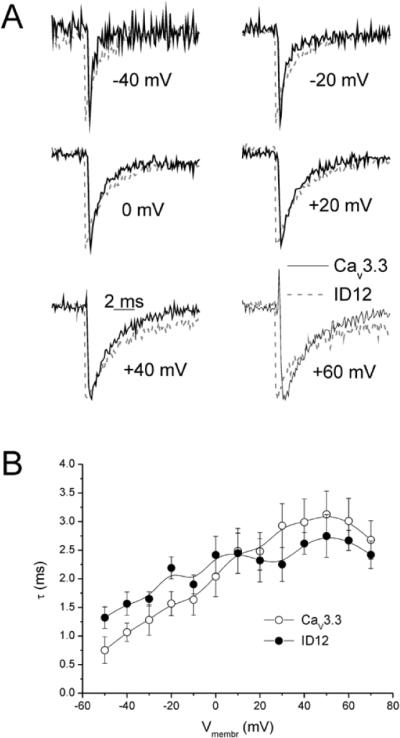
(A) Examples of off-gating currents recorded from the CaV3.3 channel (solid black lines) and from the ID12 channel (dashed grey lines) are shown. Gating currents were activated by depolarizing pulses to selected membrane voltages as marked and normalized to unity. The descending parts of gating current traces activated by depolarizing pulses to membrane voltages greater or equal to −50 mV were fit by a single exponential. The time constants from these fits were averaged and plotted versus membrane depolarization in (B).
To compare total coupling between charge movement and current activation, we compared the inward current amplitude measured during depolarization to −30 mV (peak of IV relation) normalized by the maximal value of Qon in each individual cell. In the ID12 channel, current amplitude increased more rapidly with increasing ON-charge movement. In agreement with previous report of Baumgart and coauthors [4] the ratio of maximal ON-charge movement and peak current amplitude Qonmax/I(−30) were 0.75±0.14 and 0.29±0.02 for the CaV3.3 and ID12 channels, respectively. This increase was statistically significant (p < 0.01).
Discussion
This study investigated the role of the putative gating brake in the I-II loop of the CaV3.3 channel in channel gating currents. The effects on the activation of macroscopic inward current were described previously [4]. Here we report a significant acceleration and a hyperpolarizing shift of the “on” charge movement and a hyperpolarizing shift of the “off” charge movement caused by deletion of the gating brake.
The ON-charge reflects the upward movement of charged S4 segments, which precedes the conformational change of the channel pore corresponding to the activation of inward current. It has been commonly observed that the threshold for gating current activation is more than 20 mV more negative than the threshold for activation of inward current [12–14, 24, 28] in high-voltage activated (HVA) calcium channels. Further, in HVA calcium channels, the whole curve depicting voltage dependence of channel gating is shifted to more negative membrane potentials than the curve depicting voltage dependence of current activation. Parallel to what we have observed for low-voltage activated (LVA) CaV3.1 channel [18], gating current and inward current from the CaV3.3 channel were first observed at similar membrane voltages. For measurement of CaV3.1 channel gating La3+ was used as a channel blocker [18, 30]. For complete inhibition of inward current 1 mM concentration was necessary, a relatively high concentration that may have contributed to surface charge screening [25]. It was suggested that such a shift may contribute to the lack of a negative shift between voltage dependence of gating and inward currents [7]. However, the same lack of negative voltage shift between onset of charge movement and inward current activation was observed in the present studies using 300-fold lower concentration (30 μM) of channel blocker, which argues against such an explanation.
The voltage dependence of Qon activation was 1.5-fold less steep than the voltage dependence of activation of macroscopic inward current in the CaV3.3 channel. As a consequence, saturation of the steady-state current activation corresponds to transfer of 80% of total charge movement. Deletion of the gating brake in the ID12 channel had little or no effect on the apparent voltage sensitivity of gating charge movement (dV 14.0 vs. 17.4 mV for ID12 and CaV3.3 channels, respectively, p=0.09). The shift in the voltage dependence of gating current towards more negative membrane potentials was bigger (−35 mV) than the hyperpolarizing shift of voltage dependence of channel opening (−12 mV). As a result, the voltage dependencies of gating current and inward current nearly overlap for the ID12 channel and steady-state current activation reaches its maximum at the same membrane voltage at which virtually all S4 segments are activated. A notable difference between Cav3.1 [18] and 3.3 is their coupling between charge movement and channel opening, as 100% activation of ionic current only requires 20% of total charge movement of Cav3.1 but 80% total charge movement of Cav3.3. A second interesting difference is the voltage sensitivity of the gating charge movement as assessed from the slope factors (dV): 22 mV for Cav3.1, and 11 mV for Cav3.3, resulting in a broader activation range for Cav3.3 channels.
Removal of the gating brake accelerated the ON-, but not the OFF-charge movement. Acceleration of the activation gating paralleled acceleration of the inward current consistently observed in all three CaV3 channels [3, 4, 31]. This effect was particularly prominent in slowly activating the CaV3.3 channel [4]. The concurrent hyperpolarizing shift of voltage dependence of channel activation was less prominent in the CaV3.3 channel than in the CaV3.1 and CaV3.2 channels [4]. In parallel, gating brake removal accelerated significantly the activation movement of the S4 segments and caused a substantial hyperpolarizing shift of its voltage dependence.
The kinetics of the OFF-charge were not significantly affected. This observation matches the lack of effect on deactivation kinetics of inward current, but contrasts to the reported acceleration of current inactivation in mutated channels [4]. Lack of correlation with inactivation kinetics is in agreement with our previous observation that prolonged depolarization does not immobilize Qoff in T-type calcium channels [18].
Baumgart and co-authors [4] demonstrated that the ratio of I(max)/Q(rev), which is proportional to the opening probability of the channels [1, 4], doubled upon removal of the gating brake. Q(rev) represents charge movement measured at the reversal potential of each investigated channel. However, because of the substantial voltage shift of Qon, voltage dependence upon gating brake deletion Q(rev) may not represent the maximal charge movement Q(max). Therefore we repeated this analysis using maximal values of macroscopic inward current I(−30) and maximal charge movement Q(max). Consistent with previous findings [4], the I(−30)/Q(max) value more than doubled, indicating an increase in the probability of channel opening (Po). In the absence of the gating brake, channel opening was facilitated independent of any differences in the plasma membrane expression of the channels.
Two models of how the gating brake may interact with the channel and thereby stabilize closed states have been proposed [27]. These models are based on the crystal structure of a tetramer of Kv1.2–Kv2.1 chimeric channels [22]. Two notable features of the crystal structure are: 1) that the S5-P loop-S6 segments from one subunit are interdigitated with a second subunit; and 2) that the S6 segments project from the central pore back to the S1–S4 gating paddle of the same subunit. Based on the relatively high homology of a Kv channel subunit to each of the four repeats of Cav channels [11], it is likely that Cav and Nav channels have a similar structure. Combining this hypothesis with a clockwise orientation of the repeats [21], suggests that the gating brake could physically interact with both the gating machinery of repeat I and II, and allosterically with the other two repeats. This could explain why deletion of the gating brake shifted the entire Q(V) curve, rather than just affecting the movement of one of the four repeats.
In conclusion, we have shown that the gating brake controls not only pore opening, but also the movement of the S4 segments. Because its removal had a major effect on the charge movement and coupling between charge movement and channel opening, we hypothesize that the gating brake acts to stabilize S4 voltage sensors in the closed state, possibly by interacting directly with S4–S5 linkers that mediate opening of the cytoplasmic pore gate.
Acknowledgements
Supported by VVCE-0064-07 and VEGA 2/0195/10. Supported by National Institute of Health grant NS067456 (EPR) and Ruth L. Kirchstein National Research Service Award No. T32 DA07274-18 (JPB). The authors wish to thank Mrs. Emilia Kocurova for excellent technical asistance.
References
- 1.Agler HL, Evans J, Tay LH, et al. G protein-gated inhibitory module of N-type (Cav2.2) Ca2+ channels. Neuron. 2005;46:891–904. doi: 10.1016/j.neuron.2005.05.011. [DOI] [PubMed] [Google Scholar]
- 2.Arias JM, Murbartian J, Vitko I, et al. Transfer of beta subunit regulation from high to low voltage-gated Ca2+ channels. FEBS Lett. 2005;579:3907–3912. doi: 10.1016/j.febslet.2005.06.008. [DOI] [PubMed] [Google Scholar]
- 3.Arias O, II, Vitko I, Fortuna M, et al. Characterization of the gating brake in the I–II loop of Cav3.2 T-type Ca2+ channels. J Biol Chem. 2008;283:8136–8144. doi: 10.1074/jbc.M708761200. [DOI] [PMC free article] [PubMed] [Google Scholar]
- 4.Baumgart JP, Vitko I, Bidaud I, et al. I–II loop structural determinants in the gating and surface expression of low voltage-activated calcium channels. PLoS One. 2008;3:e2976. doi: 10.1371/journal.pone.0002976. [DOI] [PMC free article] [PubMed] [Google Scholar]
- 5.Bezanilla F. How membrane proteins sense voltage. Nat Rev Mol Cell Biol. 2008;9:323–332. doi: 10.1038/nrm2376. [DOI] [PubMed] [Google Scholar]
- 6.Chen Y, Lu J, Pan H, et al. Association between genetic variation of CACNA1H and childhood absence epilepsy. Ann Neurol. 2003;54:239–243. doi: 10.1002/ana.10607. [DOI] [PubMed] [Google Scholar]
- 7.Freeze BS, McNulty MM, Hanck DA. State-dependent verapamil block of the cloned human Cav3.1 T-type Ca2+ channel. Mol Pharmacol. 2006;70:718–726. doi: 10.1124/mol.106.023473. [DOI] [PubMed] [Google Scholar]
- 8.Gomora JC, Murbartián J, Arias JM, et al. Cloning and expression of the human T-type channel Cav3.3: insights into prepulse facilitation. Biophys J. 2002;83:229–241. doi: 10.1016/s0006-3495(02)75164-3. [DOI] [PMC free article] [PubMed] [Google Scholar]
- 9.Hamid J, Peloquin JB, Monteil A, et al. Determinants of the differential gating properties of Cav3.1 and Cav3.3 T-type channels: a role of domain IV? Neuroscience. 2006;143:717–728. doi: 10.1016/j.neuroscience.2006.08.023. [DOI] [PubMed] [Google Scholar]
- 10.Hofmann F, Lacinova L, Klugbauer N. Voltage-dependent calcium channels: from structure to function. Rev Physiol Biochem Pharmacol. 1999;139:33–87. doi: 10.1007/BFb0033648. [DOI] [PubMed] [Google Scholar]
- 11.Jan LY, Jan YN. A superfamily of ion channels. Nature. 1990;345:672. doi: 10.1038/345672a0. [DOI] [PubMed] [Google Scholar]
- 12.Jones LP, Patil PG, Snutch TP, et al. G-protein modulation of N-type calcium channel gating current in human embryonic kidney cells (HEK 293) J Physiol. 1997;498(Pt 3):601–610. doi: 10.1113/jphysiol.1997.sp021886. [DOI] [PMC free article] [PubMed] [Google Scholar]
- 13.Jones LP, Wei SK, Yue DT. Mechanism of auxiliary subunit modulation of neuronal α1E calcium channels. J Gen Physiol. 1998;112:125–143. doi: 10.1085/jgp.112.2.125. [DOI] [PMC free article] [PubMed] [Google Scholar]
- 14.Josephson IR. Kinetic components of the gating currents of human cardiac L-type Ca2+ channels. Pflugers Arch. 1997;433:321–329. doi: 10.1007/s004240050283. [DOI] [PubMed] [Google Scholar]
- 15.Khosravani H, Altier C, Simms B, et al. Gating effects of mutations in the Cav3.2 T-type calcium channel associated with childhood absence epilepsy. J Biol Chem. 2004;279:9681–9684. doi: 10.1074/jbc.C400006200. [DOI] [PubMed] [Google Scholar]
- 16.Kim D, Song I, Keum S, et al. Lack of the burst firing of thalamocortical relay neurons and resistance to absence seizures in mice lacking α T-type Ca2+ channels. Neuron. 2001;31:35–45. doi: 10.1016/s0896-6273(01)00343-9. [DOI] [PubMed] [Google Scholar]
- 17.Klockner U, Lee JH, Cribbs LL, et al. Comparison of the Ca2+ currents induced by expression of three cloned α1 subunits, α1G, α1H and α1I, of low-voltage-activated T-type Ca2+ channels. Eur J Neurosci. 1999;11:4171–4178. doi: 10.1046/j.1460-9568.1999.00849.x. [DOI] [PubMed] [Google Scholar]
- 18.Lacinova L, Klugbauer N, Hofmann F. Gating of the expressed Cav3.1 calcium channel. FEBS Lett. 2002;531:235–240. doi: 10.1016/s0014-5793(02)03509-3. [DOI] [PubMed] [Google Scholar]
- 19.Lee JH, Daud AN, Cribbs LL, et al. Cloning and expression of a novel member of the low voltage-activated T-type calcium channel family. J Neurosci. 1999;19:1912–1921. doi: 10.1523/JNEUROSCI.19-06-01912.1999. [DOI] [PMC free article] [PubMed] [Google Scholar]
- 20.Li J, Stevens L, Klugbauer N, et al. Roles of molecular regions in determining differences between voltage dependence of activation of CaV3.1 and CaV1.2 calcium channels. J Biol Chem. 2004;279:26858–26867. doi: 10.1074/jbc.M313981200. [DOI] [PubMed] [Google Scholar]
- 21.Li RA, Ennis IL, French RJ, et al. Clockwise domain arrangement of the sodium channel revealed by μ-conotoxin (GIIIA) docking orientation. J Biol Chem. 2001;276:11072–11077. doi: 10.1074/jbc.M010862200. [DOI] [PubMed] [Google Scholar]
- 22.Long SB, Campbell EB, Mackinnon R. Crystal structure of a mammalian voltage-dependent Shaker family K+ channel. Science. 2005;309:897–903. doi: 10.1126/science.1116269. [DOI] [PubMed] [Google Scholar]
- 23.Marksteiner R, Schurr P, Berjukow S, et al. Inactivation determinants in segment IIIS6 of Cav3.1. J Physiol. 2001;537:27–34. doi: 10.1111/j.1469-7793.2001.0027k.x. [DOI] [PMC free article] [PubMed] [Google Scholar]
- 24.Neely A, Wei X, Olcese R, et al. Potentiation by the β subunit of the ratio of the ionic current to the charge movement in the cardiac calcium channel. Science. 1993;262:575–578. doi: 10.1126/science.8211185. [DOI] [PubMed] [Google Scholar]
- 25.Ohmori H, Yoshii M. Surface potential reflected in both gating and permeation mechanisms of sodium and calcium channels of the tunicate egg cell membrane. J Physiol. 1977;267:429–463. doi: 10.1113/jphysiol.1977.sp011821. [DOI] [PMC free article] [PubMed] [Google Scholar]
- 26.Perez-Reyes E. Molecular physiology of low-voltage-activated T-type calcium channels. Physiol Rev. 2003;83:117–161. doi: 10.1152/physrev.00018.2002. [DOI] [PubMed] [Google Scholar]
- 27.Perez-Reyes E. Characterization of the gating brake in the I–II loop of CaV3 T-type calcium channels. Channels. doi: 10.4161/chan.4.6.12889. in press. [DOI] [PMC free article] [PubMed] [Google Scholar]
- 28.Qin N, Olcese R, Stefani E, et al. Modulation of human neuronal α1E-type calcium channel by α2δ-subunit. Am J Physiol. 1998;274:C1324–1331. doi: 10.1152/ajpcell.1998.274.5.C1324. [DOI] [PubMed] [Google Scholar]
- 29.Swartz KJ. Sensing voltage across lipid membranes. Nature. 2008;456:891–897. doi: 10.1038/nature07620. [DOI] [PMC free article] [PubMed] [Google Scholar]
- 30.Talavera K, Nilius B. Evidence for common structural determinants of activation and inactivation in T-type Ca2+ channels. Pflugers Arch. 2006;453:189–201. doi: 10.1007/s00424-006-0129-7. [DOI] [PubMed] [Google Scholar]
- 31.Vitko I, Bidaud I, Arias JM, et al. The I–II loop controls plasma membrane expression and gating of Cav3.2 T-type Ca2+ channels: a paradigm for childhood absence epilepsy mutations. J Neurosci. 2007;27:322–330. doi: 10.1523/JNEUROSCI.1817-06.2007. [DOI] [PMC free article] [PubMed] [Google Scholar]