

Abstract
Genetic interactions regulating intermediate stages of tubulogenesis in the developing kidney have been difficult to define. A systems biology strategy using microarray was combined with in vitro/ex vivo and genetic approaches to identify pathways regulating specific stages of tubulogenesis. Analysis of the progression of the metanephric mesenchyme (MM) through four stages of tubule induction and differentiation (i.e., epithelialization, tubular organization and elongation and early differentiation) revealed signaling pathways potentially involved at each stage and suggested key roles for a number of signaling molecules. A screen of the signaling pathways on in vitro/ex vivo nephron formation implicated a unique regulatory role for Protein Kinase A (PKA), through PKA-2, in a specific post-epithelialization morphogenetic step (conversion of the renal vesicle to the S-shaped body). Microarray analysis not only confirmed this stage-specificity, but also highlighted upregulation of Wnt genes. Addition of PKA agonists to LIF-induced nephrons (previously shown to be a Wnt/beta-catenin dependent pathway) disrupted normal tubulogenesis in a manner similar to PKA-agonist treated MM/spinal-cord assays, suggesting PKA regulates a Wnt-dependent tubulogenesis step. PKA induction of canonical Wnt signaling during tubulogenesis was confirmed genetically using MM from Batgal-reporter mice. Addition of a Wnt synthesis inhibitor to activated PKA cultures rescued tubulogenesis. By re-analysis of existing microarray data from the FGF8, Lim1 and Wnt4 knockouts, which arrest in early tubulogenesis, a network of genes regulating the transition of nascent epithelial cells to tubular epithelium was derived, helping to reconcile in vivo and in vitro/ex vivo data.
Keywords: kidney development, mesenchyme, epithelial tubulogenesis
Introduction
The two tissues from which the more than 20 different cell types of the metanephric kidney are derived are the ureteric bud (UB) and the metanephric mesenchyme (MM) (Saxen 1987). At the onset of metanephric kidney development, the UB emerges as an epithelial offshoot of the Wolffian duct (the main collecting duct of the mesonephric kidney) and invades a cluster of mesenchymal cells, the MM, where it initiates a series of reciprocal signaling events between the two progenitor tissues. The ultimate results of these mutually inductive interactions are development of the renal collecting system (from dichotomous branching morphogenesis and differentiation of the UB) and the development of epithelial nephrons (from epithelialization, tubulogenesis and differentiation of the MM).
Upon reception of the inductive stimulus from the UB, the MM undergoes mesenchymal to epithelial transformation (MET), followed by tubular morphogenesis. The nascent nephron epithelium progresses through histologically well-defined stages: renal vesicle, comma-shaped body, S-shaped body, elongation, and finally segment differentiation. This stereotypical process leads to a specific architectural and functional arrangement of segmented nephrons within the kidney. Molecular markers for the morphological stages of nephrogenesis have been identified, including Brn1, Notch2 and Irx3, which delineate subpopulations of the early nephron for ultimate segmentation (Nakai et al. 2003; Cheng et al. 2007; Reggiani et al. 2007). However, the underlying genetic and inter/intracellular signaling mechanisms responsible for driving the morphological changes during nephron formation remain to be fully elucidated (Horster et al. 1999; Schmidt-Ott et al. 2006).
Although gene mutation and deletion studies have proven valuable in the identification of genes critical to a number of morphogenetic steps in kidney development, only a few genes or pathways have been identified which specifically perturb intermediate steps in tubulogenesis during nephron formation after mesenchymal to epithelial transformation. For example, deletion of Wnt4 results in failure of the MM to undergo the initial stages of epithelial transformation, resulting in failure of nephrogenesis, and ultimately in the degeneration of the developing organ (Stark et al. 1994). In contrast, mutation of cadherin-6 also affects the developing epithelial structures of the nephron, but in this case, epithelial transformation of the MM is inefficient and many nascent tubules do not fuse to the UB, resulting in reduced nephron number in viable adults (Mah et al. 2000). Other mutations apparently affect later steps in nephron formation and/or segment differentiation. For example, PKD1 mutant animals that express reduced quantities of Polycystin-1 display a renal cyst phenotype, but only after formation of the renal tubules (Lantinga-van Leeuwen et al. 2004). Deletion of the transcription factor HNF1 leads to a defects in terminal differentiation of the proximal tubule (Pontoglio et al. 1996). Thus, these well-known examples either affect very early or very late steps in nephron formation but not tubulogenesis specifically.
In contrast, the Lim1 (Lhx1) null mutant animal (Shawlot and Behringer 1995) does not develop kidneys, and MM-specific conditional knockouts later revealed development of the nephron to the renal vesicle but not beyond (Kobayashi 2005; Potter 2007). This, along with the FGF8 knockout, is one of the few examples of an intermediate phenotype - where the nephron develops to a certain morphological stage (e.g., renal vesicle) and then ceases to progress further along the typical developmental path (Perantoni et al. 2005). Thus, much remains to be elucidated about the genes and/or gene networks involved in the intermediate stages of tubulogenesis during development of the epithelial nephron.
Detailed transcriptomic profiling of the developing kidney, in vivo as well as in vitro, has been performed by a number of laboratories (Stuart et al. 2001; Challen et al. 2005). First rat, then mouse, time-course analyses delineated gene expression dynamics from the earliest nascent organ through adulthood. Along with these whole organ data sets, in vitro tubulogenesis models directly bearing on kidney development (MM induced tubulogenesis by co-culture with spinal cord or treatment with Leukemia Inhibitory Factor, LIF) have been examined by global gene expression time course microarray (Stuart et al. 2003; Schmidt-Ott et al. 2007a). The results of these early in silico analyses suggested significantly regulated genes, sometimes including examination of a specific gene or highly represented pathway. More recently, a consortium has published the Genitourinary Database Molecular Anatomy Project (GUDMAP) database which serves as a repository of large scale data, including microarrays on micro-anatomic renal subcomponent structures (i.e. comma and S-shaped bodies) of the developing kidney isolated during development (Brunskill et al. 2008; McMahon et al. 2008). Computational analysis of detailed time series global microarray data have identified stages of kidney development not obvious morphologically (Tsigelny et al. 2008).
Despite the wealth of information garnered from such wide-scale differential expression studies, it is now becoming clear that such experiments contain much more information than simply patterns of gene expression. Thus, in order to move past exhaustive lists of differentially expressed genes and to better understand the roles of genes in the development of a complex anatomical and physiologically critical structure, such as the nephron, it is clear that genes need to be studied in the context of interacting networks in which they exert their effects, followed by testing of network predictions.
Metanephric mesenchyme (MM) is largely un-induced when it is micro-dissected and isolated from the e13 embryonic rat kidney and when cultured it will undergo apoptosis and involution if additional morphogenetic stimuli are not provided (Koseki et al. 1992; Koseki 1993; Barasch et al. 1999). However, in the presence of UB, a heterologous inductive tissue (i.e., spinal cord) (Grobstein 1953; Grobstein 1956), cultured isolated UB (Qiao et al. 1999; Rosines et al. 2007a; Shah et al. 2009), cell conditioned media (Barasch et al. 1999), or exogenously added growth factors (notably LIF in combination with FGF2 and TGFβ (Barasch et al. 1999; Plisov et al. 2001), the isolated MM can be induced to undergo mesenchymal-to-epithelial transition (MET) and form early tubular structures reminiscent of the developing nephron. In addition, inhibitors of glycogen synthase kinase-3 (GSK3) are also capable of inducing the formation of pre-tubular aggregates (Davies and Garrod 1995; Oxburgh and Robertson 2002; Kuure et al. 2007) which only formed epithelial tubules if the inhibitors were removed before 2 days of exposure (Kuure et al. 2007). All these in vitro systems permit visualization and analysis of epithelialization, tubulogenesis and differentiation of the MM in isolation. Importantly, most studies to date have focused on the epithelialization rather than tubulogenesis (as we do here).
Results
Here a systems level analysis on the early stages of renal tubulogenesis has been performed. The approach utilized multiple gene expression datasets that individually examined nephron formation in different model systems. The resulting networks provide the information for molecular controls over multiple stages of nephron formation. Here the focus is on the formation of the early epithelial tubule from the pre-tubular aggregate of induced MM to the early tubule.
Morphologic and biochemical examination of ex vivo metanephric tubulogenesis supports four distinct stages of tubule development
Metanephric mesenchyme (MM) isolated from the kidney rudiments of e13 rat embryos was co-cultured with embryonic spinal cord (5 MMs per spinal cord, also from e13 rat embryos), and cultured for up to a week. The developing tubules were examined by staining for markers of development and differentiation. Four stages of nephron formation and renal tubulogenesis were defined: un-induced MM (Figure 1A), induced non-epithelial MM (Figure 1B), early epithelial structures (Figure 1C), and differentiating tubules (Figure 1D). Previous analysis of the culture model has indicated that a 24 hour period of MM co-culture with spinal cord is sufficient to complete maximal induction (Saxen 1987). MM (freshly isolated in Figure 1A) expresses Pax2 in cells that have received a signal to undergo nephrogenesis (Figure 1B). The epithelium that results organized into an epithelium which undergoes tubular morphogenesis, developing into S-shaped bodies by 3 days (Figure 1C). At 5 days of culture, long tubules are readily visible which have clusters of peanut-lectin (PNA) positive cells at their ends (Figure 1D), indicative of glomerular podocyte differentiation (Holthofer and Virtanen 1987).
Figure 1. Biochemical and morphological analyses identify distinct stages of in vitro renal tubule development.

Metanephric mesenchyme (MM) was induced to form epithelial renal tubules by co-culture with spinal cord for up to a week. The development of the tubules was examined using imaging techniques highlighting several distinct stages of development. (A) Freshly isolated MM. Scale bar is 100μm. (B) The tissue undergoes mesenchymal to epithelial transition and begins epithelial tubule morphogenesis by 2 days of culture. Pax-2 (red) expression is seen throughout the tissue, especially in a band (arrow) adjacent to the spinal cord. E-cadherin (green) expression in nascent epithelium is evident in cell clusters. Scale bar is 100μm. (C) By 3 days, S-shaped bodies have formed. Scale bar is 100μm. (D) At 5 days elongated tubules (E-cadherin, green) are interspersed with developing podocytes (PNA, red). Scale bar is 50μm.
A systems biology analysis of renal tubulogenesis predicts pathways essential to tubule development
As described above (Figures 1A–D), biochemical analysis of spinal cord-induced MM tubulogenesis revealed four stages of nephron development. However, regulation of the transitions between the stages of renal tubule development remains to be defined. To address this, microarray time course data from previously published spinal cord- and LIF-induced MM experiments were analyzed in an attempt to identify temporally regulated molecular interactions from the dynamically expressed genes in related data sets (Stuart et al. 2003; Schmidt-Ott et al. 2007b). The microarray experiments were analyzed for significant change by traditional ANOVA using Agilent’s Genespring GX software, as well as by use of the Extraction of Differential Gene Expression (EDGE) software package (Leek et al. 2006). EDGE was designed to identify genes (microarray probes) which change over a time course, and can identify temporal regulation even if there is no significant change from condition-to-condition (Schmidt-Ott et al. 2007a). These two methods yielded partially overlapping “significant gene” lists. Analysis of the MM-spinal cord co-culture microarray data set yielded 1171 significantly changing microarray probes. The analysis of the LIF-induced MM data set yielded 1554 probes. Each of the methods produced gene lists with informative temporal profiles (clusters of genes with peak expression at different points in culture). Thus, all four of the gene lists (Genespring and EDGE, from spinal cord and LIF models) were combined. The list was reduced by filtering on the gene ontology term “development”.
Small molecule screen of signaling pathways potentially regulating tubulogenesis
Given the fact that the emphasis of the computational studies was on identifying putative genetic networks regulating stage transitions during tubulogenesis, it was hypothesized that perturbations of signaling pathways that affect tubule morphogenesis would indicate molecular regulators of the stage transitions. A list of transcriptionally regulated kinases, derived from the ex vivo tubulogenesis microarray data sets, was used as the basis of signaling pathways to test in the screen.
The MM-spinal cord assay on trans-well filters is not amenable to a high throughput small molecule screen; it is amenable to a low-medium throughput screen (tens of conditions with replicates) of small molecules targeting many of the signaling pathways identified computationally, as described above. Thus, a screen was performed by modulating the function of the principal kinase of each pathway in the spinal cord-induced tubulogenesis model (each with N=2 to 3, requiring 5 MM tissues per experiment). In the screen, 6 compounds were found to have a stimulatory or inhibitory effect on tubule morphogenesis in in vitro MM-spinal cord co-culture assays of nephron formation (Figure 2 and Table 1). Control cultures (Figure 2A) develop many long tubules. Several common pathways, exemplified by PI3K inhibition (Figure 2B), do not affect tubulogenesis. While the screen identified several interesting morphogenetic lesions, none was as striking as activation of PKA with dibutyryl-cAMP (Figure 2C), which appeared to arrest tubular morphogenesis at a relatively specific point soon after mesenchyme to epithelium transition, likely between the renal vesicle stage and formation of the nascent tubule. The renal vesicle expanded into a disorganized epithelium. Since PKA activation resulted in a “stage-specific” lesion, we focused on this pathway.
Figure 2. Signaling pathway tubulogenesis screen implicates PKA regulation in tubule formation from renal vesicles.

(A) Ex vivo culture of MM results in robust tubule growth, recapitulating much of early nephron development. A tubule is outlined and indicated by an arrowhead. Several pathways identified in the ex vivo culture microarray analysis had no effect on tubule growth, such as inhibition of PI3 Kinase (arrowheads mark representative tubules, one is outlined) (B). Activation of PKA with dibutyryl-cAMP (C) yielded epithelial clusters (circled), with a lesion of tubulogenesis following renal vesicle formation. All scale bars are 100μm.
Table 1. Screen of signaling molecules identified in pathways analysis of in vivo and in vitro renal tubule development.
(A) Screens of perturbation experiments using 10 different pathway inhibitors and activators were performed in spinal cord-induced MM cultures. All molecules were added to the culture media at the onset of culture. Of the pathways tested, 6 affected the rate or quality of tubulogenesis while 4 did not. Protein Kinase A activation had a strong stage-specific lesion on renal tubulogenesis in which epithelialization occurred but tubulogenesis was perturbed.
| Pathway | Molecule | Result |
|---|---|---|
| PKC (inhibitor) | Calphostin C | No mesenchyme to epithelium transition |
| MEK (inhibitor) | MEK inh. II | Inefficient organization, tubules form |
| PKA (activator) | dbcAMP | Vesicles, no tubules |
| p160/ROCK II (inhibitor) | Y-27632 | Inefficient vesicle formation, tubules form |
| p38 MAPK (inhibitor) | SB 203580 | Tubule dilation |
| PKG (activator) | 8Br-cGMP | Reduction in speed of tubule formation |
| PKG (inhibitor) | KT5823 | no effect |
| AKT 1/2/3 (inhibitor) | AKT IV | no effect |
| JNK 1–3 (inhibitor) | JNK II inh. | no effect |
| PI3K (inhibitor) | LY 294002 | no effect |
Perturbation of PKA signaling by multiple well-characterized pathway modulators indicates an essential role for PKA-2 in renal tubule morphogenesis
To clarify the mechanism of the PKA induced tubulogenesis defect, the PKA signaling pathway was analyzed using molecules targeted to multiple molecules of the signaling cascade (Figures 3, 4, and 5). Stimulation of cAMP production by addition of the adenylate cyclase activator, forskolin, to the culture media caused a similar, yet less extreme, disruption of tubulogenesis to that observed by the addition of the cAMP analogue dibutyryl-cAMP. Tubulogenesis appeared to accelerate when PKA activity was reduced upon treatment with the Walsh PKA inhibitory peptide, 14–22 (Glass et al. 1989).
Figure 3. Renal tubulogenesis is prevented by activation of PKA-2 but not PKA-1.

(A) Spinal cord induced MM develops long convoluted epithelial tubules, with apical expression of ZO-1 (red) and lateral expression of E-Cadherin (green). (B) Activation of PKA-1 by isozyme specific cAMP analogues does not impair tubule formation. (C) Activation of PKA-2 by isozyme specific cAMP analogues prevents tubule formation from renal vesicles, resulting in disorganized epithelial clusters and large dilations, recapitulates the developmental lesion by activation of PKA with dbcAMP (shown in Figure 2C). A–C Scale bars are 100μm. (D) Volumetric analysis of control cultures indicates long continuous staining regions of ZO-1 shown as objects, each continuous section with a distinct (arbitrary) color. The control tissue is primarily comprised of two large objects, representing large continuous tubules. (E) Analysis of PKA-1 activated samples indicates many objects with continuous ZO-1 expression, and many of the objects can be seen to connect in the fluorescent mode of the z-stack. (F) Activation of PKA-2 results in a single mass of epithelium, in which only one distinct object can be discerned. D–F, Scale bars are 140μm. The images shown in A–C are the same images for which analysis is shown in D–F.
Figure 4. Inhibition of AKAP function delays tubulogenesis.
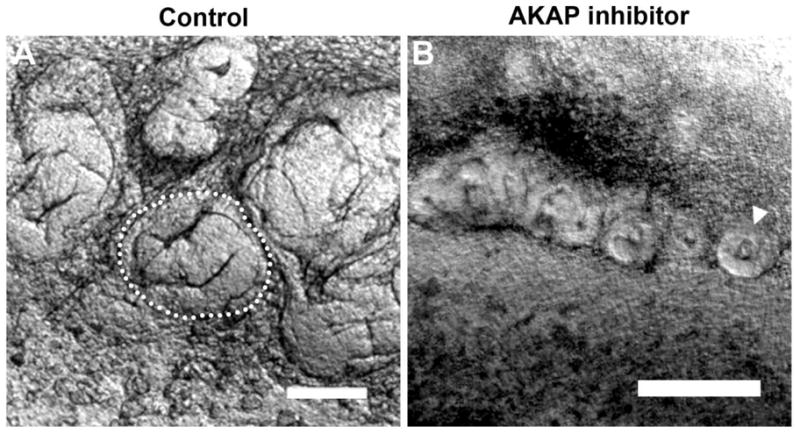
Inhibition of AKAPs results in a delay of tubule formation. (A) At 72 hours control cultures have developed into S-shaped bodies. (B) At 72 hours, AKAP inhibitor samples have developed renal vesicles (arrowhead). Scale bars are 100μm.
Figure 5. Modulation of the PKA pathway identified PKA-2 as a regulator of tubule morphogenesis.

Spinal cord-induced MM was treated with PKA pathway signaling modulators and observed for defects in tubule morphogenesis. (A) Activation of PKA by stimulation of cAMP production (forskolin) or by adding cAMP analogues (dibutyryl-cAMP) prevented tubular morphogenesis. Activation of PKA-1 (8-PIP-cAMP and 8-HA-cAMPS) and Epac (8-CPT-2-O-Me-cAMP) did not inhibit tubulogenesis while activation of PKA-2 (6-MBC-cAMP and Sp-5,6-DCl-cBIMPS) prevented tubule formation. Inhibition of PKA with the Walsh PKA inhibitory peptide, 14–22 stimulated tubulogenesis. (B) Cartoon demonstrating the PKA pathway and the effects of modulation of specific parts on tubulogenesis demonstrates activation of the PKA pathway at different levels prevents tubulogenesis.
We sought to identify whether the key isoform was PKA-1 or PKA-2. Analysis of the PKA-1 and PKA-2 isoforms was done by using cell permeable cAMP analogue combinations which preferentially activate one isoform (Schwede et al. 2000). As shown in Figure 3, activation of PKA-1 with 8-PIP-cAMP and 8-HA-cAMPS did not affect tubulogenesis, while activation of PKA-2 with 6-MBC-cAMP and Sp-5,6-DCl-cBIMPS caused a robust inhibition of epithelial morphogenesis similar to the effect of dibutyryl-cAMP (shown in Figure 2C). Analysis of ZO-1 expression in z-stack confocal images of these cultures (Figure 3D–F) shows that there are long continuous domains of ZO-1 expression (each continuous domain is identified by a different color), indicating a tubule with a continuous lumen in control conditions and under PKA-1 activation. However, in cultures with activated PKA-2, the ZO-1 expression is restricted to many discrete clumps and to large sheets, which cannot be discerned as tubules. Modulation of intracellular cAMP leading to disrupted tubulogenesis was not due to the exchange protein activated by cAMP (Epac) because when Epac was stimulated using the cAMP analogue 8-CPT-2′-O-Me-cAMP, it did not disrupt tubulogenesis (not shown). Addition of a pan-A kinase anchor protein (AKAP) inhibitor (St-Ht31) delayed epithelial tubule morphogenesis (Figure 4). Disruption of AKAP- PKA interaction caused a delay in otherwise normal development. While the S-shaped body is apparent at 72 hours in control cultures (Figure 4A), samples treated with AKAP inhibitor require 72 hours to form renal vesicles (Figure 4B).
Protein Kinase A signaling disrupts early tubulogenesis but not epithelialization
Protein Kinase A (PKA) signaling is known to affect epithelial tubulogenesis in cultured cells. For example, in a three dimensional MDCK cell culture tubulogenesis model the addition of the cAMP analogue dibuytryl-cAMP prevented the morphogenesis of epithelial cell aggregates into multi-cellular tubule-like structures and formed cysts (Santos et al. 1993). Moreover, pathways analysis, while not statistically rigorous, suggests that PKA is an essential signaling pathway of early micro-anatomic structures including the metanephric mesenchyme, cap mesenchyme and renal vesicle, but not in the S-shaped body (Supplementary Table 1). This suggests that PKA could be a key regulator of the transition from a pre-tubular epithelial structure to the nascent tubule. In support of this notion, activation of PKA did not block the mesenchymal to epithelial transition (MET) in spinal cord- induced MM, but once epithelialization occurs the formation of S-shaped bodies and long tubules is inhibited (Figure 6). Activation of PKA using PKA-2 specific cAMP analogues prevented morphogenesis of the nascent epithelium into the characteristic tubules (Figures 6A, B). The epithelial markers E-cadherin and ZO-1 are both expressed in activated PKA cultures, however while ZO-1 appears to localize to rings (potentially demarcating apical borders of the cells), the E-cadherin is localized diffusely throughout the cell (Figure 6B). Additionally, in some cultures sustained PKA activity caused the formation of laminar dilations (Figures 6C, D) instead of an elongated tube. At high magnification a single layer of epithelial cells can be seen to line the dilation caused by sustained PKA activity (data not shown).
Figure 6. PKA agonists produce a stage specific lesion resulting in disorganized or laminar epithelial tissue in spinal cord –induced MM cultures.

(A) Control spinal cord-induced MM tubule cultures exhibit epithelial tubules at 7 days of culture, while PKA-2 agonist (6-MBC-cAMP and Sp-5,6-DCl-cBIMPS) treated samples (B) comprise epithelium which is found in disorganized clusters with mislocalized E-cadherin. A and B: E-cadherin (green), ZO-1 (red). (C) By electron microscopy, at 7 days of culture, two rows of epithelial cells can be seen with debris in the luminal space. (D) Electron micrographs of PKA-2 agonist treated cultures show a large dilation. The open area is surrounded by a single layer of epithelial cells. Scale bars: A and B, 25μm; C, 5μm; D, 100μm.
Microarray analysis of developing nephrons arrested by PKA-mediated inhibition of tubulogenesis implicates a link to Wnt/beta-catenin signaling
To examine the potential factors involved in the perturbation of tubule morphogenesis following activation of PKA, cDNA microarray data was collected. Cultures of spinal cord-induced MM treated with PKA-2 specific cAMP analogues or vehicle were collected at 3 days of culture. At that time S-shaped bodies had formed in controls, and the PKA-2 agonist treated samples were held to expanding clusters of disorganized epithelium (as described above).
Gene signatures serving as genetic markers of specific structures of the developing nephron (MM, cap mesenchyme, renal vesicle and S-shaped body) were utilized (PT specific genes shown in Figure 7B) (Brunskill et al. 2008). These genetic markers give in vivo perspective to the ex vivo culture models. Consistent with the morphological, biochemical and functional data already presented, we found that the pattern of gene expression in samples treated with PKA agonist more closely resembled the pattern seen for early nephrogenesis, while control cultures strongly expressed genes common to the in vivo genetic markers indicative of later stages nephrogenesis (Figure 7A). For example, activated PKA samples expressed 3.3-fold higher FGF8 than control cultures. FGF8 expression is required at early nephron induction, and null mutant FGF8 animals make renal vesicles, but not renal tubules (Perantoni et al. 2005). Cited1, a marker of the cap mesenchyme which is lost after induction of MET, was also upregulated 2.7-fold. Conversely, expression of the podocyte marker podocalyxin is down 3.8-fold, further indicating a lesion in early nephrogenesis. Expression of Has2, the synthetic enzyme which produces hyaluronan, is up 7.9 fold in the activated PKA-2 sample. Hyaluronan has been shown to affect renal tubule growth and differentiation (Rosines et al. 2007b). The top 1000 highest expressed genes were compared to the in vivo gene signatures of nephron precursor subcomponents from late (S-shaped body and renal corpuscle, and proximal tubule) nephron development that were used in pathways analysis (Figure 7A). The activated PKA cultures maintained high expression of a greater proportion of early (cap mesenchyme and renal vesicle) genes (data not shown), while control samples are beginning to express many genes associated with the differentiating nephron.
Figure 7. Transcriptomic analysis reveals the rate-limiting step of the lesion to be the renal vesicle.

Control and PKA-2 agonist (6-MBC-cAMP and Sp-5,6-DCl-cBIMPS) treated spinal cord induced MM were cultured for 3 days (the control reaches the S-shaped body, refer to figure 1D) and analyzed by cDNA microarray. (A) Highly expressed genes from control and PKA-2 agonist treated cultures were compared to gene signatures of in vivo nephrogenic intermediates. Control samples begin to express genes associated with advanced structures (S-shaped body, renal corpuscle and proximal tubule), not observed in the PKA agonist treated samples. (B) The in vivo genetic markers of the PT which was compared to the genes highly expressed in the control and PKA-2 agonist samples are highly expressed primarily in the PT. Abbreviations: RC, glomerulus/renal corpuscle; mm, metanephric mesenchyme; pt, proximal tubule; rv, renal vesicle; ss, S-shaped body; ub, ureteric bud. (C) Pathways analysis of genes passing t-test (p=0.05) and 5-fold change filtering. The Wnt/beta-catenin canonical pathway (large nodes) is highly represented in the activated PKA-2 condition (red). The pathway includes a nuclear inhibitor of PKA induced transcription (Crem). See Supplementary Tables 2 and 3 for full gene lists.
Pathways analysis was performed on a gene network made from genes highly expressed in either of the control or activated PKA-2 samples (passing t-test with FDR set to 0.05 and a 5-fold change). Visualization of highly represented pathways identified Wnt/β-Catenin signaling in the PKA activated samples (Figure 7C). The nodes identified as Wnt/β-Catenin signaling are red (highly expressed in the activated PKA-2 condition). DKK2 (Dickkopf 2, a competitive inhibitor of Wnt for access to Frizzled) is more strongly expressed in the control condition, but does not pass the stringent fold change filtering. This indicates a misregulation of Wnt signaling leading to sustained activation of the canonical Wnt pathway. Full lists of the overlapping in vivo gene signatures with the in vitro experiments (Figure 7A, C) can be found in Supplementary Tables 2 and 3.
Wnt signaling during tubulogenesis and nephron formation depends on regulation of PKA
Microarray analysis has been reported previously on a model of nephrogenesis in which isolated MM is induced in a “minimal” system by leukemia-inhibitor factor (LIF) (Schmidt-Ott et al. 2007b). This study found that the early renal tubule expresses genes which contain promoter sequences for the TCF/LEF transcriptional complex downstream of canonical Wnt signaling (Schmidt-Ott et al. 2007a). A re-analysis of the microarray data from that study was performed using the samples indicated as representative of pre- (days 3, 4, and 5) and post- Wnt/TCF expression (day 7). Pathways analysis of the genes passing a t-test with FDR set to 0.05 and a 2-fold filter showed high representation of PKA-related genes (data not shown). To examine the transition from induced cells to epithelial tubules in this “minimal” isolated MM system already known to be regulated by canonical Wnt, PKA pathway signaling modulators were added to LIF-induced MM cultures.
Addition of PKA pathway modulators to LIF-induced MM cultures gave results similar to those for the spinal cord-induced system, except that PKA agonists completely abolished epithelial morphogenesis. Inhibition of PKA directly yielded increased tubulogenesis compared to LIF alone (Table 2). These experiments suggest that down regulation of PKA signaling is required for Wnt mediated epithelial tubulogenesis in both the minimal LIF-induced MM system and the spinal cord-induced system.
Table 2. PKA regulates signaling at in LIF-induced (Wnt dependent) tubulogenesis.
LIF-induced tubulogenesis cultures were treated with PKA pathway modulators. Tubulogenesis fails when PKA is activated (dibutyryl-cAMP), and when PKA is mislocalized (AKAP-inhibition). Inhibition of PKA accelerated LIF-induced tubulogenesis similarly to that seen in spinal cord-induced MM cultures (refer to Supplemental Table 3).
| LIF induced MM | Tubulogenesis |
|---|---|
| LIF alone | Tubules |
| LIF + PKA activation | No tubules |
| LIF + PKA inhibition | Robust |
| LIF + AKAP inhibition | No tubules |
PKA regulates canonical Wnt signaling in a transgenic reporter system
To validate the PKA induced Wnt signaling observed in the pathways analysis, BAT-gal mouse embryos carrying a β-galactosidase transgene activated by nuclear β-Catenin (canonical Wnt signaling) were dissected at E11.5 and the MM was isolated and set up in cultured with age-matched spinal cords in the same manner as the previous experiments (Maretto et al. 2003). Canonical Wnt signaling was observed at 3 days of culture (Figure 8A, B) and by X-gal staining was higher in the PKA-2 activated samples than in control, demonstrating sustained canonical Wnt signaling in the PKA agonist samples. At 3 days, canonical Wnt signaling is largely absent in controls.
Figure 8. Canonical Wnt signaling is persistent under activated PKA-2.

Spinal cord-induced MM cultures were examined using tissue from Batgal mice, a genetic model of canonical Wnt signaling. Expression of beta-galactosidase (blue x-gal staining) is indicative of beta-catenin induced transcription. (A) Wnt signaling controlled Beta-galactosidase expression in BAT-gal mouse tissue is low in control cultures, and is restricted to several small epithelial clusters (arrow) but is absent from advanced epithelial structures (circled). (B) Beta-galactosidase expression is higher in PKA-2 agonist (6-MBC-cAMP and Sp-5,6-DCl-cBIMPS) treated cultures, and is found throughout all epithelial structures (large mass circled), indicating a direct relationship between PKA and Wnt controlled gene expression. All experiments were stained and imaged at 3 days of culture time. Scale bars are 100μm.
Rescue of PKA mediated inhibition of renal vesicle tubulogenesis by Wnt synthesis inhibitor
In order to mechanistically link PKA signaling through Wnt to the defect in tubule formation, we then decided to inhibit Wnt signaling in the context of sustained PKA activation. The Wnt synthesis inhibitor, IWP-2, was added to spinal cord-induced MM cultures at 2 days, once renal vesicles (Wnt dependent) have formed. Addition of IWP-2 to the PKA-2 activated cultures resulted in partial rescue of tubulogenesis (Figure 9A, C). Tubules were observed extending from the peripheries of the characteristic epithelial cell clusters formed in spinal cord-induced MM under sustaned PKA activation.
Figure 9. Inhibition of Wnts rescues tubulogenesis in PKA-2 activated cultures.

Spinal cord-induced MM tubulogenesis is abolished when PKA-2 is activated (6-MBC-cAMP and Sp-5,6-DCl-cBIMPS). Activation of PKA-2 plus inhibition of Wnt (IWP-2) signaling rescues tubulogenesis at the edges of the epithelial clusters. (A) ZO-1 staining (red) highlights disorganized epithelium in the PKA-2 activated condition. (B) PKA-2 activated disruption of tubulogenesis is partially rescued by the addition of a Wnt inhibitor (IWP-2). ZO-1(red) is localized along the lumen of the tubule, apical from the nuclei (blue). B and C: Scale bars are 20μm. (D) Cartoon demonstrating the effect of PKA activity on Wnt expression and signaling. Diminishing PKA and Wnt activity results in normal tubulogenesis while sustained PKA activity leads to sustained Wnt signaling and disruption of tubule formation.
Regulation of renal tubule morphogenesis converges on a network of genes including PKA, Wnts, and extracellular matrix
The defect observed upon treatment of mesenchyme cultures with PKA agonists is reminiscent of two previously reported genetic lesions. Deletion of FGF8 and LHX1 from the metanephric mesenchyme results in a failure of the epithelial renal vesicle to advance morphologically to the S-shaped body. Both of these mutants have been analyzed by microarray (Perantoni et al. 2005; Potter et al. 2007). Additionally, the Wnt4 null mutant does not produce nephrons after MM induction, again resulting in a cessation of nephrogenesis in an early stage but after induction by the UB. Figure 10A diagrams relationships between the mutant phenotypes and the current results. To try to identify a common mechanism, the primary microarray data from the Lim1 and Wnt 4 reports, as well as the available published data for the FGF8 null mutant, were re-analyzed in light of the current microarray analysis. This resulted in a network of genes centered on known markers or renal tubule development, and highlighting the importance of Wnt, PKA and the extracellular matrix (ECM) molecule hyaluronan in renal tubule development. There was consistent misregulation of PKA; Wnt signaling and hyaluronic acid production in the null mutants, reminiscent of the changes seen in the PKA-treated samples. The combined mutant/PKA microarray analyses were abstracted into a hand drawn network to specifically highlight the observation that an increase in PKA activity resulted in increased Wnt expression and canonical signaling, along with misregulation of ECM production (Figure 10B).
Figure 10. Network of genes misregulated in lesions which affect early nephron morphogenesis.

(A) A diagrammatic description of the developmental defect in nephrogenesis caused by genetic deletions or by treatment of cultured nephrons with signaling pathway modulators. (B–E) A group of core nephrogenesis genes, validated by extensive literature is augmented by molecules found to be differentially expressed in nephron precursors that fail to undergo tubular morphogenesis (Wnt4 null, B; FGF8 null, C; Lim1 (Lhx1) null, D) and in PKA-2 agonist treated spinal cord-induced MM (E). The new nodes link Wnt, PKA and hyaluronic acid, all of which affect nephron formation in vitro/ex vivo, to the existing network. Arrowheads indicate increased expression in vivo, opposite of the direction observed in the expression profile of the mutant, bars indicate reduced expression.
Discussion
To date it has been difficult to define the genes and pathways regulating specific intermediate steps in kidney tubulogenesis. Here, the wealth of existing in vivo and in vitro information, including considerable previously published microarray data and new data generated in this study, was leveraged to identify genetic and cellular signaling networks that could be key in understanding intermediate stages of nephron formation from the metanephric mesenchyme.
Computational, morphological, biochemical and functional approaches identify four stages of tubulogenesis and nephron formation
The four stages (un-induced MM, induced non-epithelial MM, early tubules, and differentiating tubules) generally correspond to more traditionally defined morphological separations, supported by multiple types of analysis. Thus, they were identifiable by microarray and by examination of morphological and molecular markers. For instance, PNA staining of 5 day-induced tissue showed clear differentiation of the cultured MM (Figure 1D). Electron micrographs (Figure 6C) demonstrated tubule formation with a lumen comprised of a single layer of epithelial cells. These stages provide a backdrop against which comparisons can be made while interpreting the results of perturbation experiments, as was done to analyze PKA pathway regulation of the transition from induced MM to an epithelial tubule during nephron formation.
Data from independent microarray studies (Spinal cord and LIF-induced MM) was combined after primary analysis to avoid the pitfalls of examining large scale data from different sources, as well as the problems associated with comparisons across platforms. The data sets were analyzed for regulated genes in isolation, but the resultant gene lists were pooled to enhance later pathways analysis.
The combined data temporal network stage modeling strategy, although not without assumptions, allows the results of each in vitro tubulogenesis experiment to fill in gaps from the others. The nephron induction methods and microarray platforms are different, and as a result, the total number and representation of temporally dynamic genes is different. The addition of the LIF-induced genes to those from the spinal cord-induced MM experiment added nodes to the networks which enhanced the ability of informatics software to identify highly represented pathways.
A screen of signaling pathway modulators identified pathways that regulate tubulogenesis during nephron formation
The screen of signaling pathway modulators was based on the observation of temporally regulated kinases from significance testing, or by the implication of signaling pathways in the regulation of differentially expressed genes in pathways analysis. Perturbation of some of these signaling pathways in the spinal cord-induced MM tubulogenesis model yielded lesions during most of the stages of nephron formation. It seems remarkable that perturbation of certain pathways already known to regulate key signaling events in a wide variety of cultured and other cell types had no stage-specific effects on nephron formation--PKA regulation being the notable exception of a stage-specific lesion in the middle of tubulogenesis.
While nearly half of the pathways tested had an observable effect on tubular morphogenesis in culture, it is also very interesting that, at the level of phase contrast microscopy used as the initial readout for the screen, many known to regulate essential cellular processes had little or no effect, including AKT, JNK, and PI3K signaling pathways (Table 1). Taken together, the data support the view that the system is quite robust – which may explain why so few intermediate phenotypes have been found in knockout studies - although significant stage-specific regulatory signaling does appear to exist. The results of this data, combined with detailed analysis of the individual results could significantly enhance the interpretation of the molecular signaling networks involved in MM morphogenesis and nephron formation.
PKA regulates conversion of the renal vesicle to the S-shaped body
Using a set of specific agents to stimulate and inhibit various limbs of its signaling pathway, PKA signaling was repeatedly implicated in the regulation of an intermediate stage in tubulogenesis during nephron formation. Addition of the PKA agonist dibutyryl-cAMP, or a combination of cAMP analogues specific to the type II regulatory subunit of PKA (e.g. 6-MBC-cAMP and Sp-5,6-DCl-cBIMPS), provide one of the most dramatic and stage-specific lesions produced by the screen (Figures 2 and 3). The cultures in which PKA was misregulated proceed through epithelialization and form renal vesicles, but generally fail to form tubules.
PKA activation is also known to block epithelial cell tubulogenesis induced by growth factors in 3-dimensional culture (Santos et al. 1993). In the MM-spinal cord co-culture, large sheets of cells, outlined with the tight junction protein ZO-1 could be identified at the end of the culture period. Epithelialization with intercellular junction formation occurred, but the formation of tubules was blocked. Thus, the lesion created by PKA dysregulation appears quite specific: MET and full epithelialization occurs. Treatment of cultures with a pan-A Kinase Anchoring Protein inhibitor did not prevent tubulogenesis, but it did increase the time taken to achieve the tubular organization found in controls (Figure 4). This result suggests that not only is PKA signaling critical, but it also must be tightly controlled spatially and temporally for normal nephron morphogenesis to occur.
Interestingly, PKA signaling has been implicated in ciliary function, and in instances where ciliary function is impaired, tubular dilation occurs. PKA activation inhibits tubulogenesis and promotes cyst formation in cultured cells (Santos, 1993). Polycystic kidney disease models, in which there is tubular dilation, have been experimentally treated by reducing cAMP (Torres 2004). In our studies, although there were few if any tubules, there were epithelial dilations in late activated PKA cultures (Figure 6C, D). Nevertheless, we did not detect a ciliary lesion by immunofluorescent staining. Moreover, genes known to be involved in ciliogenesis and planar cell polarity were also examined in the microarray data, and found not to meet the criteria of two-fold change between activated PKA and control samples (data not shown).
The stage of tubulogenesis regulated by PKA is due to PKA dependent Wnt signaling
Wnt signaling is involved in several aspects of renal tubule development and maintenance (Stark et al. 1994; Karner et al. 2009; Lancaster et al. 2009). It is interesting to note that the MM specific genetic ablation of Lim1 causes failure of morphogenesis at the renal vesicle stage (Potter et al. 2007). In that report microarray analysis of renal vesicles from wild-type and MM-deficient Lim1 mutant animals revealed that DKK1 was down-regulated in the mutant renal vesicle. Similarly, FGF8 null mutant kidneys make only renal vesicles, which do not express Lim1 (Perantoni et al. 2005). Down regulation of Dickkopf proteins potentially leads to sustained Wnt signaling concomitant with failure of morphogenesis. There was, interestingly, also a significant down regulation of Crem (14 fold) in the Lim1 knockout, presumably reflecting misregulated PKA signaling. Our new microarray data specifically links PKA activity to Wnt gene expression and disruption of tubulogenesis. The hyaluronic acid (HA) gene Has2 increased expression in the activated PKA cultures as well as in the Lim1 null. Expression of Has2 has been shown to be regulated by PKA signaling (Yokoyama et al. 2006). Expression of the HA receptor CD44 is modulated by Egr1, which is downregulated in the FGF8 mutant metanephric mesenchyme (Fitzgerald and O’Neill 1999; Perantoni et al. 2005).
Analysis of in vivo signature genes revealed a block at the renal vesicle to nascent tubule stage with expected reduced expression of “classic” marker genes, such as Cited1, Brn1, FGF8 and podocalyxin. Recently, a number of genes regulated by Wnt signaling in LIF-induced MM were identified (Schmidt-Ott et al. 2007a), after a transition which we have subsequently shown to also be regulated by PKA (Table 2).
Sustained PKA and canonical Wnt activity prevented tubule formation in the spinal cord-induced MM tubulogenesis assay. PKA-induced Wnt activity was observed in the microarray analysis and subsequently confirmed genetically by canonical Wnt-responsive indicator expression in cultured MM isolated from BAT-gal mice (Figures 7 and 8). This finding in the microarray data suggests that the link between PKA and Wnt signaling goes beyond an inactivation of GSK3β by PKA, and that PKA signaling in early nephrogenesis is involved in the expression of Wnts. The increased canonical Wnt signaling may prevent tubulogenesis by instituting a program of transcription resulting in epithelial-to-mesenchymal transition as seen in cancers (Vincan and Barker 2008).
Reduction of canonical Wnt signaling is necessary for formation of patterned epithelial tubules from an aggregate of epithelium (Kuure et al. 2007; Park et al. 2007). Non-canonical Wnt expression is associated with planar cell polarity and convergent extension, which controls renal tubule elongation, indicating a shift away from canonical Wnt signaling during tubule morphogenesis.
PKA-2 activity during renal tubule development led to an increase in Wnt expression and canonical signaling and was not permissive of tubulogenesis. Furthermore, inhibition of PKA-induced Wnt synthesis rescued tubulogenesis (Figure 9). This result points towards close links between PKA and Wnt signaling in regulation of epithelial cell organization required for tubule formation. The PKA, Wnt axis is likely part of a larger network of interactions required at the onset of tubular morphogenesis, including regulation of signaling interactions from the ECM through HA, which has morphogenetic capacity and is repeatedly implicated in microarray analysis of mutations with lesions at the same morphologic stage of nephron development in the current microarray analysis (Figure 10) and in whole kidney cultures (Rosines et al. 2007b).
To summarize, utilization of multiple types of bioinformatic and genetic analyses on diverse data sets has yielded a novel framework for understanding nephron formation from the MM, including epithelialization and tubulogenesis. The integration of multiple in vitro/ex vivo and in vivo data sets into a single analysis allowed the utilization of the strengths of each set, while minimizing the weaknesses. The resulting temporal networks predicted the importance of PKA regulation during renal tubulogenesis, which was confirmed as part of a network-derived pathway screen. Further directed microarray experimentation yielded molecules related to Wnt signaling which was confirmed to be misregulated in the presence of PKA agonists, resulting in a failure of tubule morphogenesis or HA, which accelerates tubule development. This strategy provides a model for analyzing development and regulation of complex processes in mammalian organs where different in vitro/ex vivo models, biochemical, genetic, and functional assays as well as in vivo and in vitro/ex vivo microarray data sets are leveraged to study a particular question. Finally, taken together the data indicate a complex PKA-dependent, Wnt-regulated network involved in the formation of nascent tubular structures from MM-derived epithelial cells.
Materials and Methods
MM culture
Metanephric mesenchymes were dissected from kidneys of e13 rat embryos, and the MM and UB were separated as described previously (Stuart et al. 2003). Five mesenchymes per culture were set up adjacent to a section of spinal cord from the same embryos on transwell filters (Costar, Corning, NY, USA). Growth media consisting of 400μl of DME/F-12 medium containing 0.5% antibiotics and 10% fetal calf serum was added to each well. Cultures were incubated at 37°C with 100% humidity and 5% CO2 for up to seven days. LIF-induced cultures (1 set of experiments 5 mm/condition) were prepared and cultured as described previously (Barasch et al. 1999). Signaling pathway modulators used were: Calphostin C (5μM); MEK inhibitor II (100μM); db-cAMP, (200μM); Y-27632, (5μM); SB203580 (50μM); Cyclosporin A (5μg/ml); Staurosporine (50nM); KT5823 (2μM); AKT IV (5μM); JNK II (10μM); LY294002 (5μM); Forskolin (10μM), PKAi 14–22 (10μM) from Calbiochem (EMD, San Diego, CA, USA), St-Ht3 (50μM, Promega, Madison, WI, USA) and cAMP analogues for PKA-1 (8-HA-cAMP and 8-Pip-cAMP), PKA-2 (Sp-5,6-DCl-cBIMPS and 6MBC-cAMP), and Epac (8-CPT-2′′-O-Me-cAMP) at 100μM each (Axxora, San Diego, CA, USA). IWP-2 was used at 10μM (Sigma, Saint Louis, MO, USA). The use of animals in this study conformed to the procedures approved by the Animal Subjects Program of the University of California, San Diego.
Immunofluorescence
Cultures were fixed overnight in 4% paraformaldehyde, quenched using 0.1M glycine and 0.05% tween-20 in PBS, and blocked in PBS with 0.05% triton X-100 solution containing 2% BSA before the addition of primary antibodies to ZO-1 whole hybridoma R40.76 supernatant (courtesy of Dan Goodenough), E-cadherin 1:1000 (Invitrogen), or Pax2 1:1000 (Zymed). PNA stained samples were incubated in neuraminidase buffer (150mM NaCl, 50mM NaAcetate, pH 5.5 in TBST) before addition of the lectin with secondary antibodies (Alexafluor 488 and 595, Invitrogen). After washing in TBS containing 0.05% Triton X-100, samples were mounted on slides and analyzed by confocal microscopy on a Nikon D-Eclipse C1 or Olympus FV1000 microscope. Volumetric analysis was performed using Volocity (Perkin Elmer).
Western blotting and detergent extraction
Cultures were solubilized in LDS sample buffer (Invitrogen, Carlsbad, CA, USA) with DTT and a protease inhibitor cocktail (Sigma, St. Louis, MO, USA). Lysates were run on precast gels (Invitrogen, Carlsbad, CA, USA) and transferred to nitrocellulose membranes. Membranes were blocked with blotto (2% milk, 1% Triton X-100, 0.05M Tris HCl, 0.01M EDTA) before addition of primary antibodies. Extraction was performed as described before (Tsukamoto and Nigam 1997). Cultures were submerged in buffer csk-1(0.5% Triton X-100, 100 mm NaCl, 10 mm Tris-HCl, pH 7.4, 300 mm sucrose) and rocked at 4°C for 30 minutes, followed by centrifugation at 15,000X for 15 minutes. The supernatant was TCA precipitated, and both fractions were suspended in LPS sample buffer (Invitrogen).
Microarray analysis
For new data, cultures were frozen in RNAlater (Qiagen, Valencia, CA, USA) prior to RNA preparation. Total RNA was isolated with the RNAqueous-Micro RNA isolation kit (Ambion, Austin, TX, USA). Microarray processing was performed on Rat Genome 230.2 gene chips (Affymetrix, Santa Clara, CA, USA). The CEL image files were RMA normalized using Genespring GX (Agilent). Significance testing was performed using Genespring GX and EDGE (University of Washington, Seattle, WA, USA)(Leek et al. 2006). Spinal Cord and LIF induced MM time series data sets were analyzed using Genespring GX ANOVA was performed to identify differentially expressed genes using a FDR of 0.05. The two data sets were also analyzed in EDGE using the “between class” analysis pipeline and a Q-value of 0.1. The EDGE and Genespring GX generated lists of significant genes for each data set were combined into a single list of significant genes, and the union of genes from SC and LIF models were defined using Genespring GX. Gene lists were combined by using Entrez gene ID as the identifier. Gene ontology filtering was done in Genespring GX. The pathways tested in the initial screen were identified using this method. In vivo “signature gene” lists were taken from a previous report (Brunskill et. al. 2008 Figure 3), where gene list A represents genes specific to the MM, B to the CM, C to the RV, D to the SS and RC, and E to the PT. Transcription factor binding site analysis was performed using the ToppFun function of the ToppGene online software suite (toppgene.cchmc.org). The hand drawn network (Figure 9) was made from current microarray data and from previously published studies on the Wnt4, FGF8, and Lim1 null mutants (Perantoni et al. 2005; Potter et al. 2007; Valerius and McMahon 2008) and noting the commonalities in the changes in gene expression. The directions of the changes in expression were reported as described in the original publications.
Electron Microscopy
Samples were immersed in modified Karnovsky’s fixative (1.5% glutaraldehyde, 3% paraformaldehyde and 5% sucrose in 0.1 M cacodylate buffer, pH 7.4) for at least 8 hours, postfixed in 1% osmium tetroxide in 0.1 M cacodylate buffer for 1 hour and stained en bloc in 1% uranyl acetate for 1 hour. Samples were dehydrated in ethanol, embedded in epoxy resin, sectioned at 60 to 70 nm, and picked up on Formvar and carbon-coated copper grids. Grids were stained with uranyl acetate and lead nitrate, viewed using a JEOL 1200EX II (JEOL, Peabody, MA, USA) transmission electron microscope and photographed using a Gatan digital camera (Gatan, Pleasanton, CA, USA).
Wnt reporter assay
BAT-gal mouse (Maretto et al. 2003) kidneys were isolated from embryos at e11.5. Spinal cord-induced cultures were set up following the same protocol as was used in the wild type rat MM cultures described above.
Supplementary Material
Highlights.
PKA activity prohibits tubulogenesis during nephrogenesis.
Inhibition from PKA is due to signaling from Wnts.
A network of tubulogenesis genes was built with profiles of similar null mutants.
Acknowledgments
This work was supported by NIH DK1724 (to MGF) and by NIH 5RO1DK057286-10 and 5R01DK079784-04 (to SKN). Confocal microscopy and image analysis was performed using equipment funded under the UCSD Neuroscience Microscopy Shared Facility grant P30 NS047101.
Footnotes
Publisher's Disclaimer: This is a PDF file of an unedited manuscript that has been accepted for publication. As a service to our customers we are providing this early version of the manuscript. The manuscript will undergo copyediting, typesetting, and review of the resulting proof before it is published in its final citable form. Please note that during the production process errors may be discovered which could affect the content, and all legal disclaimers that apply to the journal pertain.
References
- Barasch J, Yang J, Ware CB, Taga T, Yoshida K, Erdjument-Bromage H, Tempst P, Parravicini E, Malach S, Aranoff T, Oliver JA. Mesenchymal to epithelial conversion in rat metanephros is induced by LIF. Cell. 1999;99(4):377–86. doi: 10.1016/s0092-8674(00)81524-x. [DOI] [PubMed] [Google Scholar]
- Brunskill EW, Aronow BJ, Georgas K, Rumballe B, Valerius MT, Aronow J, Kaimal V, Jegga AG, Yu J, Grimmond S, McMahon AP, Patterson LT, Little MH, Potter SS. Atlas of gene expression in the developing kidney at microanatomic resolution. Dev Cell. 2008;15(5):781–91. doi: 10.1016/j.devcel.2008.09.007. [DOI] [PMC free article] [PubMed] [Google Scholar]
- Challen G, Gardiner B, Caruana G, Kostoulias X, Martinez G, Crowe M, Taylor DF, Bertram J, Little M, Grimmond SM. Temporal and spatial transcriptional programs in murine kidney development. Physiol Genomics. 2005;23(2):159–71. doi: 10.1152/physiolgenomics.00043.2005. [DOI] [PubMed] [Google Scholar]
- Cheng HT, Kim M, Valerius MT, Surendran K, Schuster-Gossler K, Gossler A, McMahon AP, Kopan R. Notch2, but not Notch1, is required for proximal fate acquisition in the mammalian nephron. Development. 2007;134(4):801–11. doi: 10.1242/dev.02773. [DOI] [PMC free article] [PubMed] [Google Scholar]
- Davies JA, Garrod DR. Induction of early stages of kidney tubule differentiation by lithium ions. Dev Biol. 1995;167(1):50–60. doi: 10.1006/dbio.1995.1006. [DOI] [PubMed] [Google Scholar]
- Fitzgerald KA, O’Neill LA. Characterization of CD44 induction by IL-1: a critical role for Egr-1. J Immunol. 1999;162(8):4920–7. [PubMed] [Google Scholar]
- Glass DB, Cheng HC, Mende-Mueller L, Reed J, Walsh DA. Primary structural determinants essential for potent inhibition of cAMP-dependent protein kinase by inhibitory peptides corresponding to the active portion of the heat-stable inhibitor protein. J Biol Chem. 1989;264(15):8802–10. [PubMed] [Google Scholar]
- Grobstein C. Inductive epitheliomesenchymal interaction in cultured organ rudiments of the mouse. Science. 1953;118(3054):52–5. doi: 10.1126/science.118.3054.52. [DOI] [PubMed] [Google Scholar]
- Grobstein C. Trans-filter induction of tubules in mouse metanephrogenic mesenchyme. Exp Cell Res. 1956;10(2):424–40. doi: 10.1016/0014-4827(56)90016-7. [DOI] [PubMed] [Google Scholar]
- Holthofer H, Virtanen I. Glycosylation of developing human glomeruli: lectin binding sites during cell induction and maturation. J Histochem Cytochem. 1987;35(1):33–7. doi: 10.1177/35.1.3794308. [DOI] [PubMed] [Google Scholar]
- Horster MF, Braun GS, Huber SM. Embryonic renal epithelia: induction, nephrogenesis, and cell differentiation. Physiol Rev. 1999;79(4):1157–91. doi: 10.1152/physrev.1999.79.4.1157. [DOI] [PubMed] [Google Scholar]
- Karner CM, Chirumamilla R, Aoki S, Igarashi P, Wallingford JB, Carroll TJ. Wnt9b signaling regulates planar cell polarity and kidney tubule morphogenesis. Nat Genet. 2009;41(7):793–9. doi: 10.1038/ng.400. [DOI] [PMC free article] [PubMed] [Google Scholar]
- Koseki C. Cell death programmed in uninduced metanephric mesenchymal cells. Pediatr Nephrol. 1993;7(5):609–11. doi: 10.1007/BF00852566. [DOI] [PubMed] [Google Scholar]
- Koseki C, Herzlinger D, al-Awqati Q. Apoptosis in metanephric development. J Cell Biol. 1992;119(5):1327–33. doi: 10.1083/jcb.119.5.1327. [DOI] [PMC free article] [PubMed] [Google Scholar]
- Kuure S, Popsueva A, Jakobson M, Sainio K, Sariola H. Glycogen synthase kinase-3 inactivation and stabilization of beta-catenin induce nephron differentiation in isolated mouse and rat kidney mesenchymes. J Am Soc Nephrol. 2007;18(4):1130–9. doi: 10.1681/ASN.2006111206. [DOI] [PubMed] [Google Scholar]
- Lancaster MA, Louie CM, Silhavy JL, Sintasath L, Decambre M, Nigam SK, Willert K, Gleeson JG. Impaired Wnt-beta-catenin signaling disrupts adult renal homeostasis and leads to cystic kidney ciliopathy. Nat Med. 2009;15(9):1046–54. doi: 10.1038/nm.2010. [DOI] [PMC free article] [PubMed] [Google Scholar]
- Lantinga-van Leeuwen IS, Dauwerse JG, Baelde HJ, Leonhard WN, van de Wal A, Ward CJ, Verbeek S, Deruiter MC, Breuning MH, de Heer E, Peters DJ. Lowering of Pkd1 expression is sufficient to cause polycystic kidney disease. Hum Mol Genet. 2004;13(24):3069–77. doi: 10.1093/hmg/ddh336. [DOI] [PubMed] [Google Scholar]
- Leek JT, Monsen E, Dabney AR, Storey JD. EDGE: extraction and analysis of differential gene expression. Bioinformatics. 2006;22(4):507–8. doi: 10.1093/bioinformatics/btk005. [DOI] [PubMed] [Google Scholar]
- Mah SP, Saueressig H, Goulding M, Kintner C, Dressler GR. Kidney development in cadherin- 6 mutants: delayed mesenchyme-to-epithelial conversion and loss of nephrons. Dev Biol. 2000;223(1):38–53. doi: 10.1006/dbio.2000.9738. [DOI] [PubMed] [Google Scholar]
- Maretto S, Cordenonsi M, Dupont S, Braghetta P, Broccoli V, Hassan AB, Volpin D, Bressan GM, Piccolo S. Mapping Wnt/beta-catenin signaling during mouse development and in colorectal tumors. Proc Natl Acad Sci U S A. 2003;100(6):3299–304. doi: 10.1073/pnas.0434590100. [DOI] [PMC free article] [PubMed] [Google Scholar]
- McMahon AP, Aronow BJ, Davidson DR, Davies JA, Gaido KW, Grimmond S, Lessard JL, Little MH, Potter SS, Wilder EL, Zhang P. GUDMAP: the genitourinary developmental molecular anatomy project. J Am Soc Nephrol. 2008;19(4):667–71. doi: 10.1681/ASN.2007101078. [DOI] [PubMed] [Google Scholar]
- Nakai S, Sugitani Y, Sato H, Ito S, Miura Y, Ogawa M, Nishi M, Jishage K, Minowa O, Noda T. Crucial roles of Brn1 in distal tubule formation and function in mouse kidney. Development. 2003;130(19):4751–9. doi: 10.1242/dev.00666. [DOI] [PubMed] [Google Scholar]
- Oxburgh L, Robertson EJ. Dynamic regulation of Smad expression during mesenchyme to epithelium transition in the metanephric kidney. Mech Dev. 2002;112(1–2):207–11. doi: 10.1016/s0925-4773(01)00648-7. [DOI] [PubMed] [Google Scholar]
- Park JS, Valerius MT, McMahon AP. Wnt/beta-catenin signaling regulates nephron induction during mouse kidney development. Development. 2007;134(13):2533–9. doi: 10.1242/dev.006155. [DOI] [PubMed] [Google Scholar]
- Perantoni AO, Timofeeva O, Naillat F, Richman C, Pajni-Underwood S, Wilson C, Vainio S, Dove LF, Lewandoski M. Inactivation of FGF8 in early mesoderm reveals an essential role in kidney development. Development. 2005;132(17):3859–71. doi: 10.1242/dev.01945. [DOI] [PubMed] [Google Scholar]
- Plisov SY, Yoshino K, Dove LF, Higinbotham KG, Rubin JS, Perantoni AO. TGF beta 2, LIF and FGF2 cooperate to induce nephrogenesis. Development. 2001;128(7):1045–57. doi: 10.1242/dev.128.7.1045. [DOI] [PubMed] [Google Scholar]
- Pontoglio M, Barra J, Hadchouel M, Doyen A, Kress C, Bach JP, Babinet C, Yaniv M. Hepatocyte nuclear factor 1 inactivation results in hepatic dysfunction, phenylketonuria, and renal Fanconi syndrome. Cell. 1996;84(4):575–85. doi: 10.1016/s0092-8674(00)81033-8. [DOI] [PubMed] [Google Scholar]
- Potter SS, Hartman HA, Kwan KM, Behringer RR, Patterson LT. Laser capture-microarray analysis of Lim1 mutant kidney development. Genesis. 2007;45(7):432–9. doi: 10.1002/dvg.20309. [DOI] [PubMed] [Google Scholar]
- Qiao J, Sakurai H, Nigam SK. Branching morphogenesis independent of mesenchymalepithelial contact in the developing kidney. Proc Natl Acad Sci U S A. 1999;96(13):7330–5. doi: 10.1073/pnas.96.13.7330. [DOI] [PMC free article] [PubMed] [Google Scholar]
- Reggiani L, Raciti D, Airik R, Kispert A, Brandli AW. The prepattern transcription factor Irx3 directs nephron segment identity. Genes Dev. 2007;21(18):2358–70. doi: 10.1101/gad.450707. [DOI] [PMC free article] [PubMed] [Google Scholar]
- Rosines E, Sampogna RV, Johkura K, Vaughn DA, Choi Y, Sakurai H, Shah MM, Nigam SK. Staged in vitro reconstitution and implantation of engineered rat kidney tissue. Proc Natl Acad Sci U S A. 2007a;104(52):20938–43. doi: 10.1073/pnas.0710428105. [DOI] [PMC free article] [PubMed] [Google Scholar]
- Rosines E, Schmidt HJ, Nigam SK. The effect of hyaluronic acid size and concentration on branching morphogenesis and tubule differentiation in developing kidney culture systems: potential applications to engineering of renal tissues. Biomaterials. 2007b;28(32):4806–17. doi: 10.1016/j.biomaterials.2007.07.034. [DOI] [PMC free article] [PubMed] [Google Scholar]
- Santos OF, Moura LA, Rosen EM, Nigam SK. Modulation of HGF-induced tubulogenesis and branching by multiple phosphorylation mechanisms. Dev Biol. 1993;159(2):535–48. doi: 10.1006/dbio.1993.1262. [DOI] [PubMed] [Google Scholar]
- Saxen L. Organogenesis of the kidney. Cambridge University Press; New York: 1987. [Google Scholar]
- Schmidt-Ott KM, Lan D, Hirsh BJ, Barasch J. Dissecting stages of mesenchymal-to-epithelial conversion during kidney development. Nephron Physiol. 2006;104(1):p56–60. doi: 10.1159/000093287. [DOI] [PubMed] [Google Scholar]
- Schmidt-Ott KM, Masckauchan TN, Chen X, Hirsh BJ, Sarkar A, Yang J, Paragas N, Wallace VA, Dufort D, Pavlidis P, Jagla B, Kitajewski J, Barasch J. beta-catenin/TCF/Lef controls a differentiation-associated transcriptional program in renal epithelial progenitors. Development. 2007a;134(17):3177–90. doi: 10.1242/dev.006544. [DOI] [PubMed] [Google Scholar]
- Schmidt-Ott KM, Masckauchan TN, Chen X, Hirsh BJ, Sarkar A, Yang J, Paragas N, Wallace VA, Dufort D, Pavlidis P, Jagla B, Kitajewski J, Barasch J. {beta}-catenin/TCF/Lef controls a differentiation-associated transcriptional program in renal epithelial progenitors. Development. 2007b;134(17):3177–90. doi: 10.1242/dev.006544. [DOI] [PubMed] [Google Scholar]
- Schwede F, Maronde E, Genieser H, Jastorff B. Cyclic nucleotide analogs as biochemical tools and prospective drugs. Pharmacol Ther. 2000;87(2–3):199–226. doi: 10.1016/s0163-7258(00)00051-6. [DOI] [PubMed] [Google Scholar]
- Shah MM, Tee JB, Meyer T, Meyer-Schwesinger C, Choi Y, Sweeney DE, Gallegos TF, Johkura K, Rosines E, Kouznetsova V, Rose DW, Bush KT, Sakurai H, Nigam SK. The instructive role of metanephric mesenchyme in ureteric bud patterning, sculpting, and maturation and its potential ability to buffer ureteric bud branching defects. Am J Physiol Renal Physiol. 2009;297(5):F1330–41. doi: 10.1152/ajprenal.00125.2009. [DOI] [PMC free article] [PubMed] [Google Scholar]
- Shawlot W, Behringer RR. Requirement for Lim1 in head-organizer function. Nature. 1995;374(6521):425–30. doi: 10.1038/374425a0. [DOI] [PubMed] [Google Scholar]
- Stark K, Vainio S, Vassileva G, McMahon AP. Epithelial transformation of metanephric mesenchyme in the developing kidney regulated by Wnt-4. Nature. 1994;372(6507):679–83. doi: 10.1038/372679a0. [DOI] [PubMed] [Google Scholar]
- Stuart RO, Bush KT, Nigam SK. Changes in global gene expression patterns during development and maturation of the rat kidney. Proc Natl Acad Sci U S A. 2001;98(10):5649–54. doi: 10.1073/pnas.091110798. [DOI] [PMC free article] [PubMed] [Google Scholar]
- Stuart RO, Bush KT, Nigam SK. Changes in gene expression patterns in the ureteric bud and metanephric mesenchyme in models of kidney development. Kidney Int. 2003;64(6):1997–2008. doi: 10.1046/j.1523-1755.2003.00383.x. [DOI] [PubMed] [Google Scholar]
- Thiery JP, Acloque H, Huang RY, Nieto MA. Epithelial-mesenchymal transitions in development and disease. Cell. 2009;139(5):871–90. doi: 10.1016/j.cell.2009.11.007. [DOI] [PubMed] [Google Scholar]
- Torres VE. Therapies to slow polycystic kidney disease. Nephron Exp Nephrol. 2004;98(1):e1–7. doi: 10.1159/000079926. [DOI] [PubMed] [Google Scholar]
- Tsigelny IF, Kouznetsova VL, Sweeney DE, Wu W, Bush KT, Nigam SK. Analysis of metagene portraits reveals distinct transitions during kidney organogenesis. Sci Signal. 2008;1(49):ra16. doi: 10.1126/scisignal.1163630. [DOI] [PMC free article] [PubMed] [Google Scholar]
- Tsukamoto T, Nigam SK. Tight junction proteins form large complexes and associate with the cytoskeleton in an ATP depletion model for reversible junction assembly. J Biol Chem. 1997;272(26):16133–9. doi: 10.1074/jbc.272.26.16133. [DOI] [PubMed] [Google Scholar]
- Valerius MT, McMahon AP. Transcriptional profiling of Wnt4 mutant mouse kidneys identifies genes expressed during nephron formation. Gene Expr Patterns. 2008;8(5):297–306. doi: 10.1016/j.gep.2008.02.001. [DOI] [PMC free article] [PubMed] [Google Scholar]
- Vincan E, Barker N. The upstream components of the Wnt signalling pathway in the dynamic EMT and MET associated with colorectal cancer progression. Clin Exp Metastasis. 2008;25(6):657–63. doi: 10.1007/s10585-008-9156-4. [DOI] [PubMed] [Google Scholar]
- Yokoyama U, Minamisawa S, Quan H, Ghatak S, Akaike T, Segi-Nishida E, Iwasaki S, Iwamoto M, Misra S, Tamura K, Hori H, Yokota S, Toole BP, Sugimoto Y, Ishikawa Y. Chronic activation of the prostaglandin receptor EP4 promotes hyaluronan-mediated neointimal formation in the ductus arteriosus. J Clin Invest. 2006;116(11):3026–34. doi: 10.1172/JCI28639. [DOI] [PMC free article] [PubMed] [Google Scholar]
Associated Data
This section collects any data citations, data availability statements, or supplementary materials included in this article.