Abstract
The clinical phenotype of Sanfilippo Syndrome is caused by one of four enzyme deficiencies that are associated with a defect in mucopolysaccharide metabolism. The four subtypes (A, B, C, and D) are each caused by an enzyme deficiency involved in the degradation of heparan sulfate. We have developed a highly efficient synthesis of the substrates and internal standards required for the enzymatic assay of each of the four enzymes. The synthesis of the substrates involves chemical modification of a common intermediate. The substrates and internal standards allow the measurement of the enzymes relevant to heparan N-sulfatase (type A); N-acetyl-α-glucosaminidase (type B); acetyl-CoA:α-glucosamide N-acetyltransferase (type C); N-acetylglucosamine 6-sulfatase (type D). The internal standards are similar to the substrates and allow for the accurate quantitation of the enzyme assays using tandem mass spectrometry. The synthetic substrates incorporate a coumarin moiety and can also be used in fluorometric enzyme assays. We confirm that all four substrates can detect the appropriate Sanfilippo syndrome in fibroblast lysates, and the measured enzyme activities are distinctly lower by a factor of 10 when compared to fibroblast lysates from unaffected persons.
INTRODUCTION
Mucopolysaccharidosis III types A, B, C, and D (Sanfilippo syndrome, MPS III type A, B, C and D) are a group or autosomal recessive lysosomal storage disorders (LSD) caused by a deficiency of any of four distinct enzymes which degrade the glycosaminoglycan (GAG) heparan sulfate. The enzymes are located in lysosomes and, when deficient, are unable to degrade heparan sulfate. This allows the accumulation of heparan in cells leading to somatic changes and intellectual deficits.1 Each MPS III is caused by a deficiency of a specific enzyme: heparan N-sulfatase (sulfamidase, EC 3.10.1.1), α-N-acetyl-glucosaminidase (EC 3.2.1.50), acetyl-CoA:α-glucosaminide acetyltransferase (EC 2.3.1.78) and N-acetylglucosamine 6-sulfatase (EC 3.1.6.14) for types A, B, C and D respectively.2 Although the enzyme deficiencies are biochemically distinct, the clinical phenotype is similar. MPS III is characterized by slowly progressive degeneration of the central nervous system, whereas somatic changes are mild and often diagnostically non-specific. Diagnosis of MPS III is often delayed beyond four years of age due to mild somatic effects and unreliable tests for urinary GAGs.1
The most reliable methods of detection of the MPS III forms rely on specific enzyme assays. Radiolabel,3–7 spectrophotometric,8,9 and fluorescence-based assays10–14 have been developed to monitor MPS III enzyme activities; substrates for fluorescence-based assays are available commercially from Moscerdam (http://moscerdam.com). These assays for MPS IIIA, C, and D do not form fluorescent products and require addition of a coupling hydrolytic enzyme to generate the fluorescent 4-methylumbelliferone product.
We have developed tandem mass spectrometric assays15 for the detection of several LSD caused by deficiencies of enzymes in glycosaminoglycan degradation pathways. These included assays for α-L-iduronidase (MPS I),16 iduronate-2-sulfatase (MPS II),17 N-acetylgalactosamine-6-sulfate sulfatase (MPS IV),18 and N-acetylgalactosamine-4-sulfate sulfatase (MPS VI).19,20 The assays require incubation with a synthetic substrate and a 2- or 3-mm punch of a dried blood spot from a newborn report card, followed by a single-step extraction,21 or HPLC work-up,22 and quantitation of the enzyme product by tandem mass spectrometry. This approach is dictated by the need for early detection of those inborn errors for which there exists efficient treatment. MPS III is different in that there is currently no marketed treatment. However, a treatment for MPS IIIA is in development,23 and thus, it is useful to explore the possibility of early detection of this LSD using an enzyme assay.
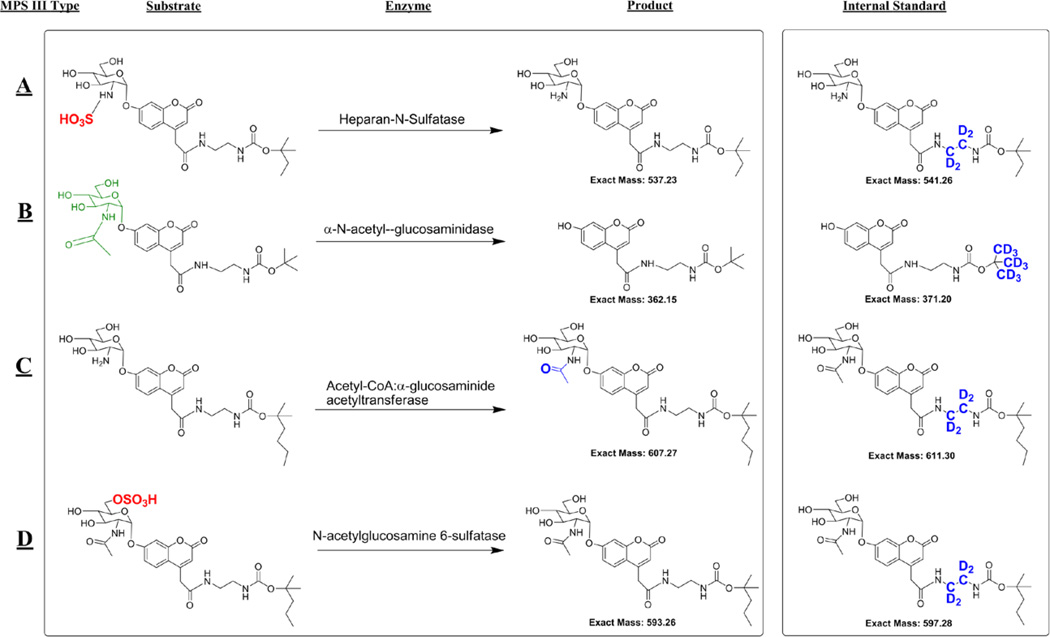
We previously developed a set of assays to measure enzyme activities in cultured fibroblasts for MPS III patients by using affinity capture-release purification of biotin-tagged products and internal standards followed by electrospray MS.24,25 Although this assay set was robust and straightforward, the synthesis of biotinylated substrate-conjugates was tedious and unsuitable for scaled-up production. In addition, sample dilution upon affinity capture-release made the affinity-based method unsuitable to be extended to dried blood spots. Because of the superior selectivity and sensitivity of tandem mass spectrometry, the affinity chromatography step can now be avoided and the assays performed with simpler substrates. Here we report the development of a highly efficient synthesis of a simplified set of substrates, which are prepared from a common intermediate. We also prepared a set of internal standards that allow for the quantitation of MPS III enzyme activities by tandem MS. The chemical structures of the new compounds are shown in Figure 1. Also reported are new fragmentation mass tags for the detection of MPS III enzyme products and internal standards which are completely orthogonal by ion masses within this group of enzymes, and also across the entire portfolio of 15 tandem mass spectrometric LSD assays developed by our lab.
Figure 1.
The substrates, enzymatic products, and internal standards used to diagnose MPS III types A–D.
EXPERIMENTAL PROCEDURES
Materials
All chemicals were reagent grade and were used as received. (1,1,2,2-d4)-Ethylenediamine and tert-butyl-d9-alcohol were purchased from CDN Isotopes. Acetyl-CoA and synthetic chemicals were purchased from Sigma Aldrich. Cell culture media and buffer solutions were purchased from Invitrogen. T-25 and T75 flasks were purchased from Corning Inc. All experiments with human cell lines were conducted in compliance with Institutional Review Board guidelines. All MPS-III affected patients had been diagnosed previously with established clinical and biochemical procedures. Patient fibroblast cells were obtained from the Coriell Institute for Medical Research and were grown using their standard protocols (http://ccr.coriell.org/Sections/Support/Global/Fibroblast.aspx?PgId=214). The specific cell lines used were catalog number GM00312 (Type A), GM02931 (Type B), GM05157 (Type C) and GM05093 (Type D). Details of the syntheses of the substrates and internal standards are provided in the Supporting Information.
Standard Assay Procedure
Cells were harvested from T75 flasks by quickly removing the fibroblast growth medium, then incubating the cells in 8–9 mL 0.53 mM ethylenediaminetetraacetic acid (EDTA) in Hank’s balanced salt solution (HBSS) for a couple of minutes. The cells were monitored under the microscope, and as soon as the cells began to constrict or round at the edges the EDTA solution were removed. Next 4–5 mL of 0.05% trypsin EDTA solution was added. The cells were monitored under the microscope for a few minutes until the cells were detached. If necessary the flask was tapped to help to dislodge the cells. When the cells were almost all dislodged, 5–7 mL of media was added, and the suspension was mixed a few times by gentle aspiration using the pipettor to give a uniform suspension. The solution was then placed in a 15 mL falcon tube and centrifuged at 100g for 10 minutes to give a pellet. The solution was then removed without disturbing the pellet. The pellet was gently washed quickly with 2×100 µL of deionized water with care taken not to disturb the pellet. The cells were then diluted in less than 100 µL of deionized water and the sample was sonicated on ice using a microtip probe for 3 one second bursts until the sample became homogenous. The protein concentration was then measured using the standard Bradford assay26 and the samples were stored at −80 °C until they were analyzed.
For the MPS III Type B and C assays, 10 µL of 100 mM sodium citrate buffer, pH 4.5, containing 0.75 mM MPS III type B and C substrates was combined with in a 1.5 mL Eppendorf tube with 5 µL of 9.6 mM acetyl-CoA solution in the same buffer solution. The cell lysate containing 30 µg of fibroblast protein was added followed by water to give the solution a total volume of 30 µL. The final composition of the solution is 50 mM citrate buffer pH 4.5 with 0.25 mM substrate, 1.6 mM acetyl-CoA and 30 µg of protein. Stock solutions of substrates were prepared in methanol and stored at −20 °C. An appropriate volume of each substrate was transferred to Eppendorf tube, methanol was removed in a vacuum centrifuge (Speed-Vac), and assay buffer was added to prepare the assay cocktail. We have not yet evaluated the long term stability of the substrates in the assay cocktail.
The MPS III type A and D assays were carried out in a separate Eppendorf tube with 10 µL 100 mM sodium acetate buffer pH 5.5 which contained 75 mM lead (II) acetate and 2.5 mM of each substrate. To each assay 60 µg of fibroblast protein was added followed by deionized water to give a total volume of 20 µL. The final composition is 50 mM acetate buffer pH 5.5 with 37.5 mM lead (II) acetate, 1.25 mM substrate and 60 µg of protein. MPS III type A and D substrates were stored as stock solutions and assay cocktail prepared as for the other substrates. Stock solutions of acetyl-CoA were prepared in assay buffer and stored at −20 °C.
All assays were allowed to incubate for 16 hours at 37 °C in a thermostated air shaker at 225 rpm. The assays were then quenched with 0.5 mL of water containing 1 nmol of the internal standards. Internal standard stock solutions were made in methanol (stored at −20 *C), and these were directly added to the assay mixture (typically 10 µL).
To the MPS III type A and D assay was added a suspension of DEAE in water (150 µL, containing ~100 µL of settled beads). The samples were mixed on a vortexer for ~1–2 seconds to ensure uniform mixing. The addition of DEAE removed the unreacted sulfated substrate from the samples in order to prevent non-enzymatic dissociation of the sulfate group in electrospray and ion transport which can cause a high background. The Eppendorf tube was then centrifuged and the top 0.5 mL was removed and submitted to C-18 solid phase extraction using a vacuum manifold (Millipore Inc, MAVM0960R) system connected to an aspirator.
The next step was to pass the sample through a reverse-phase solid phase cartridge to remove buffer salts. C-18 resin (Aldrich, Octadecyl-functionalized silica gel #377635) slurry in methanol (100 µL containing ~70 µL of resin) was pipetted into a 1 mL pipettor tip plugged with cotton. The top region of the tip was sprayed with methanol using a squirt bottle to push remaining solid-phase particles to the bottom of the tip. The column was washed with ~0.5 mL water with suction to remove residual methanol. The 0.5 mL assay samples were loaded on to the solid-phase bed, and suction was applied to draw the sample into the bed over 20–30 sec. The products and internal standards were eluted into a 1.5 mL Eppendorf tube by adding 100 µL of 80/20 acetonitrile/water with 0.2% formic acid and applying suction over ~10 sec. Ten µL of the elution solvent was then injected into the mass spectrometer for analysis. If desired, it is possible to store these samples at −20 °C for several days prior to mass spectrometry.
Mass Spectrometry
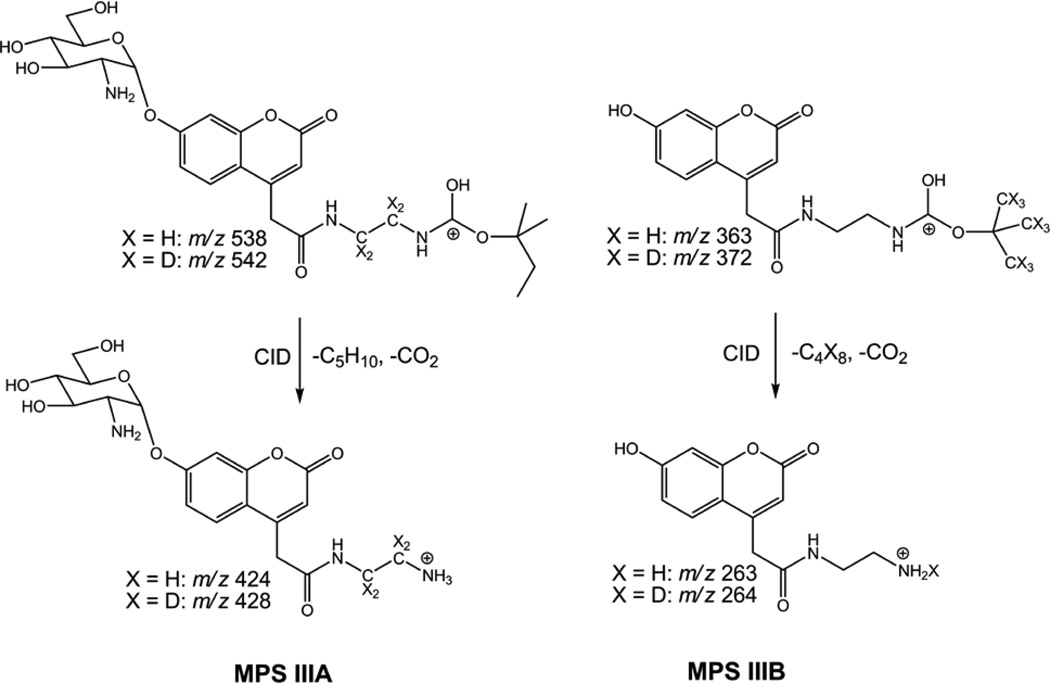
Mass spectrometry was performed on a Waters Quattro Micro tandem quadrupole instrument using positive ion mode selected reaction monitoring (SRM) and sample flow injection at 0.1 mL/min in 80/20 acetonitrile/water with 0.2% formic acid and electrospray ionization. Using manual injection, a 10 µL aliquot of the 100 µL sample volume was injected for each analysis. Collision induced ion dissociations occurred in the t-alkoxycarbamoyl groups that were designed to give mutually exclusive ion m/z ratios to allow multiplexing not only within the group of MPS III enzymes, but also across the entire portfolio of LSD assays. The ion structures relevant for the MPS IIIA and MPS IIIB dissociations are shown in Scheme 1; those for the MPS IIIC and MPS IIID ion dissociations involve ions which have t-alkoxycarbamoyl groups homologous to that in MPS IIIA. The relevant mass transitions used for SRM analysis of the MPS III type A assay were m/z 538.2→ m/z 424.5 and m/z 542.2 → m/z 428.5 for MPS III-A-P and MPS III-A-IS, respectively, using a cone voltage of 25 V and a collision energy of 15 eV. The mass transitions used for SRM analysis of the MPS III type B assay were m/z 363.1→m/z 263.5 and m/z 372.1 → m/z 264.4 for MPSIII-B-P and MPSIII-B-IS, respectively, with a cone voltage of 25 V and a collision energy of 10 eV. The mass transitions used for SRM analysis of the MPS III type C assay were m/z 630.2→ m/z 488.5 and m/z 634.2 → m/z 492.5 for MPS III-C-P and MPS III-C-IS, respectively, with a cone voltage of 35 V and a collision energy of 30 eV. The mass transitions used for SRM analysis of the MPS III type D assay were m/z 616.3→ m/z 488.5 and m/z 620.3 → m/z 492.5 for MPS III-D-P and MPS III-D-IS, respectively, with a cone voltage of 45 V and a collision energy of 30 eV.
Scheme 1.
Mass spectrometric fragmentations of product and internal standard ions for MPS IIIA and MPS IIIB assays.
The product concentration was then determined from the SRM ion intensity ratio of the product to internal standard, the known internal standard concentration, and the products/internal standard response ratio (R), which was obtained by calibration over a 0.0–2.0 range of molar ratios, The calibration curves to determine the relative response factors for products to internal standards are given in Figures S1–S4 (Supporting Information). The enzyme activity was calculated as nmol/(h mg protein) from the amount of product formed, the incubation time, and the amount of protein added to the assay. Other mass spectrometry settings were as follows: Capillary voltage: 3.75 kV, extractor: 1 V, RF Lens: 0 V, source temperature: 80 °C, desolvation temperature: 350 °C, cone gas flow: 50 L/Hr, desolvation gas flow: 650 L/Hr, LM 1 resolution: 15, HM resolution: 15, ion energy 1: 0.2 eV, entrance: 15 V, exit: 15 V, LM 2 resolution: 15, HM 2 resolution: 15, ion energy 2: 2.0 eV, multiplier: 650 V, gas cell Pirani pressure: 2.23 10−3 mbar, dwell time 100 ms with 20 ms delay.
RESULTS AND DISCUSSION
Substrate, Product, and Internal Standard Synthesis
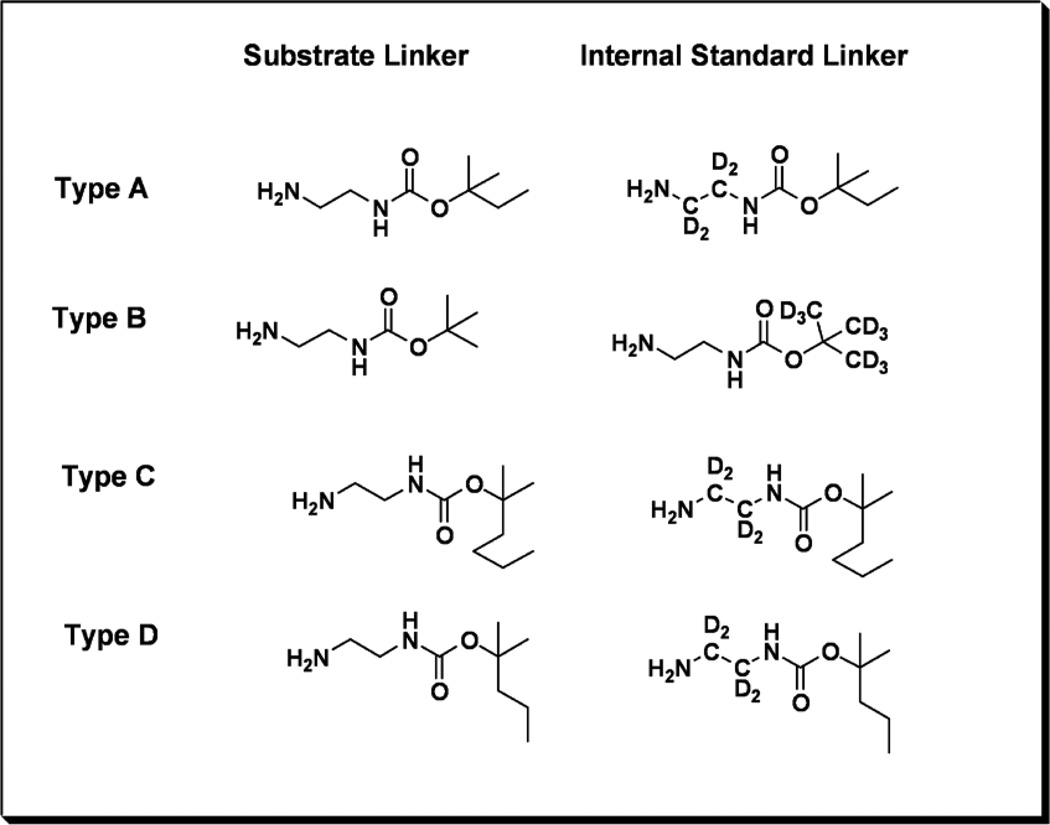
The substrates all have an umbelliferyl-α-glucosamine scaffold, which is unmodified (type B), modified by N-sulfation (type A), modified by N-acetylation (type C), or the N-acetylated glucosamine is 6-O sulfated (type D). Importantly, the common scaffold allows for an efficient synthetic design involving a single pivot intermediate. The umbelliferyl group bears a hydrophobic linker with a terminal carbamylated amine. The hydrophobic linker assures good retention of the products and internal standards on the reverse-phase cartridges used to remove buffer salts prior to ESI mass spectrometry. The carbamylated amines provide a site that readily undergoes collision-induced dissociation in the mass spectrometry. Fragmentation along a single pathway improves assay sensitivity. We decided to add mass variation to the alkoxy portion of the carbamate rather than using various length methylenediamine linkers. The latter would inevitably result in mass redundancies with some of the other lysosomal enzyme products and internal standards we have developed previously.15–22 By avoiding these overlaps, we anticipate being able to incorporate the MPS III assays together with assays of other LSDs in the future. We thus used a common ethylenediamine linker, which is commercially available in tetra-deuterated form, and a series of different t-alkoxycarbamido (t-AOC) groups. For the type B substrate we used a standard t-butoxygroup (t-BOC). The t-AOC groups for the type A, C and D substrates and internal standards were modified with one, three or two extra carbons respectively (Figure 1). The internal standards were deuterium labeled in the ethylenediamine linker for the type A, C and D internal standards and on the t-BOC group for the type B assay.
The t-AOC derivatives were synthesized using the appropriate alcohols and phenylchloroformate (Scheme 2) to form a carbonate (1) which was then refluxed in ethanol with ethylenediamine to give the desired compound (2). The internal standards contained either a heavy d4-ethylenediamine chain or a d9-t-BOC group (Figure 2) made from either ethylene-d4-diamine or tert-butyl-d9-alcohol, both commercially available from CDN Isotopes.
Scheme 2.
Synthesis of the linkers.
Figure 2.
The different linkers that are used for the substrates, and internal standards for each assay type.
Figure 2. The different linkers that are used for the substrates, and internal standards for each assay type.
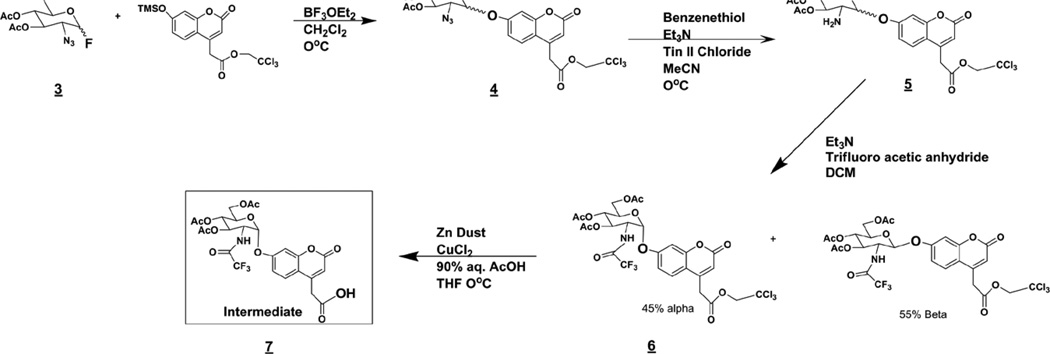
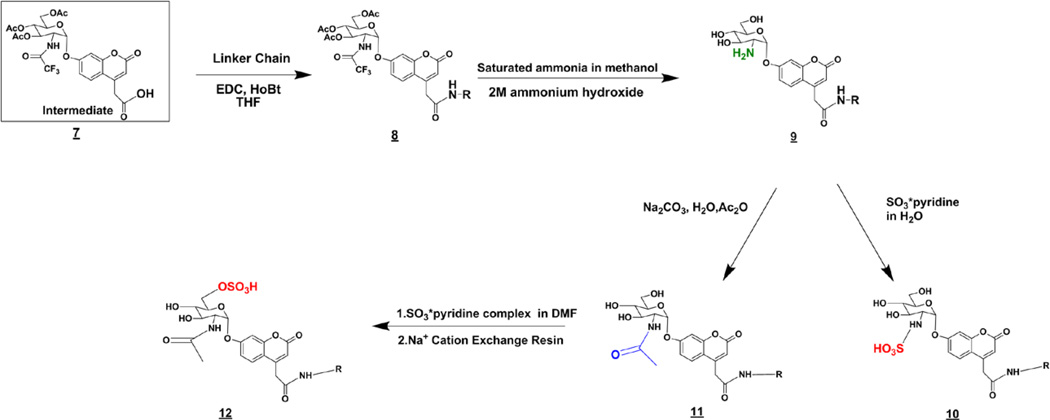
The starting compound of the carbohydrate synthesis was 2-azido-2-deoxy-d-glucopyranosyl fluoride 3,4,6-triacetate (3, Scheme 3), which was synthesized from commercially available d-glucal using previously described techniques.27,28 The coumarin aglycone was made as described previously17. Coupling of the coumarin and 3 gave a mixture of 40% α and 60% β enantiomers (4). The α-anomer is generally more difficult to obtain than the β-anomer, and we consider the 40/60 α / β ratio to be acceptable. These two anomers were not readily separated on silica gel; however, we found that they do well separate after next two synthetic steps, reduction of the azide to give amine (5) and N-trifluoroacetylation to give (6). Diastereoisomers 6α and 6β were readily separated on silica (Rf =0.4 for α and 0.3 for β in CHCl3/MeOH 3%). The trichloroethyl ester in the α-linked glycoside (6) was removed using Zn to form the free carboxyl group in the common intermediate (7) from which all substrates, enzymatic products, and internal standards could be synthesized in four steps or less. Using this intermediate the desired linker can be attached via standard 1-ethyl-3-(3-dimethylaminopropyl) carbodiimide (EDC) peptide coupling (Scheme 4) (8). The carbohydrate was then fully deprotected (9) and either N-sulfated (10), N-acetylated (11), or N-acetylated and then sulfated at O-6 (12) to give all substrates and internal standards.
Scheme 3.
Synthesis of the intermediate (7).
Scheme 4.
Synthesis of the substrates and internal standards from intermediate 7.
The type B product and internal standard (13) were made by coupling the desired diamine chain to 7-hydroxycoumarin-4-acetic acid using a standard EDC coupling procedure in dichloromethane (Scheme 5).
Scheme 5.
Synthesis of the product and internal standard for the MPS III type B assay.
Mass Spectrometric Analysis
Electrospray ionization tandem mass spectrometry of the products and internal standards showed linear responses (R2 = 0.98–0.998) over a range of product/internal standard ratios (Figures S1–S4, Supporting Information). The slopes of the calibration curves varied, giving different response factors for the A–D types. The largest difference was found for type A where the response factor was 0.42 disfavoring the product against the internal standard. The other response factors were 0.66, 0.53, and 1.6 for the B, C, and D types, respectively. Note that the internal standards are isotopologues of the enzyme products and their respective response factors are usually expected to be close to 1.0. The reasons for the observed variations were not clear. The response factors were used in the calculations of product formation in the assays.
The MPS III A, B, and D assays showed an approximately linear increase in product formation versus incubation time up to 24 h (Figure S5 and S6). The type C enzyme activity leveled off after ~6 hour of incubation time (Figure S6). Despite this time course of type C assay, all the assays were still incubated for 16 hours so that they could be processed at the same time. The amount of substrate enzymatically converted to product increased in an approximately linear fashion with increasing amounts of fibroblast protein for all assays (Figure S7 and S8).
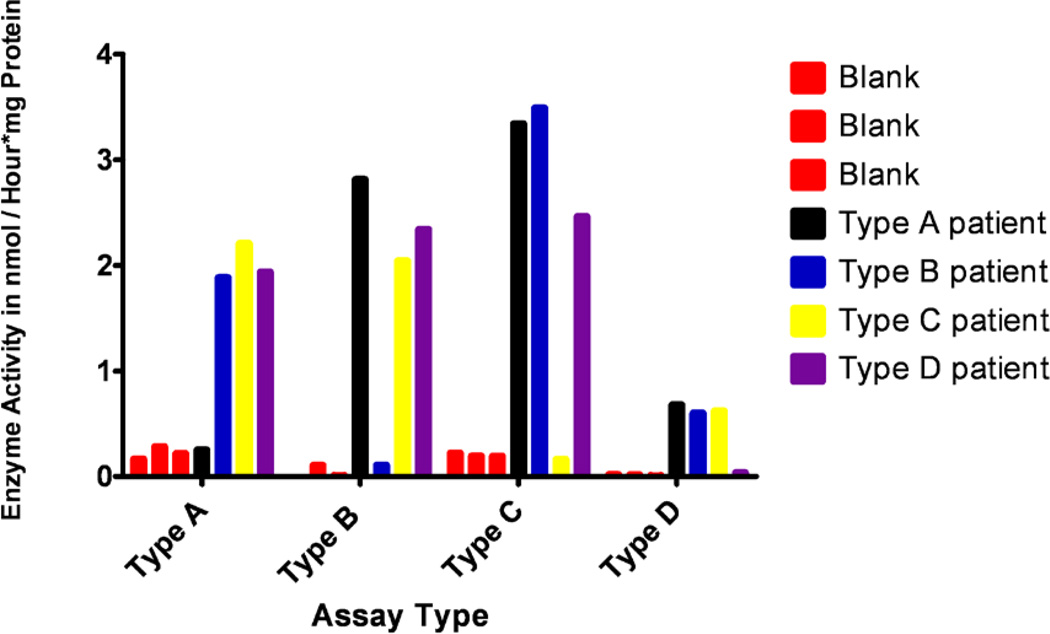
Enzyme activities were measured in cultured cells from patients who had been previously diagnosed with MPS III A–D syndromes, and the measured activities were compared among the cell lines and with blanks (Figure 3). Three blanks which contained water instead of cellular protein had heparan-N-sulfatase (type A) activities of 0.17, 0.29 and 0.22 nmol/(h mg protein). The patients type A enzyme activities were measured as 0.25, 1.9, 2.2 and 1.9 nmol/(h mg protein) for MPS III type A, B, C and D patients. The MPS III type A patient showed an enzyme activity close to the blanks while the MPS III type B–D samples had heparan-N-sulfatase activities at least 6.5 times higher than the background signal. The MPS III type B blanks showed α-N-acetyl-glucosamidase activity of 0.00, 0.11 and 0.01 nmol/(h mg protein). The patient α-N-acetyl-glucosamidase activities were 2.8, 0.11, 2.0 and 2.3 for the type A–D patients, respectively. This showed that the MPS III type B patient had a measured α-N-acetyl-glucosamidase activity close to the blanks, while the other patients activities were at least 18 times higher than background. The MPS III type C assay blanks had acetyl-CoA: α-glucosaminide acetyltransferase activities of 0.22, 0.20 and 0.19 nmol/(h mg protein). The patients had acetyl-CoA:α-glucosaminide acetyltransferase activities of 3.3, 3.5, 0.16 and 2.5 nmol/(h mg protein) for type A–D, respectively. Thus, the MPS III type C patient activity was close to the blank while the other patients’ activities were at least 11 times higher than background. Finally, the N-acetylglucosamine-6-sulfatase (MPS III type D) activities of the blanks were 0.02, 0.02 and 0.01 nmol/(h mg protein). The patients activities were 0.68, 0.60, 0.62 and 0.04 nmol/(h mg protein), with the MPS III type D patient activity being at least 15 times lower than the others. The activity data are compiled in Table 1.
Figure 3.
Enzyme activities in cultured fibroblasts from MPS III type A, B, C and D patients.
Table 1.
Enzyme activities (nmol/(h mg protein) for the MPS III type A–D patients.
| Enzyme Activitya,b |
|||||||
|---|---|---|---|---|---|---|---|
| Assay Type | Blank | Blank | Blank | Type A patient |
Type B patient |
Type C patient |
Type D patient |
| MPS IIIA | 0.17 | 0.29 | 0.22 | 0.25 | 1.9 | 2.2 | 1.9 |
| MPS IIIB | 0.00 | 0.11 | 0.01 | 2.8 | 0.11 | 2.0 | 2.3 |
| MPS IIIC | 0.22 | 0.20 | 0.19 | 3.3 | 3.5 | 0.16 | 2.5 |
| MPS IIID | 0.02 | 0.02 | 0.01 | 0.68 | 0.60 | 0.62 | 0.04 |
In units of nmol/(h mg protein).
From triplicate injections with coefficients of variation <10%.
We did not use fibroblasts from healthy individuals in the current study. The previous assays using biotinylated substrates and healthy individual fibroblasts showed normal activity ranges in fibroblasts from 0.30–0.64, 1.4–2.7, 1.5–5.4, 0.067–0.092 nmol/(h mg protein) for the MPS III type A, B, C and D assays, respectively.24,25 The results with the new substrates are comparable for the B and C types. The MPS III type A and D activities achieved with the new substrates were 3 and 10 fold higher, respectively, than those previously reported.25
CONCLUSIONS
The main purpose of this study was to develop structurally simpler MPS III types A–D substrates and internal standards that are prepared from a common, late stage synthetic intermediate that is converted to final reagents in 4 or fewer steps. The MPS III types A–D substrates are among the most structurally complex among the set of reagents needed for biochemical assay of LSD in general, and the synthetic achievement in this study should allow for production of reagents in amounts needed for expanded scope MPS III A–D assays. This would be implemented, should newborn screening of these disorders become desirable, especially for MPS IIIA since a treatment option is in clinical trials. Substrates were designed to avoid mass overlaps between these reagents and the full set of other substrates that we have developed for mass spectrometry assays of other lysosomal storage diseases.15–22 In addition, the generated products contain a labile carbamate unit that directs fragmentation in tandem mass spectrometry (to improve assay sensitivity) and a hydrophobic component that allows for buffer removal prior to mass spectrometry. We show that these substrates readily detect the enzymes in fibroblasts relevant to MPS III A–D and are specific for each enzyme since the activities are close to background in the appropriate fibroblasts from MPS III A–D patients.
As will be reported shortly, we have developed a simplified assay of 9 different enzymes relevant to 9 LSDs that makes use of only 2 blood spot punches incubated in 2 buffers (6-plex + 3-plex) and that uses rapid liquid chromatography in-line with tandem mass spectrometry. The latter allows almost all of the pre-mass spectrometry sample preparation steps to eliminated (i.e. DEAE capture, solid-phase extraction).17, 29 Work is underway in our laboratories to explore the use of these new MPS III A–D reagents for assays using dried blood spot punches, with a minimal number of assay buffers, and employing the liquid chromatography step to replace pre-mass spectrometry sample processing.
Finally, since all of the reagents reported in this study contain the umbelliferone unit, they are anticipated to also work using fluorometric procedures to assay the MPS III A–D enzymes.11–14 Thus the reagents offer the choice of two different assay platforms. However, the advantage of tandem mass spectrometry is that it allows for many LSD enzymes to be assayed using a single and rapid readout.
Supplementary Material
ACKNOWLEDGMENT
Support of this research by the NIH-National Institute of Diabetes, Digestive and Kidney Diseases (Grant R01 DK067859) is gratefully acknowledged.
Footnotes
ASSOCIATED CONTENT
Supporting Information. Detailed synthetic procedures, spectroscopic data, Schemes S1–S4, and Figures S1–S8. This material is available free of charge via the Internet at http://pubs.acs.org.
REFERENCES
- 1.Neufeld E, Muenze J. The Online Metabolic and Molecular Bases of Inherited Diseases; Chapter 136. In: Valle D, Beaudet AL, Vogelstein B, Kinzler KW, Antonarakis SE, Ballabio A, editors. Part 16: Lysosomal Disorders. 2011. pp. 1–73. [Google Scholar]
- 2.Valstar MJ, Ruijter GJG, van Diggelen OP, Poorthuis BJ, Wijburg FA. Sanfilippo syndrome: A mini-review. J. Inherit. Metabol. Dis. 2008;31:240–252. doi: 10.1007/s10545-008-0838-5. [DOI] [PubMed] [Google Scholar]
- 3.Hopwood JJ, Elliott H. The diagnosis of the Sanfilippo C syndrome, using monosaccharide and oligosaccharide substrates to assay acetyl-CoA: 2-amino-2-deoxy-α-glucoside N-acetyltransferase activity. Clin. Chim. Acta. 1981;112:67–75. doi: 10.1016/0009-8981(81)90269-2. [DOI] [PubMed] [Google Scholar]
- 4.Hopwood JJ, Elliott H. Selective depolymerization of heparin to produce radiolabeled substrates for sulfamidase, 2-acetamido-2-deoxy-α-D-glucosidase, acetyl-CoA: 2-amino-2-deoxy-α-D-glucoside N-acetyltransferase, and 2-acetamido-2-deoxy-D-glucose 6-sulfate sulfatase. Carbohydrate Res. 1981;91:165–190. doi: 10.1016/s0008-6215(00)86029-2. [DOI] [PubMed] [Google Scholar]
- 5.Hopwood JJ, Elliott H. Detection of the Sanfilippo type B syndrome using radiolabelled oligosaccharides as substrates for the estimation of α-N-acetylglucosaminidase. Clin. Chim. Acta. 1982;120:77–86. doi: 10.1016/0009-8981(82)90079-1. [DOI] [PubMed] [Google Scholar]
- 6.Reynertson R, Campbell P, Ford JD, Jacobsson I, Rodén L, Thompson JN. New oligosaccharides from heparin and heparan sulfate and their use as substrates for heparin-degrading enzymes. J. Biol. Chem. 1983;258:7449–7459. [PubMed] [Google Scholar]
- 7.Thompson JN, Rodén L, Reynertson R. Oligosaccharide substrates for heparin sulfamidase. Anal. Biochem. 1986;152:412–422. doi: 10.1016/0003-2697(86)90428-8. [DOI] [PubMed] [Google Scholar]
- 8.Nowakowski RW, Thompson JN, Taylor KB. Sanfilippo syndrome, type D: a spectrophotometric assay with prenatal diagnostic potential. Pediatr. Res. 1989;26:462–466. doi: 10.1203/00006450-198911000-00020. [DOI] [PubMed] [Google Scholar]
- 9.Thompson JN, Huffman PS, McConkie-Rosell A, Hessling J. Prenatal diagnosis of Sanfilippo syndrome type A by early amniocentesis. Biochem. Mol. Biol. Int. 1993;29:793–797. [PubMed] [Google Scholar]
- 10.Marsh J, Fensom AH. 4-Methylumbelliferyl α-N-acetylglucosaminidase activity for diagnosis of Sanfilippo B disease. Clin. Genetics. 1985;27:258–262. doi: 10.1111/j.1399-0004.1985.tb00217.x. [DOI] [PubMed] [Google Scholar]
- 11.Voznyi YV, Karpova EA, Dudukina TV, Tsvetkova IV, Boer AM, Janse HC, van Diggelen OP. A fluorometric enzyme assay for the diagnosis of Sanfilippo disease C (MPS III C) J. Inherit. Metabol. Dis. 1993;16:465–472. doi: 10.1007/BF00710299. [DOI] [PubMed] [Google Scholar]
- 12.He W, Voznyi YV, Boer AM, Kleijer WJJ, van Diggelen OP. A fluorometric enzyme assay for the diagnosis of Sanfilippo disease type D (MPS IIID) J. Inherit. Metabol. Dis. 1993;16:935–941. doi: 10.1007/BF00711508. [DOI] [PubMed] [Google Scholar]
- 13.He W, Voznyi Ya V, Huijmans JG, Geilen GC, Karpova EA, Dudukina TV, Zaremba J, Van Diggelen OP, Kleijer WJ. Prenatal diagnosis of Sanfilippo disease type C using a simple fluorometric enzyme assay. Prenat. Diagn. 1994;14:17–22. doi: 10.1002/pd.1970140104. [DOI] [PubMed] [Google Scholar]
- 14.Karpova EA, Voznyi YV, Keulemans JLM, Hoogeveen AT, Winchester B, Tsvetkova IV, van Diggelen OP. A fluorometric enzyme assay for the diagnosis of Sanfilippo disease type A (MPS IIIA) J. Inherit. Metabol. Dis. 1996;19:278–285. doi: 10.1007/BF01799255. [DOI] [PubMed] [Google Scholar]
- 15.Li Y, Scott CR, Chamoles NA, Ghavami A, Pinto BM, Tureček F, Gelb MH. Direct multiplex assay of lysosomal enzymes in dried blood spots for newborn screening. Clin. Chem. 2004;50:1785–1796. doi: 10.1373/clinchem.2004.035907. [DOI] [PMC free article] [PubMed] [Google Scholar]
- 16.Blanchard S, Sadilek M, Scott CR, Turecek F, Gelb MH. Tandem mass spectrometry for the direct assay of lysosomal enzymes in dried blood spots: application to screening newborns for mucopolysaccharidosis I (Hurler-Scheie syndrome) Clin. Chem. 2008;54:2067–2070. doi: 10.1373/clinchem.2008.115410. [DOI] [PMC free article] [PubMed] [Google Scholar]
- 17.Wolfe BJ, Blanchard S, Sadilek M, Scott CR, Turecek F, Gelb MH. Tandem mass spectrometry for the direct assay of lysosomal enzymes in dried blood spots: application to screening newborns for mucopolysaccharidosis II (Hunter syndrome) Anal. Chem. 2011;83:1152–1156. doi: 10.1021/ac102777s. [DOI] [PMC free article] [PubMed] [Google Scholar]
- 18.Khaliq T, Sadilek M, Scott CR, Turecek F, Gelb MH. Tandem mass spectrometry for the direct assay of lysosomal enzymes in dried blood spots: application to screening newborns for mucopolysaccharidosis IVA (Morquio A) Clin. Chem. 2011;57:128–131. doi: 10.1373/clinchem.2010.149880. [DOI] [PMC free article] [PubMed] [Google Scholar]
- 19.Duffey TA, Khaliq T, Scott CR, Turecek F, Gelb MH. Design and synthesis of substrates for newborn screening of Maroteaux-Lamy and Morquio A syndromes. Bioorg. Med. Chem. Lett. 2010;20:5994–5996. doi: 10.1016/j.bmcl.2010.08.080. [DOI] [PMC free article] [PubMed] [Google Scholar]
- 20.Duffey TA, Sadilek M, Scott CR, Turecek F, Gelb MH. Tandem mass spectrometry for the direct assay of lysosomal enzymes in dried blood spots: application to screening newborns for mucopolysaccharidosis VI (Maroteaux-Lamy syndrome) Anal. Chem. 2010;82:9587–9591. doi: 10.1021/ac102090v. [DOI] [PMC free article] [PubMed] [Google Scholar]
- 21.Duffey TA, Bellamy G, Elliott S, Fox AC, Glass M, Turecek F, Gelb MH, Scott CR. Triplex tandem mass spectrometry for newborn screening of Fabry, Pompe and mucopolysaccharidosis I (Hurler syndrome): results of a pilot study. Clin. Chem. 2010;56:1854–1861. doi: 10.1373/clinchem.2010.152009. [DOI] [PMC free article] [PubMed] [Google Scholar]
- 22.Spacil Z, Elliott S, Reeber SL, Gelb MH, Scott CR, Turecek F. Comparative fast liquid chromatography: application to newborn screening of Pompe, Fabry, and Hurler diseases. Anal. Chem. 2011;83:4822–4828. doi: 10.1021/ac200417u. [DOI] [PMC free article] [PubMed] [Google Scholar]
- 23.Ruijter J, Valstar MJ, Wijburg FA. Mucopolysaccharidosis type III (Sanfilippo syndrome): emerging treatment strategies. Curr. Pharm. Biotech. 2011;12:923–930. doi: 10.2174/138920111795542651. [DOI] [PubMed] [Google Scholar]
- 24.Gerber SA, Turecek F, Gelb MH. Design and synthesis of substrate and internal standard conjugates for profiling enzyme activities in the Sanfilippo syndrome by affinity chromatography/electrospray ionization mass spectrometry. Bioconj. Chem. 2001;12:603–615. doi: 10.1021/bc010007l. [DOI] [PubMed] [Google Scholar]
- 25.Gerber SA, Scott CR, Turecek F, Gelb MH. Direct profiling of multiple enzyme activities in human cell lysates by affinity chromatography/electrospray ionization mass spectrometry. Anal. Chem. 2001;73:1651–1657. doi: 10.1021/ac0100650. [DOI] [PubMed] [Google Scholar]
- 26.Bradford MM. A rapid and sensitive method for the quantitation of microgram quantities of protein utilizing the principle of protein-dye binding. Anal. Biochem. 1976;72:248–254. doi: 10.1016/0003-2697(76)90527-3. [DOI] [PubMed] [Google Scholar]
- 27.Tailler D, Jacquinet JC, Noiret AM, Beau JM. An expeditious and stereocontrolled preparation of 2-azido-2-deoxy-β-D-glucopyranose derivatives from D-glucal. J. Chem. Soc. Perkin Trans. 1992;1:3163–3164. [Google Scholar]
- 28.Dasgupta F, Masada RI. Synthesis of 7-O-(2-deoxy-2-sulfamido-α-D-glucopyranosyl)-4-methylcoumarin sodium salt: a fluorogenic substrate for sulfamidase. Carbohyd. Res. 2002;337:1055–1058. doi: 10.1016/s0008-6215(02)00088-5. [DOI] [PubMed] [Google Scholar]
- 29.Metz TF, Mechtler TP, Orsini JJ, Martin M, Shushan B, Herman JL, Ratschmann R, Item CB, Streubel B, Herkner KR, Kasper DC. Simplified newborn screening protocol for lysosomal storage disorders. Clin. Chem. 2011;57:1286–1294. doi: 10.1373/clinchem.2011.164640. [DOI] [PubMed] [Google Scholar]
Associated Data
This section collects any data citations, data availability statements, or supplementary materials included in this article.


