Abstract
The presence of nanostructured materials in the work place is bringing attention to the importance of safe practices for nanomaterial handling. We explored novel fiber containment methods to improve the handling of carbon nanotube (CNT) powders in the laboratory, while simultaneously allowing highly uniform and controlled atomic layer deposition (ALD) coatings on the nanotubes, down to less than 4 nm on some CNT materials. Moreover, the procedure yields uniform coatings on milligram quantities of nanotubes using a conventional viscous flow reactor system, circumventing the need for specialized fluidized bed or rotary ALD reactors for lab-scale studies. We explored both fiber bundles and fiber baskets as possible containment methods and conclude that the baskets are more suitable for coating studies. An extended precursor and reactant dose and soak periods allowed the gases to diffuse through the fiber containment, and the ALD coating thickness scaled linearly with the number of ALD cycles. The extended dose period produced thicker coatings compared with typical doses onto CNT controls not encased in the fibers, suggesting some effects due to the extended reactant dose. Film growth was compared on a range of single wall NTs, double wall NTs, and acid functionalized multiwall NTs and we found that ultrathin coatings were most readily controlled on the multi-walled NTs.
Introduction
In the past several years, research in carbon nanotubes (CNTs) has expanded to applications such as drug delivery, transparent conductive coatings, chemical sensors, electrodes for use in organic light-emitting diodes or lithium ion batteries, as capacitors, field effect transistors, actuators, and for use in filtration applications1–4. The incorporation of nanotubes into such devices will necessitate processing and handling of relatively large quantities of nanotubes, most likely in powder form. These nanotube powders are difficult to handle and can readily spread through the laboratory and workplace. Reports of potential hazards associated with nanotube inhalation are raising concerns,5–11 and safe handling practices must be considered. Safe handling is particularly important when nanotubes or other nano-powder samples are transported, for example, between preparation and surface modification work-zones.
For most applications, well dispersed nanotubes are desired, but their tendency to agglomerate in solution makes them difficult to handle. To create solution dispersions of nanotubes, surfactants such as sodium dodecyl sulfate (SDS) are often used. Surfactants do not covalently bond with the nanotubes, maintaining the π bonding system while allowing the nanotubes to disperse in solution. Alternative protocols for the attachment polymers and other functional groups can alter the π conjugation system and affect the properties of the nanotubes12–14.
Another method to change the surface energy of carbon nanotubes is to use vapor-phase processes to deposit a thin film coating. Atomic layer deposition (ALD) is used because it produces highly conformal coatings and is compatible with mild process conditions suitable for nanotubes. Atomic layer deposition uses a sequence of self-limiting reactions to achieve monolayer control over film thickness. The deposition of thin films alters the surface properties of the material, which can increase hydrophilicity and thus improve dispersion of carbon nanotubes in aqueous solution.
Interest in nanomaterials with modified surface composition is leading to new direct methods to uniformly coat volumes of nanotubes and other small objects (e.g. particles, powders, etc.) using vapor phase processes. Our interest, for example, is to explore ultrathin coatings on carbon nanotubes, where at its ultimate thin limit, the nanoscale coating may not significantly affect the performance of the nanotube for its particular application, but it may be able to diminish or eliminate any possible ill effects of exposure. Because nanotube powders are volatile in flowing gas, caution is required to keep nanotubes from dispersing and spreading throughout the reactor during coating. Most studies of ALD coatings on CNTs are performed using nanotubes that are anchored to a Si substrate, or nanotubes deposited on a TEM grid15,16. Farmer et al. suspended SWNTs by growing them between two electrodes which helped stabilize them in the reactor and allow direct electrical testing17. To coat gram quantities of nanotube powders and decrease CNT agglomeration, custom rotary or fluidized bed tool designs have emerged18–20, but issues related to hazard mitigation during powder loading and unloading are not often discussed.
While researcher safety is always a primary concern, few reports directly discuss practices for safe handling of nano-powders as part of the process design. New procedures describing how to safely handle and contain nanomaterials during vapor phase processing will benefit many research groups in this field. For ALD coating in particular, new procedures and methods will be most attractive if they do not require special deposition equipment designs, but instead are compatible with common commercial or self-fabricated viscous flow ALD reactors. Ideally, any containment method must not interfere substantially with the coating process. The challenge, therefore, is to identify containment methods that secure the nanotubes during transfer in lab air and during vapor phase processing in a viscous flow reactor, while not impeding or otherwise interfering with the ALD reaction sequence.
For this study, two methods were explored to secure and hold carbon nanotubes during laboratory handling and ALD Al2O3 coating. The reactor used here is a simple self-fabricated viscous flow tubular reactor, and it includes many of the design elements of commercial laboratory-scale tools. One approach we explored used bundles of cotton fibers to absorb nanotubes that were previously dispersed in solvent. A second method used a fiber “basket” (or “wrapping”) to hold the nanotubes, where the nanotubes are loaded as dry powders into a supported fibrous capsule. The fiber “bundle” and “basket” methods both permit the reactant gases to flow through and around the nanotubes, while preventing the tubes from spreading in the reactor during ALD processing. The fiber basket or bundle can hold milligram quantities of nanotubes and improve the handling and transfer of the nanomaterials from a closed glove-box, through the lab and into the ALD reactor without undesired dissemination. The fiber basket method in particular, did not significantly affect the coating process, and we were able to repeatedly and reliably form uniform coatings as thin as 4 nm. We find significant differences in the ALD film coatings and product yields obtained by the bundle and basket methods. Specifically, we show here that the fiber wrapping method has distinct advantages over the fiber bundle approach in terms of handling, yield of coated nanotubes, and quality of the coating process. Using these methods the CNTs were not agitated to prevent aggregation, as would be the case in using fluidized bed or rotary reactors.18 The effectiveness of our fiber containment methods at preventing CNT aggregation was not directly evaluated.
II. Experimental Methods
Multiwall Carbon Nanotube Preparation and Containment for ALD Coating
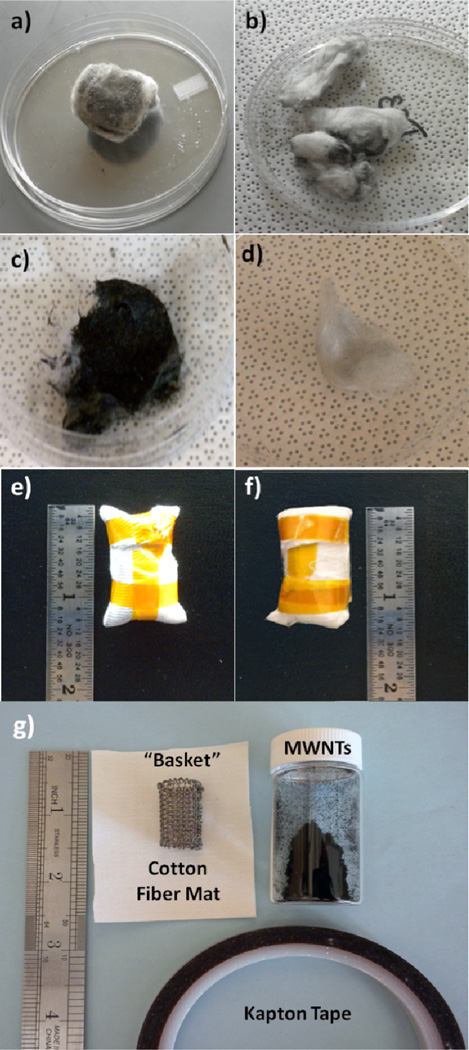
The nanotubes used for the fiber containment studies were multiwall nanotubes purchased from Helix Material Solutions. Two different approaches were explored for supporting and containing the nanotubes for deposition: i) fiber bundle; and ii) fiber basket (or fiber wrapping) carrier structures. For the “fiber bundle” approach, carbon nanotubes were suspended in a 0.5 wt % CNTs methanol solution and sonicated for ~15 minutes until uniformly dispersed by visual inspection. Using a syringe, about 6 ml of the suspension was dripped onto ~250 mg sized quartz wool bundles (Leco Corporation) or cosmetic grade cotton fiber balls. Upon loading the fiber bundles with nanotubes, the bundles visibly changed from bright white to black in the regions wetted by solution, as shown in Figure 1. After loading, the fiber bundles were allowed to dry at room temperature for more than 24 hours before being transferred into the ALD reactor.
Figure 1.
(a)–(d) Carbon nanotubes contained in fiber bundles. Image (a) shows a cotton ball loaded with CNTs prior to ALD processing. (b) After ALD coating the CNTs were rinsed from the cotton balls using methanol, but large amounts of CNTs remained. (c) Quartz wool fiber bundle after being loaded with CNTs and prior to ALD processing. (d) After coating and rinsing, fewer CNTs remained in the quartz wool compared to cotton. Images (e) and (f) show CNTs contained in cotton and polypropylene fiber baskets, respectively. Panel (g) shows the materials used to create the baskets.
For the “fiber basket” method, a screen made of metal wires with ~ 0.7 mm diameter in a 1.5 mm square grid pattern was formed into a cylindrical scaffold approximately 3 cm long and 2 cm in diameter then wrapped with either a nonwoven polypropylene (PP) fiber mat or a woven cotton fiber cloth. The nonwoven PP fiber materials were obtained from NC State College of Textiles and the cotton was obtained from Textile Innovators. They were used as received.21–25 Images of baskets fabricated and the materials required for this study are shown in Figure 1. The fiber sheet secures the nanotubes in the basket, and we will show below that the precursor and reactant gases can readily diffuse through the fibers to reach the nanotube samples. Each basket was loaded with approximately 30–50 mg of nanotubes before being enclosed using polyimide film tape. The basket was capable of holding roughly 200 mg of material, however they were not fully loaded, which may allow some nanotube movement inside the basket during processing. To avoid user exposure to nanotubes, all carbon nanotube handling, storage, and transfer to the fiber carriers was performed in a bench-top nitrogen-purged glove box (LC Technology Solutions).
Preparation of Nanotube Control Samples
In addition to the encased CNTs, some control samples were prepared directly onto TEM grids. The control samples used the MWNTs mentioned previously as well as single-walled and double-walled nanotubes (SWNTs and DWNTs respectively) purchased from Helix Material Solutions. Additionally, MWNTs refluxed in H2SO4/HNO3 to form carboxyl and hydroxyl functional groups were purchased from NanoLab Inc. (Waltham, MA). All carbon nanotube materials were used as received. To prepare the controls, approximately 10 mg of nanotubes were suspended in 20 ml of methanol and sonicated for 15 minutes. A small amount of the sonicated solution was transferred by pipette onto a holey carbon TEM grid, and the methanol was evaporated in air before loading the grid into the reactor. The grids were anchored in the reactor using an alligator clip secured to the sample boat.
Porosity of the Fiber Mats
The porosity of the fiber mats was estimated using the material density and a known sample size and weight. Specifically, the polypropylene mat is ~0.3 mm thick and weighs 4.4 ± 0.3 mg/cm2, giving an effective mat density of 150 ± 10 mg/cm3. Using the tabulated density of polypropylene (900 mg/cm3), the net porosity of the fibers is 0.17 ± 0.01 cm3/cm3. This means that the 0.3 mm thick fiber mat contains ~ 83% polymer and ~ 17% void or air space. The thickness and density of the cotton is more difficult to analyze. The mat thickness is approximately 0.5 mm with a mass of 28 ± 1 mg/cm2 giving a density of 560 ± 20 mg/cm3. Assuming the density of cotton is 1500 mg/cm3, the porosity of the fiber mat is estimated to be 0.37 ± 0.01 cm3/cm3. Furthermore, we measured the PP and cotton sample surface area using Brauner Emmett and Teller (BET) nitrogen adsorption analysis. This allows us to obtain an effective surface area enhancement to the fiber mats (i.e. net surface area per unit projected surface area). For example, the BET surface area for the polypropylene is ~1.6 m2/g (or 16 cm2/mg). A sample of polypropylene fiber mat cut into a 1 cm2 sample size weighs 4.4 mg, so therefore, there is ~70 cm2 of surface area for each cm2 of fiber mat. One typically defines the aspect ratio of a non-planar surface structure as the feature depth per unit width. The surface area enhancement ratio (i.e. ~70:1 in this case) provides a rough estimate of the effective aspect ratio. However, since the transport paths through the fibers are nonlinear, we also must consider the system tortuosity, defined in porous media as the ratio between the non-linear distance a species must travel across the matrix and the linear matrix thickness. In these fiber systems, the open fiber matrix provides many viable pathways for species transport, so we estimate the effective tortuosity to be less than or equal to ~2–3. The overall effective aspect ratio will then be the product of surface area enhancement and the tortuosity. Considering the values for surface area enhancement and tortuosity, the overall effective aspect ratio for the fiber mats is ~ 200:1. Even more conservative estimates of aspect ratio and tortuosity would still produce effective aspect ratios less than 1000:1. It is well known that ALD processes are readily capable of conformal nanocoatings on features with aspect ratio > 1000:1.26,27 Therefore, we reasonably expect that the ALD precursors will readily diffuse through the fiber mat to reach the enclosed carbon nanotubes.
ALD Film Coating
After filling and securing the fiber bundle or basket holders with CNTs in the glove box, the samples were transported by hand in air using protective laboratory gloves from the glovebox to the ALD reactor chamber. The nanotube-loaded fiber bundles or baskets were placed onto a large sample boat and transferred into the heated zone of a hot wall viscous flow ALD reactor.
Two controls were used during film deposition. As one control, carbon nanotubes on TEM grids were coated under similar conditions, but with a different recipe, to compare growth on the fiber contained samples. As a second control, small silicon wafer pieces (~1 × 2 cm2) were also coated during the ALD runs. For each run, one or more silicon wafer pieces were placed in the reactor and not otherwise encased. For the fiber basket studies, two other silicon pieces were coated with the CNTs during each run. One smaller (~0.5 × 1 cm2) silicon wafer piece was typically placed in the fiber basket with the nanotubes, and one ~1 × 2 cm2 wafer piece was wrapped in PP or cotton in another fiber basket separate from the CNT basket.
The reactants for deposition were trimethylaluminum (TMA) and water. The ALD runs were performed at 90 °C and ~ 2.0 Torr, and between ~10 and 200 ALD cycles were used for coating. To help ensure the precursor gases diffused throughout the CNT fiber samples, we used extended precursor soaks during the ALD runs. The soak steps consisted of flowing TMA for 5 seconds, then the gas inlet and outlet valves were closed to produce a static gas exposure in the reactor for 60 seconds. During the soaking period, the pressure increased from ~ 2.0 to ~ 2.2 Torr. Following the soak, the chamber was purged for 90 s using purified nitrogen gas and the pressure returned to ~2.0 Torr. The water exposure also followed the same flow and soak-time sequence, followed by another N2 purge for 120 s. This flow/soak sequence is designated as TMA/N2/H2O/N2 = 5(60)/90/5(60)/120 seconds. For CNT samples on the TEM grids, the ALD sequence used a 1 s TMA dose followed by a 30 s N2 purge. The water dose was also 1 s and the following purge was 60 s.
Characterization of Coated CNTs
After coating, the carbon nanotubes were collected and analyzed. The fiber bundles and fiber baskets were handled differently. The bundle samples were rinsed with flowing methanol into 20 ml scintillation vials, and the methanol was allowed to evaporate at room temperature. The dry powder appeared light gray, likely because of remnant material from the quartz or cotton fibers. Generally, the quartz wool resulted in more remnant material than the cotton fiber bundles, but the quartz allowed the nanotubes to be more easily rinsed out. Figure 1 shows photographs of the quartz wool and cotton fibers after loading with CNT’s, and after coating and rinsing to remove the coated nanotubes. We attempted to evaluate the effective yield of the fiber bundle containment method by weighing the fiber bundles before and after the nanotube loading, ALD coating, and CNT removal steps. However, the weight changes were too small and the variability was too large to obtain reliable results. For example, in some cases, nanotubes fell out of the fiber bundles during sample transfer and ALD treatment.
We had more success with the fiber basket method. After ALD coating, the fiber baskets were returned to the glovebox and the coated nanotubes were emptied into a scintillation vial. We found that the ALD coating produced a large increase in the mass of the CNTs, consistent with conformal film coating. We worked to estimate the yield of coated CNTs using this method (i.e. the fraction of CNTs lost or remaining in the basket after processing), but the large mass change made this difficult. Therefore, as another control experiment, the CNTs were weighed then filled into the fiber baskets as normal before transfer into the ALD reactor. The samples were exposed to reaction process conditions (i.e. N2 purge at 2 Torr for approximately 1, 5, or 10 hours), without any TMA or water exposure. The weight of the CNTs removed from basket after this process was within ~2% (weighing accuracy) of that measured before loading, demonstrating negligible loss of CNTs using the fiber basket method.
Small samples of the CNTs coated using the fiber bundle and fiber basket methods, as well as those coated directly on the control TEM grids were analyzed using an FEI Tecnai G2 Twin transmission electron microscope. The thickness of the nanotubes was estimated from the TEM images using ImageJ software. Additional TEM analysis was performed using a Hitachi HF2000 equipped with an Oxford Link INCA energy dispersive spectroscopy (EDS) system. It is important to note that many individual tubes were imaged during TEM analysis, and the results were highly self-consistent within a deposition run. Selected representative images are shown in the figures.
Raman spectra were collected for the MWNTs using a Horiba-Jobin Yvon LabRAM HR VIS confocal microscope with a 632 nm laser source. The spectrometer was calibrated using the crystalline silicon peak at 520.7 cm−1
III. Results
Fiber Bundle Method
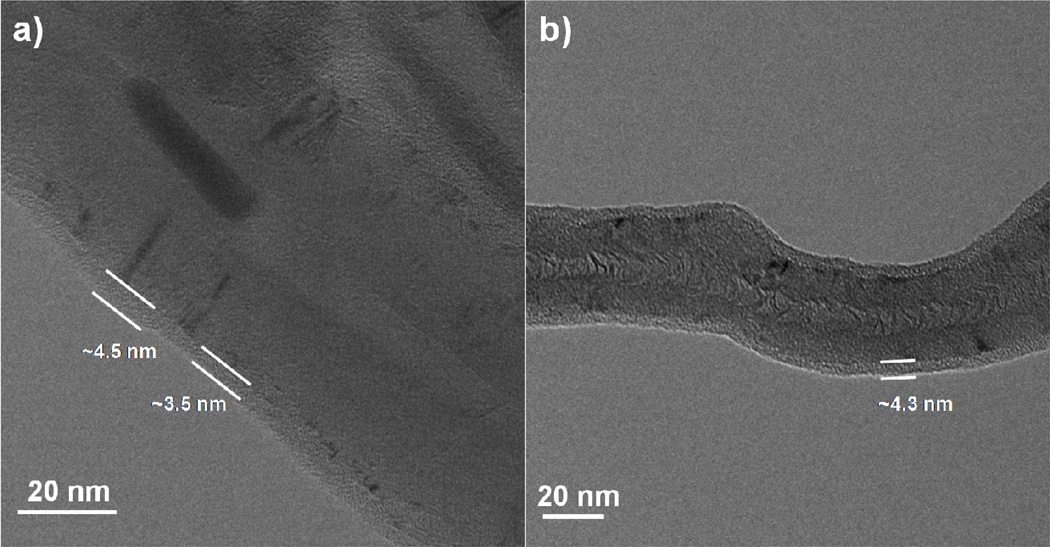
Figure 2 displays TEM images collected from ALD coated multiwall CNTs after 25 and 80 cycles, where the CNTs were supported in the reactor using cotton fiber bundles. The images show the multiwall nanotubes enclosed by a uniform and conformal coating, with a thickness of ~ 5 nm after 25 cycles. The samples coated with 80 cycles also show coatings of ~ 5 nm, suggesting problems with coating nucleation on the nanotubes and/or problems with the fiber support method. Many CNTs were observed to be entrained in the fiber bundle after coating and rinsing, especially for samples coated with more than ~ 25 ALD cycles. The coating likely helped adhere the CNTs to the fibers making them more difficult to remove. After ALD coating and rinsing with solvent, we attempted to retrieve more CNTs from the fiber bundles by calcining them at 450°C in air for 48 hours. However, an organic residue remained after calcination, impeding CNT recovery. After several attempts to modify the process details to improve the outcome, we abandoned this approach in favor of the basket method.
Figure 2.
TEM Images of MWNTs coated with a) 25 cycles of Al2O3 ALD and b) 80 cycles Al2O3 ALD at 90°C from fiber bundle method. Image a) shows a continuous but not conformal coating with the coating thickness varying from 3.5 to 4.5 nm. Image b) has a continuous and conformal coating with a thickness of only 4.3 nm, similar to the 25 cycle coating.
Fiber Basket Method
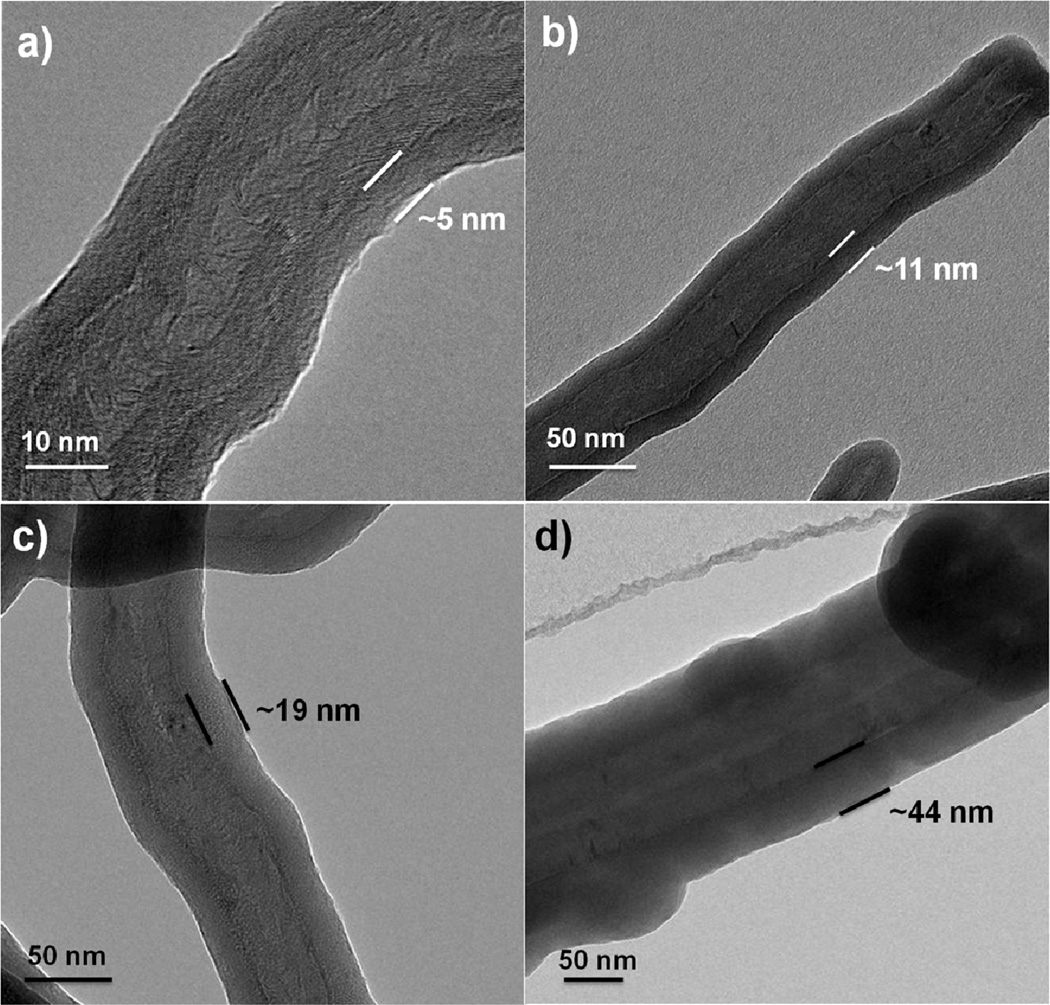
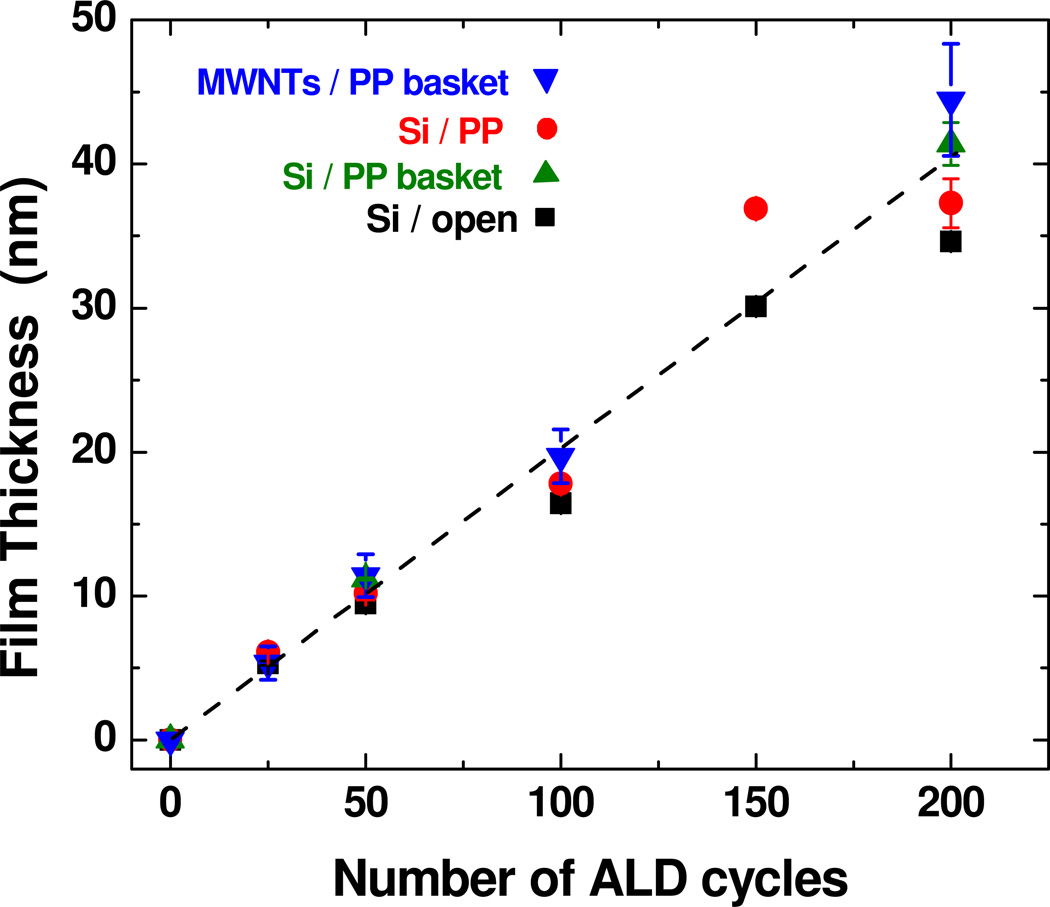
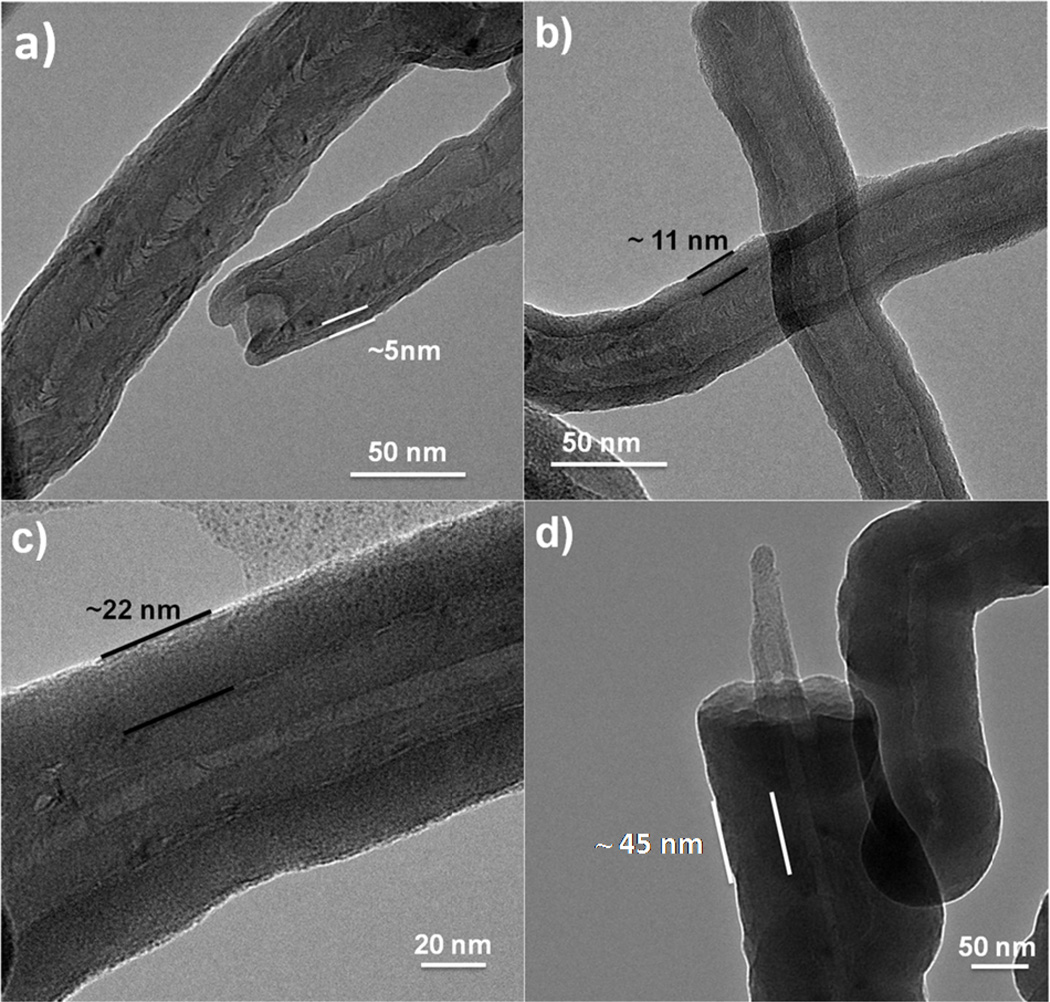
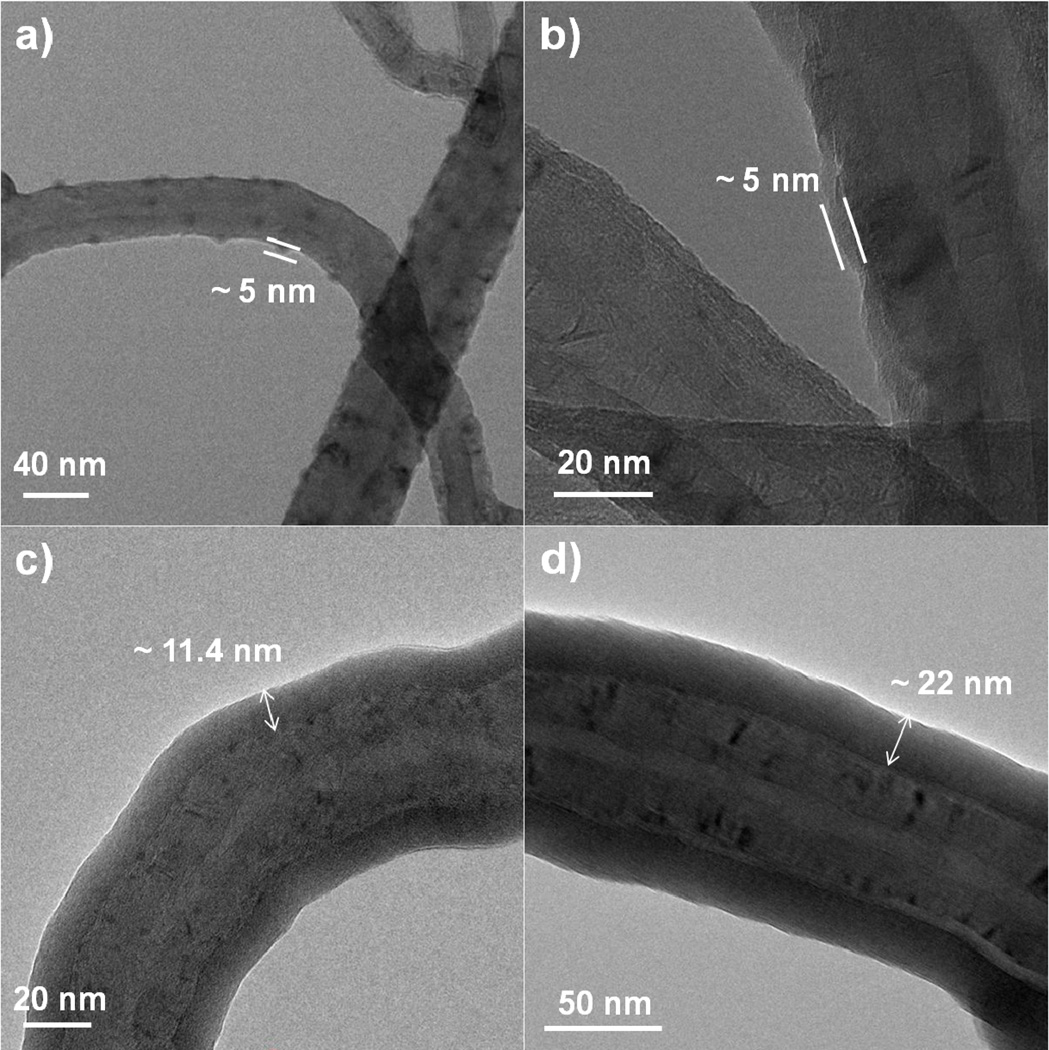
Figure 3 presents TEM images of multiwall CNTs after 25, 50, 100 and 200 ALD cycles, where the nanotubes were wrapped in the PP basket during coating. Many images were collected for each coating condition, and the tubes within a sample set showed very consistent results. From the images, all samples show smooth and conformal film coatings. The film thickness increased linearly with cycle number on all analyzed surfaces as demonstrated in Figure 4. The film thickness for the MWNTs was estimated from TEM images, and thickness on Si was determined by ellipsometry. Several different silicon samples were measured, including silicon placed in the polypropylene basket, silicon wrapped directly in PP, and silicon with no fiber wrapping. We see that each of these samples resulted in films with very similar coating thicknesses, confirming that under the conditions used, the fiber wrapping does not strongly affect the film growth. The dashed line in Figure 4 shows the deposition rate is ~ 2 Å/cycle on the CNTs and on the silicon. This rate is somewhat larger than ~1.1 Å/cycle typically observed for ALD Al2O3 at 90°C. This higher growth rate could result from the long dose times during the “soak” sequence, or from excess precursor or water remaining in the fiber mesh after the purge sequence.
Figure 3.
TEM images of MWNTs coated with a) 25; b) 50; c) 100; and d) 200 cycles of Al2O3 ALD at 90°C using the polypropylene basket method. The coatings were continuous and conformal and the film thickness increase linearly with the number of ALD cycles.
Figure 4.
Graph comparing film thickness on different Si controls and MWNTs using the PP fiber mat. Thickness was measured on silicon directly wrapped in polypropylene (“Si / PP”), in a PP basket (“Si / PP basket”), and for no fiber containment (“Si / open”). The film thickness increases with linearly with cycle number, and the growth rate is nearly the same on all silicon samples and on the CNTs.
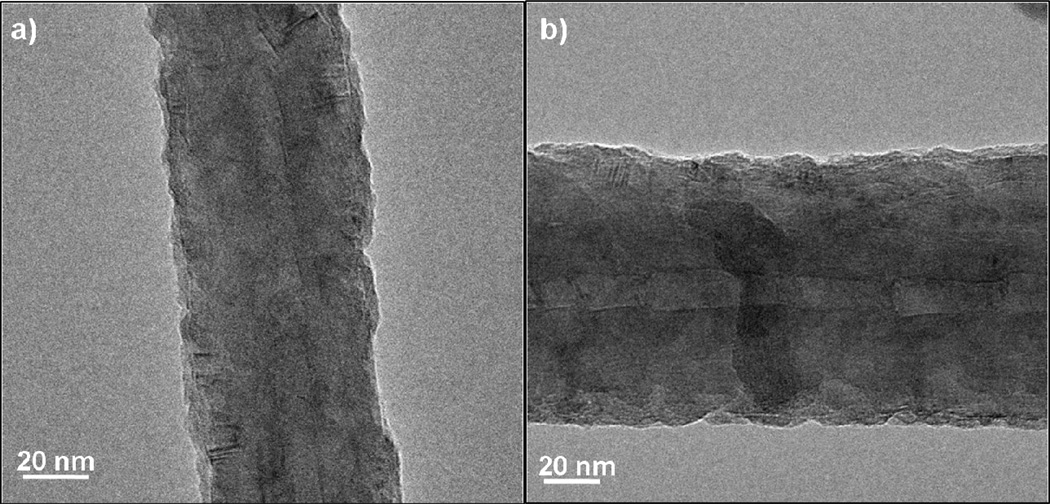
In addition to baskets wrapped in polypropylene, we evaluated common woven cotton fabric as a basket containment material. The TEM images of MWCNT’s after 25, 50, 100, and 200 ALD cycles (including the soak steps) using the cotton wrapping are shown in Figure 5. Similar to the films coated in the PP fiber baskets, the films appear to be smooth and conformal from 50 cycles up to 200 cycles. After 100–200 cycles of ALD coating, many nanotubes appeared in the TEM images with uncoated ends, as depicted in Figure 5d, consistent with breakage after coating (probably during sample transfer and handling for TEM). We observed breakage only with the thicker coatings, consistent with increases brittleness with film coating thickness.
Figure 5.
TEM images of MWNTs coated with a) 25; b) 50; c) 100; and d) 200 cycles Al2O3 ALD at 90°C using the cotton wrapped basket method. The coating thickness increased linearly with cycle number. Several uncoated or broken ends were observed as shown in panel (d). In other images (not shown), the number of visible broken ends increases as the coating thickness increases.
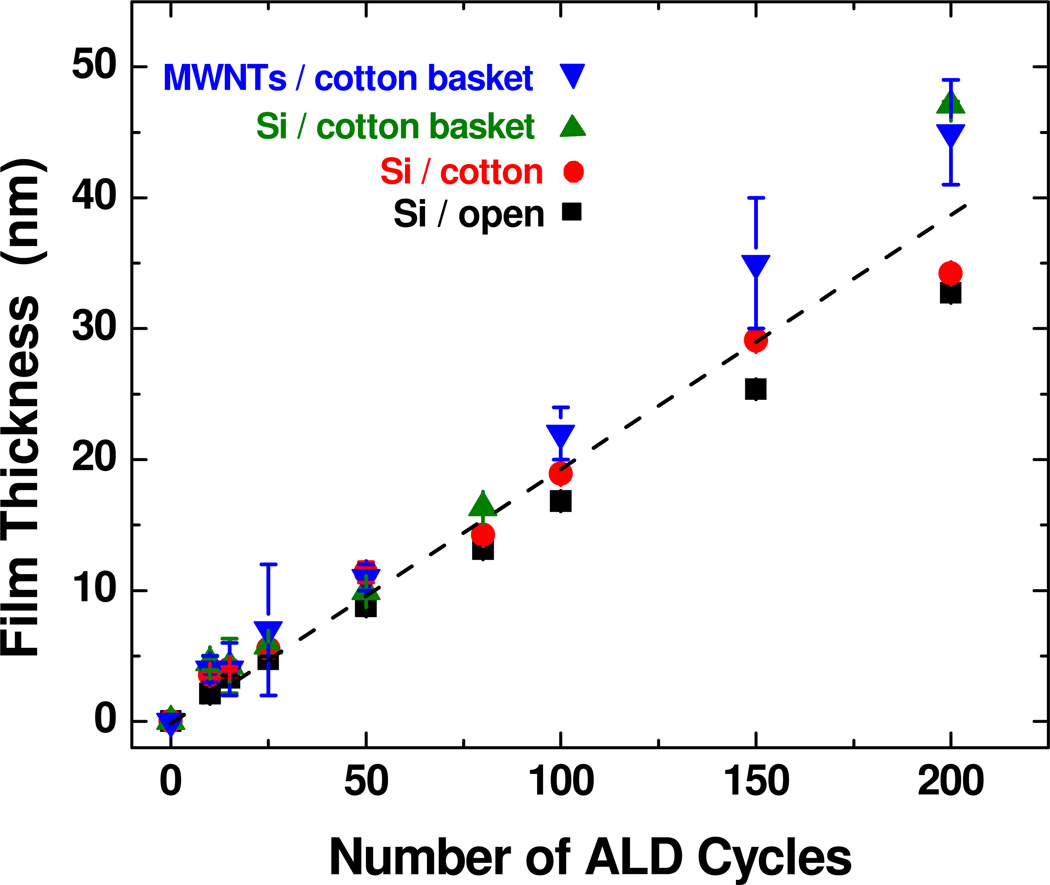
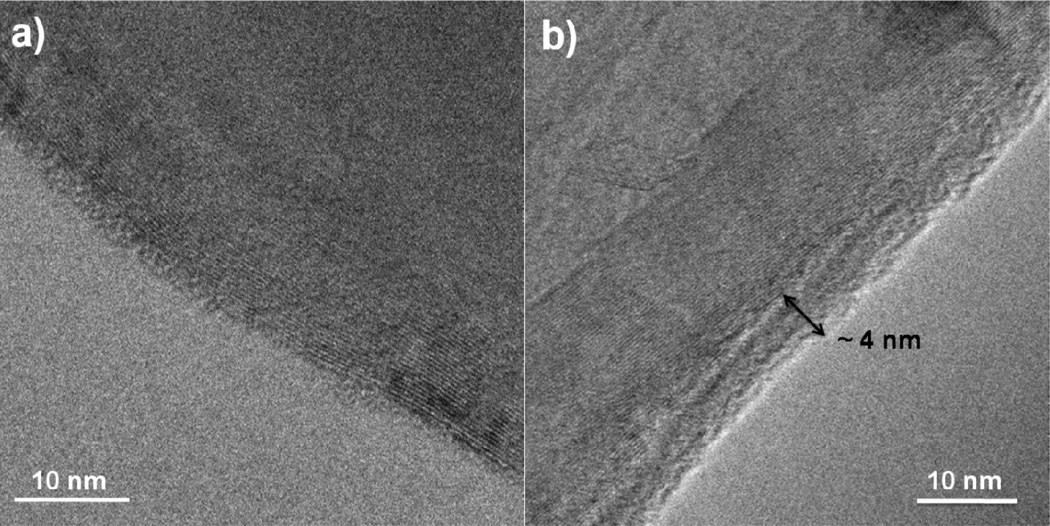
We also collected TEM images after 10 and 15 cycles using the cotton basket, and results are presented in Figure 6. The coatings showed a coarser texture compared to the thicker coatings, consistent with three-dimensional film nucleation. There is not much difference in film thickness and nuclei texture after 10 and 15 cycles. For both samples the nuclei and film thickness varies between ~0 and ~9 nm. The 25 cycle coating (Figure 5) produced a continuous coating, but the film thickness varied considerably between ~4 and ~14 nm. Thicker films (between 50 and 200 cycles) produced more uniform and consistent film coverage on these MWCNTs. Figure 7 shows the measured coating thickness on the multiwall nanotubes versus ALD cycle number when the tubes are encased in cotton fiber baskets during growth. For control experiments, we deposited simultaneously onto silicon wafer pieces exposed directly to the growth vapors, as well as silicon wafer pieces wrapped into fiber baskets. Results from these samples are also presented in Figure 7. The trend in the graph is nearly identical to the results shown in Figure 4 for nanotubes and silicon encased in polypropylene, with a growth rate of ~2 Å/cycle on the CNTs and on the silicon control wafers. To determine whether the elevated growth rate was the result of water present in the cotton fibers, the baskets were loaded with CNTs and heated to 150°C in the reactor for one hour before ALD at 90°C. These samples showed the same growth rate, suggesting residual the excess growth was not due to water trapped in the fiber mesh before deposition.
Figure 6.
TEM images of MWNTs coated with a) 10 and b) 15 cycles Al2O3 ALD at 90°C using the cotton wrapped basket method. Growth of nuclei had begun by 10 cycles and these nuclei were beginning to grow together at 15 cycles.
Figure 7.
Graph comparing ALD growth on Si wafers and MWNTs where the substrates (Si and nanotubes) are encased in cotton fiber baskets. The plot also includes thickness measured on silicon when the substrate is directly wrapped in cotton (without the basket) (labeled “Si / cotton”) and when no fiber containment is present (labeled “Si / open”). The growth increases linearly with cycle number at about the same rate observed for fibers encased in polypropylene (Figure 4). The film thickness on all substrates follows a similar trend, with some deviation present for larger number of cycles.
We also explored a conventional ALD process sequence, without the long soak period, to assess process requirements for CNT coating in the cotton basket method. Results from TEM analysis of MWCNTs coated without the soaking step are shown in Figure 8. Coating MWNTs in the cotton wrapped basket using 50 Al2O3 ALD cycles using a 1s TMA dose, a 30s purge, a 1s H2O dose and a 30 s purge resulted in a ~ 3 ± 1 nm coating that was not conformal or continuous. This result shows that a soak step is important when using the cotton baskets, and based on the data in Figures 3–7 the 60 second soak time appears to be sufficient. A more detailed study of the effect of soak time on film growth uniformity and thickness would help improve and optimize the process. Finally, the results for the fiber basket method further suggest that a larger quantity of nanotubes could be coated using a larger basket and a larger ALD reactor. The recipe would also likely have to be scaled to account for the larger surface area to be coated.
Figure 8.
TEM images of MWNTs coated using the basket method with a cotton fiber wrapping. These nanotubes were coated with 50 cycles of Al2O3 ALD at 90°C using a recipe of 1s TMA/30 N2/1s H2O/30s N2. This recipe resulted in nanotubes with a range of film thicknesses from a) no coating to b) coatings up to approximately 4 nm. The variation in film conformality is likely due to inadequate diffusion of precursor gases through the cotton fiber wrap.
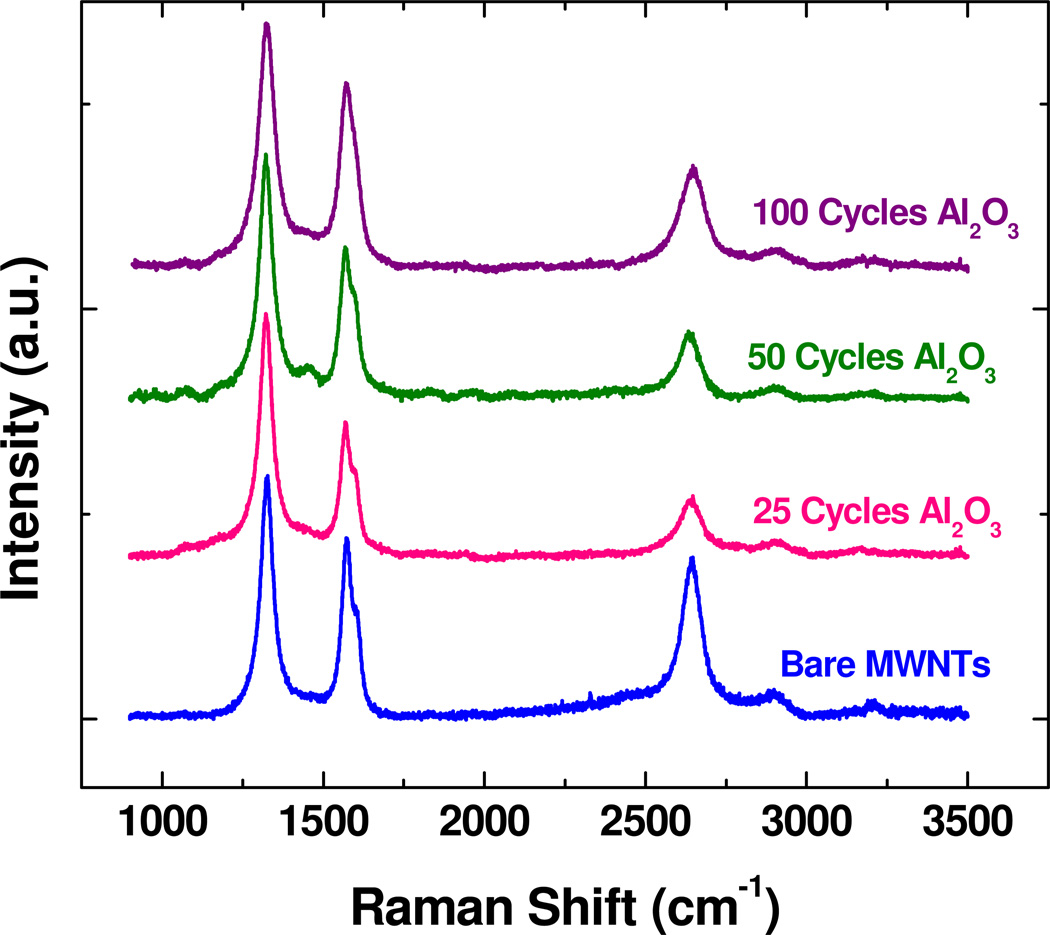
Raman spectra were collected for bare MWNTs as well as those coated with 25, 50, and 100 cycles of Al2O3, as shown in Figure 9. The spectra are typical of MWNTs, including the D, G, D’, G’ peaks near 1320, 1570, 1600 and 2640 cm−1, respectively.28–30 The spectra in the figure are normalized to the D peak. The G peak corresponds to the graphitic carbon signal, and the relative size of the other peaks is often related to disorder and defects, which are substantial in these MWNT materials. Upon ALD coating, changes and trends are detected in the Raman signal, but generally, the primary signatures of the CNT’s are still present, demonstrating that the CNT structure is maintained upon ALD coating. The changes in the spectral peaks may result from some change in the nanotubes upon coating. However, it is also reasonable to expect that a thin conformal coating on the CNT’s could affect the nanotube vibrational signature, even in the absence of change in the CNT itself. Furthermore, although not discussed here in detail, we coated MWNTs with ALD ZnO and tested their Raman signature. The results with ZnO ALD were very similar to that with the Al2O3 ALD. The spectra showed some changes, but the primary Raman signature was not significantly altered.
Figure 9.
Raman spectra of MWNTs treated with a) 0 cycles b) 25 cycles c) 50 cycles and d) 100 cycles of Al2O3 ALD. The spectra show peak locations typically associated with MWNTs.
ALD on MWNTs on TEM Grids
Several MWNTs loaded on TEM grids for ALD coating, and directly transferred to the TEM for imaging. The process sequence used 1s/30s/1s/60s TMA/N2/water/N2 exposures without precursor soak steps. Figure 10 shows typical images for the MWCNTs coated on the TEM grid. During the first 5–10 cycles, nodular nuclei appeared on the CNT surface. Fifteen cycles produced rough but cohesive films. The coatings are smooth and uniform after 100 and 200 ALD cycles. The film thickness increased approximately linearly with number of cycles, with a rate of ~1.1 Å cycle. This is similar to that expected for typical ALD under the conditions used, but it is less than the thickness observed after the soaking exposure sequence in the fiber baskets. This result may indicate some trapping of precursor and/or reactant species in the fiber baskets during the film coating process.
Figure 10.
TEM images from MWNTs mounted on grids prior to deposition. (a) After 10 cycles of Al2O3 ALD, nodular nuclei are readily seen. (b) After 15 cycles, the nuclei have grown into a rough but cohesive film coating. (c) After 100 and (d) 200 cycles, a smooth and conformal film coating is achieved. This trend follows closely that shown in Figures 3 and 5, obtained when the same type of nanotubes are coated using the fiber basket method.
ALD on Other Types of CNTs
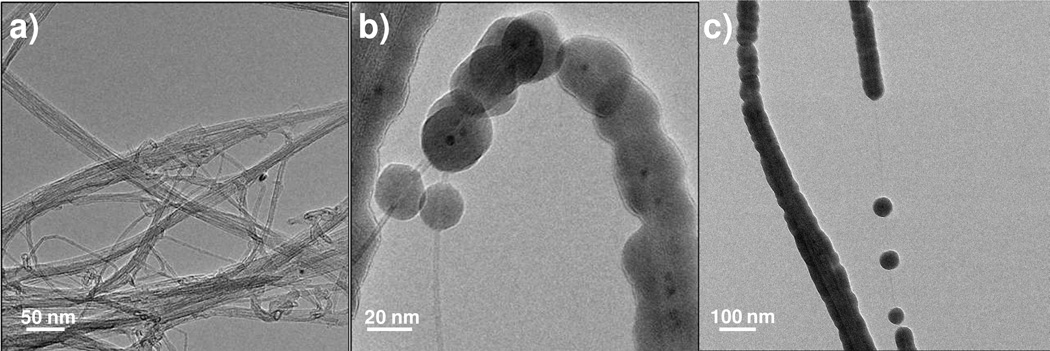
In addition to MWCNTs, we also explored ALD onto commercial single-walled nanotubes. The nanotubes were coated on TEM grids at 90°C, and Figure 11 shows the resulting images collected from a few isolated SWCNTs after ALD coating. The deposition sequence was the same as that for the MWCNTs shown in Figure 10. As received, the nanotubes formed rope-like agglomerations or bundles visible in the TEM micrographs. The bundles remained after coating, making the film thickness and surface texture difficult to evaluate. The coated rope-like agglomerations of SWNTs showed relatively uniform and smooth coatings, however, the individual SWNTs showed nodular growth similar to that reported by Zhan et al.31 After 100 ALD cycles the film thickness was approximately 8 ± 2 nm. This is slightly smaller than that measured on the MWNTs. The nodules persisted after 200 ALD cycles. However they appeared to be growing into one another to form a cohesive film. After 200 ALD cycles the film thickness was approximately 20 ± 3 nm. The 200 cycle coatings appear to have cracked and slid from the nanotubes, as shown in Figure 11c. This cracking and sliding behavior was observed only for the thicker coatings, consistent with the thick Al2O3 layer being more brittle than the nanotube substrates.
Figure 11.
(a) SWNTs as received; and (b) after coating with 100; and (c) 200 cycles of Al2O3 ALD. Samples were mounted onto a TEM grid prior to deposition. The coating thickness is approximately 8 ± 2 nm after 100 cycles and 20 ± 3 nm after 200 cycles. The rope-like aggregates were coated with a relatively uniform coating, whereas individual single-walled nanotubes demonstrated nodular growth. After 200 cycles, the nodules began to grow together into a cohesive film.
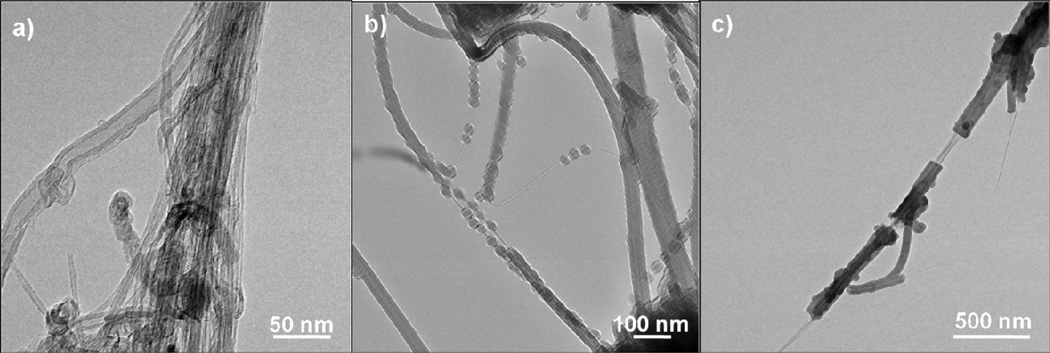
The double-walled nanotubes were also entangled in rope-like aggregates. Figure 12 shows TEM images of DWNTs without coating and after ALD coating on the TEM grids. The ALD coating on the double-walled nanotubes was not continuous, with nodular growth similar to that seen on the SWNT samples. The radius of the nodules in Figure 12b is approximately 10 ± 2 nm. The DWNTs were also aggregated into rope-like bundles in the 200 cycle grid, as shown by the nanotube to the left in Figure 12c. One single DWNT separated from the aggregate in panel (c) showed both nodular and cohesive (but rough textured) growth on different parts of the tube. The average thickness of the coated region was 21 ± 3 nm. More uniform growth likely proceeds on tubes with a high density of defect sites. Because the bundles include multiple tubes, they will have more defects per unit length, and hence will more likely promote cohesive growth.
Figure 12.
TEM images of DWNTs (a) uncoated; (b) and after 100; and (c) 200 cycles of Al2O3 ALD coating The DWNTs showed nodular growth at 100 cycles. By 200 cycles some of the nodules had grown together to form a more continuous coating, however, many uncoated regions remained. The nodule radius was approximately 10 ± 2 nm for the 100 cycle sample. The film thickness for the 200 cycles sample had increased to approximately 21 ± 3 nm for the coated portions of the 200 cycle sample. This is consistent with nucleation on defects, followed by facile film growth with little additional film nucleation on this particular nanotube type.
We next consider coatings on the functionalized nanotubes shown in the TEM images in Figure 13. The uncoated functionalized multiwall nanotubes appear very similar to the non-functionalized MWNTs, but smaller in diameter. The functionalization process performed by the vendor involved refluxing in H2SO4/HNO3 to form carboxyl and hydroxyl functional groups on the surface. Several of the nanotubes appeared to have a rough surface, which was likely a result of the functionalization process. After coating with 100 or 200 ALD cycles on the TEM grid, the coatings were continuous, conformal and smooth with thickness of approximately 11.8 ± 0.6 nm and 23 ± 2 nm respectfully. Again, the growth rate is nearly the same as that on silicon control wafers coated during the same runs.
Figure 13.
TEM images of (a) uncoated functionalized MWNTs (b) functionalized MWNTs coated with 100 cycles of Al2O3 ALD and (c) functionalized MWNTs coated with 200 Al2O3 ALD. The coating thickness was approximately 11.8 ± 0.6 nm for the 100 cycle sample and 23 ± 2 nm for the 200 cycle sample. The coatings were smooth and conformal for both the 100 and 200 cycle samples.
IV. Discussion and Conclusions
We find that reasonably reliable ALD coatings can be obtained on milligram quantities of carbon nanotubes in a conventional flow-through reactor by enclosing the nanotube particles into baskets constructed from nonwoven polypropylene or cotton fabric. Simple flow analysis suggests that the ALD precursors and co-reactant species can readily transport through the fiber mesh and permeate the CNT powder sample, and TEM data regarding coating uniformity and conformality are consistent with this analysis. To provide sufficient species transport time, an exposure soak cycle is used, where the substrate is exposed to standing gas for ~ 60 seconds during each ALD half-cycle step. The soak sequence produced a growth rate of ~ 2 Å/cycle for TMA/water exposure at 90°C, which is nearly a factor of two larger than observed for conventional continuous gas flow ALD under otherwise the same process conditions, indicating that the processing conditions have yet to be optimized. Growth proceeded readily on multiwall carbon nanotubes, producing conformal films as thin as ~4 nm in this study after 35 ALD cycles.
The film growth on the nanotubes appears to be independent of whether PP or cotton was used as the wrapping material. Fiber baskets fabricated using relatively dense nonwoven polypropylene provided the same results as fiber baskets produced using less dense cotton fabric. Even though coatings exceeding ~45 nm were not evaluated in this study, we anticipate that increasing the ALD cycles beyond 200 or more may ultimately impede further film growth. At some point the ALD film deposited on the fiber mesh container will begin to hamper the diffusion of precursor and byproduct gases through the material.
Fiber basket enclosures and cotton fiber bundles were compared for safe nanotube confinement and encapsulation of milligram quantities of carbon nanotubes during sample transfer, loading and coating deposition. The fiber basket method was easier to implement than the fiber bundle method, and the baskets enabled larger quantities of nanotubes to be coated. Moreover, the basket approach produced more repeatable and uniform coatings on the carbon nanotubes compared to those loaded in fiber bundles. The fiber basket method produced repeatable and uniform coatings on milligram quantities of nanotubes using a conventional viscous flow reactor system. This approach circumvented the need for specialized fluidized bed or rotary ALD reactors for lab-scale studies, especially where particle aggregation is not critical. After loading fiber baskets with CNTs in the glovebox, the baskets were handled and transported in air to the reactor, exposed to the coating sequence, then transferred back to the glovebox. This process produced no visible loss of nanotubes to the air or outer surface of the white fiber baskets, indicating that the baskets were reasonably safe to use in the laboratory environment.
The fiber basket method provides a relatively simple approach to coat larger number of CNT’s and other micro or nanoscale objects in conventional flow-through ALD reactors. While the expressed toxicity and safety of nanomaterials were not studied here, the encapsulation method helped significantly to reduce nanotube and nanoparticle dispersion during routine laboratory handling. While we demonstrate here coatings on up to 100 mg of sample in one deposition run, scaling the process to larger basket size will require process analysis to achieve optimum conditions.
Acknowledgments
The authors acknowledge support from NIH RC2 grant 1RC2ES018772-01 in collaboration with J. Bonner in the Department of Toxicology at NC State University, and support from NSF, project number CMMI-1000382.
References
- 1.Harris PJF. Carbon Nanotube Science. New York: Cambridge University Press; 2009. [Google Scholar]
- 2.Schnorr JM, Swager TM. Chem. Mat. 2011;23:646. [Google Scholar]
- 3.Dai HJ. Accounts Chem. Res. 2002;35:1035. doi: 10.1021/ar0101640. [DOI] [PubMed] [Google Scholar]
- 4.Eder D. Chem. Rev. 2010;110:1348. doi: 10.1021/cr800433k. [DOI] [PubMed] [Google Scholar]
- 5.Donaldson K, Poland CA. Nat. Nanotechnol. 2009;4:708. doi: 10.1038/nnano.2009.327. [DOI] [PubMed] [Google Scholar]
- 6.Ryman-Rasmussen JP, Cesta MF, Brody AR, Shipley-Phillips JK, Everitt JI, Tewksbury EW, Moss OR, Wong BA, Dodd DE, Andersen ME, Bonner JC. Nat. Nanotechnol. 2009;4:747. doi: 10.1038/nnano.2009.305. [DOI] [PMC free article] [PubMed] [Google Scholar]
- 7.Ryman-Rasmussen JP, Tewksbury EW, Moss OR, Cesta MF, Wong BA, Bonner JC. Am. J. Respir. Cell Mol. Biol. 2009;40:349. doi: 10.1165/rcmb.2008-0276OC. [DOI] [PMC free article] [PubMed] [Google Scholar]
- 8.Lam CW, James JT, McCluskey R, Hunter RL. Toxicol. Sci. 2004;77:126. doi: 10.1093/toxsci/kfg243. [DOI] [PubMed] [Google Scholar]
- 9.Warheit DB, Laurence BR, Reed KL, Roach DH, Reynolds GAM, Webb TR. Toxicol. Sci. 2004;77:117. doi: 10.1093/toxsci/kfg228. [DOI] [PubMed] [Google Scholar]
- 10.Shvedova AA, Kisin ER, Mercer R, Murray AR, Johnson VJ, Potapovich AI, Tyurina YY, Gorelik O, Arepalli S, Schwegler-Berry D, Hubbs AF, Antonini J, Evans DE, Ku BK, Ramsey D, Maynard A, Kagan VE, Castranova V, Baron P. Am. J. Physiol.-Lung Cell. Mol. Physiol. 2005;289:L698. doi: 10.1152/ajplung.00084.2005. [DOI] [PubMed] [Google Scholar]
- 11.Muller J, Huaux F, Moreau N, Misson P, Heilier JF, Delos M, Arras M, Fonseca A, Nagy JB, Lison D. Toxicol. Appl. Pharmacol. 2005;207:221. doi: 10.1016/j.taap.2005.01.008. [DOI] [PubMed] [Google Scholar]
- 12.Sun Z, Nicolosi V, Rickard D, Bergin SD, Aherne D, Coleman JN. J. Phys. Chem. C. 2008;112:10692. [Google Scholar]
- 13.Chen LF, Xie HQ. Thermochim. Acta. 2010;497:67. [Google Scholar]
- 14.Jiang LQ, Gao L, Sun J. J. Colloid Interface Sci. 2003;260:89. doi: 10.1016/s0021-9797(02)00176-5. [DOI] [PubMed] [Google Scholar]
- 15.Herrmann CF, Fabreguette FH, Finch DS, Geiss R, George SM. Appl. Phys. Lett. 2005;87:3. [Google Scholar]
- 16.Min YS, Bae EJ, Jeong KS, Cho YJ, Lee JH, Choi WB, Park GS. Adv. Mater. 2003;15:1019. [Google Scholar]
- 17.Farmer DB, Gordon RG. Nano Lett. 2006;6:699. doi: 10.1021/nl052453d. [DOI] [PubMed] [Google Scholar]
- 18.Cavanagh AS, Wilson CA, Weimer AW, George SM. Nanotechnology. 2009;20:255602. doi: 10.1088/0957-4484/20/25/255602. [DOI] [PubMed] [Google Scholar]
- 19.McCormick JA, Cloutier BL, Weimer AW, George SM. J. Vac. Sci. Technol. A. 2007;25:67. [Google Scholar]
- 20.King DM, Spencer JA, Liang X, Hakim LF, Weimer AW. Surf. Coat. Technol. 2007;201:9163. [Google Scholar]
- 21.Jur JS, Spagnola JC, Lee K, Gong B, Peng Q, Parsons GN. Langmuir. 2010;26:8239. doi: 10.1021/la904604z. [DOI] [PubMed] [Google Scholar]
- 22.Spagnola JC, Gong B, Arvidson SA, Jur JS, Khan SA, Parsons GN. J. Mater. Chem. 2010;20:4213. [Google Scholar]
- 23.Hyde GK, Park KJ, Stewart SM, Hinestroza JP, Parsons GN. Langmuir. 2007;23:9844. doi: 10.1021/la701449t. [DOI] [PubMed] [Google Scholar]
- 24.Hyde GK, Scarel G, Spagnola JC, Peng Q, Lee K, Gong B, Roberts KG, Roth KM, Hanson CA, Devine CK, Stewart SM, Hojo D, Na JS, Jur JS, Parsons GN. Langmuir. 2010;26:2550. doi: 10.1021/la902830d. [DOI] [PubMed] [Google Scholar]
- 25.Hyde GK, McCullen SD, Jeon S, Stewart SM, Jeon H, Loboa EG, Parsons GN. Biomed. Mater. 2009;4 doi: 10.1088/1748-6041/4/2/025001. Article number 025001 (10pp), doi:10.1088/1748-6041/4/2/025001. [DOI] [PubMed] [Google Scholar]
- 26.Kucheyev SO, Biener J, Wang YM, Baumann TF, Wu KJ, van Buuren T, Hamza AV, Satcher JH, Elam JW, Pellin MJ. Appl. Phys. Lett. 2005;86 Article Number: 083108 DOI: 10.1063/1.1870122. [Google Scholar]
- 27.Knez M, Niesch K, Niinisto L. Adv. Mater. 2007;19:3425. [Google Scholar]
- 28.Saito R, Jorio A, Souza AG, Dresselhaus G, Dresselhaus MS, Pimenta MA. Phys. Rev. Lett. 2002;88 doi: 10.1103/PhysRevLett.88.027401. Article Number: 035404 DOI: 10.1103/PhysRevB.65.035404. [DOI] [PubMed] [Google Scholar]
- 29.Chakrapani N, Curran S, Wei BQ, Ajayan PM, Carrillo A, Kane RS. J. Mater. Res. 2003;18:2515. [Google Scholar]
- 30.Murphy H, Papakonstantinou P, Okpalugo TIT. J. Vac. Sci. Technol. B. 2006;24:715. [Google Scholar]
- 31.Zhan GD, Du XH, King DM, Hakim LF, Liang XH, McCormick JA, Weimer AW. J. Am. Ceram. Soc. 2008;91:831. [Google Scholar]


