Abstract
Etravirine (ETR) is a second-generation non-nucleoside reverse transcriptase inhibitor prescribed for the treatment of HIV-1. By using human liver microsomes (HLMs), cDNA-expressed cytochromes P450 (P450s), and UDP-glucuronosyltransferases (UGTs), the routes of ETR metabolism were defined. Incubations with cDNA-expressed P450 isozymes and chemical inhibition studies using HLMs indicated that CYP2C19 is primarily responsible for the formation of both the major monohydroxylated and dihydroxylated metabolites of ETR. Tandem mass spectrometry suggested that these metabolites were produced via monomethylhydroxylation and dimethylhydroxylation of the dimethylbenzonitrile moiety. Formation of these monohydroxy and dihydroxy metabolites was decreased by 75 and 100%, respectively, in assays performed using HLMs that were genotyped as homozygous for the loss-of-function CYP2C19*2 allele compared with formation by HLMs genotyped as CYP2C19*1/*1. Two monohydroxylated metabolites of lower abundance were formed by CYP3A4, and interestingly, although CYP2C9 showed no activity toward the parent compound, this enzyme appeared to act in concert with CYP3A4 to form two minor dihydroxylated products of ETR. UGT1A3 and UGT1A8 were demonstrated to glucuronidate a CYP3A4-dependent monohydroxylated product. In addition, treatment of primary human hepatocytes with ETR resulted in 3.2-, 5.2-, 11.8-, and 17.9-fold increases in CYP3A4 mRNA levels 6, 12, 24, and 72 h after treatment. The presence of the pregnane X receptor antagonist sulforaphane blocked the ETR-mediated increase in CYP3A4 mRNA expression. Taken together, these data suggest that ETR and ETR metabolites are substrates of CYP2C19, CYP3A4, CYP2C9, UGT1A3, and UGT1A8 and that ETR is a PXR-dependent modulator of CYP3A4 mRNA levels.
Introduction
Reverse transcription of single-stranded human immunodeficiency virus (HIV) RNA into double-stranded DNA is a crucial, complex step in the replication of the virus and requires the use of two HIV reverse transcriptase active sites (Götte et al., 1999). Because HIV reverse transcriptase is essential for HIV replication, the enzyme is a major target for antiretroviral drug development (Parniak and Sluis-Cremer, 2000). HIV-1 and HIV-2 are the two known species of the virus, with HIV-1 being the more virulent and thus the cause of the majority of HIV infections globally. To date, there are two classes of reverse transcriptase inhibitors that are routinely used in the clinic to treat HIV-1 infection: the nucleoside/nucleotide reverse transcriptase inhibitors and the non-nucleoside reverse transcriptase inhibitors (NNRTIs). NNRTI-based treatment approaches are effective in suppressing HIV RNA levels, causing a concomitant increase in immune function in a large majority of patients (Staszewski et al., 1999; Gallant et al., 2004; Squires et al., 2004; Gulick et al., 2006; Riddler et al., 2008). To maximally suppress viral loads and decrease incidence of drug resistance, NNRTIs are prescribed in combination with other antiretrovirals (i.e., protease inhibitors, integrase inhibitors, fusion inhibitors, and CCR5 antagonists) as part of highly active antiretroviral therapy.
4-[6-Amino-5-bromo-2-[(4-cyanophenyl)amino] pyrimidin-4-yl]oxy-3,5-dimethylbenzonitrile (etravirine; ETR) is a second-generation NNRTI that, like other NNRTIs, functions by binding noncompetitively to HIV reverse transcriptase, thereby preventing synthesis of DNA from the RNA genome of the virus. As a diarylpyrimidine, ETR has a high capacity for isomerization, which allows it to effectively bind to and inhibit common mutated forms of the viral enzyme (Andries et al., 2004; Vingerhoets et al., 2005; Gupta et al., 2011; Picchio et al., 2011). Therefore, ETR has a higher genetic barrier to viral resistance and as such is often prescribed for treatment-experienced patients who have developed mutations that confer resistance to first-generation NNRTIs (Lazzarin et al., 2007; Madruga et al., 2007; Nadler et al., 2007). Because ETR is always taken concurrently with other antiretrovirals that are substrates, inhibitors, and inducers of drug-metabolizing enzymes (Kakuda et al., 2010; Calcagno et al., 2011), gaining a comprehensive understanding of the metabolic pathways involved in the clearance of ETR is important to minimize drug-drug interactions and adverse events. For instance, it has recently been demonstrated in healthy adults that ETR decreases exposure to certain antiretrovirals prescribed for the treatment of HIV including dolutegravir (by 70%) (Song et al., 2011) and maraviroc (by 53%) (Kakuda et al., 2011). CYP3A4 has been shown to play a central role in the N-dealkylation of maraviroc, which is the major route of maraviroc metabolism, raising the possibility that ETR decreases exposure to maraviroc in vivo via modulation of CYP3A4 expression and/or activity (Hyland et al., 2008). The ETR product label (Tibotec, Inc., 2011) and a review article (Schöller-Gyüre et al., 2009) state that cytochromes P450 (P450s) 3A4, 2C19, and 2C9 are responsible for the oxidative metabolism of ETR and that ETR is an inducer of CYP3A4 expression; however, primary data that comprehensively describe the metabolites formed, the contribution of these P450s to ETR metabolism, and the mechanism(s) by which ETR increases CYP3A4 levels have yet to be published. In addition, although glucuronidation of oxidative metabolites of ETR by UDP-glucuronosyltransferases (UGTs) has been noted, the enzymes involved in the formation of these metabolites have yet to be reported (Schöller-Gyüre et al., 2009).
With this in mind, the primary objectives of the present study were to gain a comprehensive understanding of the routes of ETR metabolism as well as to characterize the ability of ETR to modulate the expression of hepatic CYP3A4. By using HLMs, cDNA-expressed P450s, cDNA-expressed UGTs, and primary human hepatocytes, the products of ETR metabolism and the relative contributions of the enzymes involved were defined. CYP2C19 was found to be primarily responsible for the formation of both the major monooxygenated and dioxygenated metabolites of ETR. Of interest, the monohydroxy product was markedly reduced and the dihydroxy metabolite was undetectable in assays performed using HLMs genotyped as homozygous for the loss-of-function CYP2C19*2 allele. Thus, ETR may have novel utility as a probe substrate for phenotyping CYP2C19 activity. In addition, it is demonstrated using primary human hepatocytes that the mRNA levels of CYP3A4 are modulated by ETR in a pregnane X receptor (PXR)-dependent manner. Taken together, these studies provide a mechanistic foundation for understanding and potentially predicting drug-drug interactions involving ETR.
Materials and Methods
Materials.
Etravirine was supplied by the National Institutes of Health AIDS Research and Reference Reagent Program (Germantown, MD). Ketoconazole, furafylline, quinidine, sulfaphenazole, and (+)-N-3-benzylnirvanol were purchased from Sigma-Aldrich (St. Louis, MO), and 2-phenyl-2-(1-piperidinyl)propane (PPP) was obtained from Santa Cruz Biotechnology, Inc. (Santa Cruz, CA). Sulforaphane (SFN) was purchased from Toronto Research Chemicals Inc. (North York, ON, Canada). Rifampin (RIF) was obtained from sanofi-aventis (Bridgewater, NJ).
Metabolism Assays.
For metabolite identification experiments, ETR (20 μM) was incubated with HLMs (50 donor pool; BD Biosciences, San Jose, CA), Supersomes expressing individual human cytochromes P450 (BD Biosciences; CYP1A2, -2B6, -2C8, -2C9, -2C19, -2D6, -3A4, and -3A5) or both P450 Supersomes and Supersomes expressing individual UGTs (BD Biosciences; UGT1A1, -1A3, -1A4, -1A6, -1A7, -1A8, -1A9, -1A10, -2B4, -2B7, -2B15, and -2B17). The final concentrations of microsomes, P450s, and UGTs were 2 mg/ml, 20 pmol/ml, and 0.2 mg/ml, respectively. After a 5-min equilibration period at 37°C in 100 mM potassium phosphate buffer, pH 7.4, the reaction was initiated by addition of an NADPH-regenerating system (BD Biosciences) and allowed to proceed for 30 min at 37°C. For the UGT experiments, reactions also contained 2 mM UDP-glucuronic acid (UDPGA) and UGT reaction mix (Tris buffer, pH 7.5, alamethicin, and MgCl2; BD Biosciences), and reaction mixtures were incubated for a total of 60 min at 37°C because 30-min incubations did not result in the formation of glucuronidated metabolites that could be detected above the level of background. The total reaction volume was 500 μl. For the enzyme kinetics experiments, the incubations were performed under initial rate conditions, using CYP3A4 (5 pmol) and CYP2C19 (0.5 pmol). These reactions were allowed to proceed for 20 min at 37°C using concentrations of ETR ranging from 0 to 160 μM for the CYP3A4 incubation and from 0 to 40 μM for the CYP2C19 experiments in a total reaction volume of 100 μl. All reactions were terminated by the addition of acetonitrile followed by centrifugation at 3000g for 10 min at 4°C. The resulting supernatant was removed and evaporated to dryness under nitrogen gas stream. The residue was reconstituted in 200 μl of methanol, and 5 μl was injected onto an ultraperformance liquid chromatography-mass spectrometry (UPLC-MS) system for analysis.
P450 inhibition assays were conducted using 0.5 mg/ml HLMs in the presence of an NADPH-regenerating system, 2 mM UDPGA and UGT reaction mix, and 20 μM ETR, with or without the following P450 inhibitors: 10 μM (+)-N-3-benzylnirvanol (CYP2C19 inhibitor), 20 μM furafylline (CYP1A2 inhibitor), 1 μM ketoconazole (CYP3A4 inhibitor), 30 μM PPP (CYP2B6 inhibitor), 1 μM quinidine (CYP2D6 inhibitor), or 20 μM sulfaphenazole (CYP2C9 inhibitor). The concentrations of inhibitors and HLMs used in these assays were selected on the basis of those reported previously (Suzuki et al., 2002; Ward et al., 2003; Walsky and Obach, 2007). All inhibitors were dissolved in DMSO except ketoconazole, which was dissolved in methanol, and control reactions were conducted using solvents alone. The total reaction volume was 250 μl in 100 mM potassium phosphate buffer, pH 7.4. HLMs, NADPH, UDPGA, UGT reaction mix, and inhibitors were incubated for 5 min at 37°C followed by the addition of ETR. The reactions were allowed to proceed for 30 min before termination by the addition of acetonitrile. Inhibition assays using cDNA-expressed CYP2C19 contained 0.5 pmol of protein, and reaction components and conditions were the same as those used for inhibition assays using HLMs.
For coincubations with P450s 3A4 and 2C9, 5 pmol of each P450 were incubated together with 20 μM ETR in the presence of NADPH for 30 min at 37°C. For sequential incubations, 5 pmol of either CYP3A4 or CYP2C9 was incubated with 20 μM ETR with or without NADPH for 60 min at 37°C. These reactions were then stopped using acetonitrile, centrifuged to remove protein, and dried down under nitrogen gas stream. DMSO (5 μl) was added to reconstitute ETR and its metabolites and 1 μl was then added to a mixture containing 5 pmol CYP3A4 or CYP2C9 and NADPH. This second reaction was allowed to proceed for 30 min at 37°C, at which point the reactions were terminated by the addition of acetonitrile and later analyzed using UPLC-MS for the presence of M5 and M6. Final reaction volumes were 100 μl in 100 mM potassium phosphate buffer, pH 7.4.
UPLC-MS.
An UPLC-MS assay method was developed for the quantification and identification of ETR metabolites, using an Acquity UPLC system (Waters, Milford, MA) coupled to an AB SCIEX QTRAP 5500 mass spectrometer. The samples were resolved using a XTerra MS C18 column (2.5 μm, 21 × 50 mm; Waters) at a flow rate of 0.5 ml/min. A gradient was generated that consisted of mobile phases A (water, 0.1% formic acid) and B (acetonitrile, 0.1% formic acid) that was held at 30% B from 0 to 0.4 min, 30% B to 85% B from 0.4 to 4.5 min, 85% B to 100% B from 4.5 to 4.6 min, and 100% B to 15% B from 4.6 to 4.8 min and maintained at 15% B until 5.5 min. Standard curves were generated using ETR because ETR metabolite standards were not commercially available. The electrospray ionization interface was set to positive ion mode and the following instrument parameters: TIS temperature, 600°C; TIS voltage, 4500 V; curtain gas, nitrogen, 35; nebulizing gas, 40; TIS gas, 40; collision energy, 51; declustering potential, 171 V; entrance potential, 10 V; and collision cell exit potential, 26 V. Dwell times were 75 ms and unit mass resolution was used. Metabolite identification was performed in product ion (MS/MS) mode, and multiple reaction monitoring was used for quantification and initial detection. The following transitions (Q1 → Q3) were monitored: m/z 435.3 → 304.1 (ETR), m/z 451.3 → 304.1 (monohydroxy ETR; M1 and M2), m/z 451.3 → 353.1 (monohydroxy ETR; M3), m/z 467.3 → 369 (dihydroxy ETR; M4, M5, and M6), and m/z 627.3 → 338.1 (monohydroxy ETR glucuronide conjugate; M7). Retention times for metabolites M1 to M7 were 2.54, 2.68, 2.23, 1.27, 1.52, 2.24, and 1.48 min, respectively.
Hepatocyte Culture.
Fresh primary human hepatocytes (six-well plates) with Matrigel overlay from eight donors (Lots 1007, 1014, 1018, 1025, 1026, 1033, 1064, and 1071) were obtained from XenoTech, LLC (Lenexa, KS). Ages in years and genders of donors were 20 male, 55 male, 59 male, 57 male, 55 female, 61 male, 14 male, and 60 female, respectively. Cell viabilities according to the product sheets provided by XenoTech were at least 73%. Upon receipt of hepatocytes, shipping medium was replaced with Williams' E medium supplemented with 10% heat-inactivated fetal bovine serum (Invitrogen, Carlsbad, CA), penicillin-streptomycin (Sigma-Aldrich), insulin-transferrin-selenium (Mediatech, Herndon, VA) and l-glutamine (Invitrogen). Hepatocytes were then incubated overnight at 37°C in a 5% CO2 humidified environment. After the overnight incubation the medium was replaced, and the hepatocytes were treated with DMSO (vehicle control, 0.1% final volume), 10 μM ETR, or 10 μM RIF in the presence or absence of the PXR antagonist SFN (25 μM) (Zhou et al., 2007). For treatments in the presence of SFN, this compound was added 30 min before the addition of ETR or RIF. Primary human hepatocytes were incubated with ETR for 6, 12, 24, or 72 h. For 72-h ETR treatments, the medium was replaced every 24 h and ETR was added after each medium change. At the end of the incubation time, the medium was removed and extracted twice using ethyl acetate and centrifuged for 10 min at 1200g. The organic phase was dried at 37°C under vacuum, and the analytes were reconstituted in 200 μl of methanol for UPLC-MS analysis.
RNA Isolation and Real-Time qPCR Analysis.
RNA from primary human hepatocytes was isolated using TRIzol reagent (Invitrogen) according to the manufacturer's instructions. The RNA concentration was determined spectrophotometrically. Reverse transcription was performed using a Maxima First-Strand cDNA Synthesis Kit for real-time qPCR (Fermentas, Inc., Glen Burnie, MD), and each reaction contained 3 μg of total RNA. Before qPCR was performed, glyceraldehyde-3-phosphate dehydrogenase (GAPDH) PCR products were generated and the isolated products were ligated into the pJET1.2/blunt cloning vector for subcloning (Fermentas, Inc.). Sequencing was used to confirm the identity of the cloned insert. Serial dilutions of the resulting plasmid were used as the standard curves for quantitation of mRNA in qPCR assays. Primers used in qPCR assays were as follows: GAPDH (NM_002046.3), 5′-CTTCTTTTGCGTCGCCAGCCGA-3′ (forward, coordinates 62–83) and 5′-CACGACGTACTCAGCGCCAGC-3′ (reverse, coordinates 390–370); CYP3A4 (NM_017460.5), 5′-AGGGCCCACACCTCTGCCTT-3′ (forward, coordinates 224–243) and 5′-GCCTGTCTCTGCTTCCCGCC-3′ (reverse, coordinates 608–589); CYP2C19 (NM_000769.1), 5′-TCAGGATTGTAAGCACCCCCTGGA-3′ (forward, coordinates 614–637) and 5′-GGTTGTGCCCTTGGGAATGAGG-3′ (reverse, coordinates 1158–1137); and CYP2C9 (NM_000771.3), 5′-ACACAGATGCTGTGGTGCACGA-3′ (forward, coordinates 1065–1086) and 5′-AGGAAAGAGAGCTGCAGGGACTGCA-3′ (reverse, coordinates 1551–1527). Real-time qPCR was run according to the following thermal cycling conditions: 94°C for 5 min, followed by 40 cycles of 94°C for 15 s, 55°C for 15 s, and 72°C for 30 s. GAPDH was used for normalization of mRNA levels because it did not exhibit sensitivity to ETR treatment.
Statistical Analysis.
Data analysis was performed using GraphPad Prism (version 5.04; GraphPad Software Inc., San Diego, CA). Statistical significance, determined by Student's t test, is indicated throughout by the following: *, p < 0.05; **, p < 0.01; and ***, p < 0.001.
Results
Identification of ETR Metabolites.
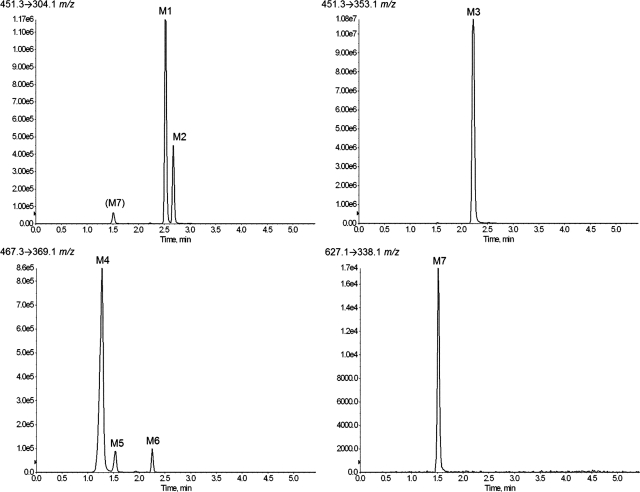
Metabolites of ETR were initially identified using HLMs and UPLC-MS analysis. Because multiple reaction monitoring provides increased sensitivity and signal/noise ratio, this mode was used to predict potential metabolites of ETR based on the structure and fragmentation pattern of the parent compound. By using this method, three monohydroxylated products (451 m/z), three dihydroxylated products (467 m/z), and one O-glucuronide (627 m/z) were detected (Fig. 1). These seven metabolites are denoted herein as metabolite 1 (M1) through metabolite 7 (M7). Scans were also performed in mass spectrometric mode to search for other potential metabolites of ETR, but no additional analytes were detected above a signal/noise ratio of 5:1. The transitions used were (Q1 → Q3): 451.3 → 304.1 (M1 and M2), 451.3 → 353.1 (M3), 467.3 → 369.1 (M4, M5, and M6), and 627.3 → 338.1 m/z (M7). Because of the loss of glucuronic acid (−176 atomic mass units) conjugated to a monohydroxylated metabolite (451 m/z), the O-glucuronide product (M7) was detected as well using the 451.3 → 304.1 m/z transition, and MS/MS analysis confirmed that the fragmentation pattern of this analyte was indeed identical to M7. The relative amounts of metabolites formed during 60-min incubations with both NADPH and UDPGA with UGT reaction mix were 8.71, 3.35, 80.1, 6.35, 0.65, and 0.74 and 0.13% for M1, M2, M3, M4, M5, M6, and M7, respectively.
Fig. 1.
Extracted ion chromatograms of etravirine metabolites formed by HLMs. HLMs (2 mg/ml) were incubated with 20 μM ETR for 30 min at 37°C in the presence of an NADPH-regenerating system and UDPGA. Metabolites were detected using UPLC-MS in multiple reaction monitoring mode, by means of the following transitions: 451.3 → 304.1 m/z (M1 and M2), 451.3 → 353.1 m/z (M3), 467.3 → 369.1 m/z (M4, M5, and M6), and 627.1 → 338.1 m/z (M7). Data shown are representative of three individual experiments.
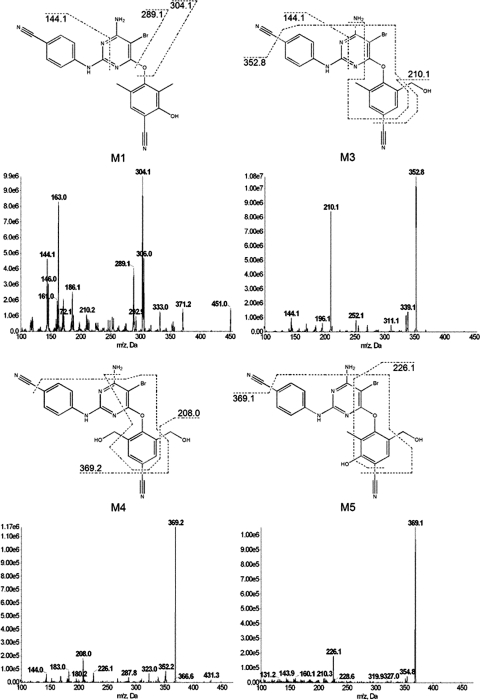
To elucidate the chemical structures of the metabolites, MS/MS was performed. The fragment ions for all metabolites are shown in Table 1, and the origins of the major fragment ions generated from M1, M3, M4, and M5 are proposed in Fig. 2. For M1, it is proposed that fragment ions 144.1, 289.1, and 304.1 m/z correspond to losses of C12H10BrN3O2, C9H8NO2, and C9H8NO, respectively. The fragmentation pattern of M3 is suggested to arise from loss of C12H10BrN3O2, C2H5N2O, and C3H5N3O, representing fragment ions 144.1, 210.1, and 352.8 m/z, respectively. The major ions formed from fragmentation of M4, 208.0 and 369.2 m/z, are proposed to be formed from the loss of C11H13N6O2 and C3H5N3O, respectively. Finally, 226.1 and 369.1 m/z, the chief fragment ions of M5, are believed to be formed from the loss of C11H11N6O and C3H5N3O, respectively. Although readily chromatographically separated from one another, the fragmentation patterns of M2 and M6 were nearly identical to those of M1 and M5, respectively. The MS/MS spectra indicate that all of these metabolites are formed via oxidative metabolism.
TABLE 1.
Electrospray ionization-liquid chromatography/mass spectrometry mass spectral data for metabolites of ETR
| Metabolite | [M − H]+ | Fragment Ions |
|---|---|---|
| M1 | 451 | 371, 333, 306, 304, 289, 210, 186, 172, 163, 161, 146, 144, 119 |
| M2 | 451 | 371, 353, 306, 304, 289, 225, 210, 188, 172, 163, 161, 146, 144, 120 |
| M3 | 451 | 353, 339, 311, 252, 210, 196, 144 |
| M4 | 467 | 369, 352, 323, 288, 226, 208, 183, 144 |
| M5 | 467 | 369, 355, 226 |
| M6 | 467 | 369, 355, 226 |
| M7 | 627 | 451, 433, 372, 353, 333, 289, 163 |
Fig. 2.
MS/MS spectra and proposed origin of fragment ions for metabolites M1, M3, M4, and M5. HLMs (2 mg/ml) were incubated with 20 μM ETR for 30 min at 37°C in the presence of an NADPH-regenerating system. Metabolites were detected and fragmented using UPLC-MS/MS in product ion mode. Data shown are representative of three individual experiments.
ETR Is Primarily Metabolized by CYP3A4, CYP2C9, and CYP2C19.
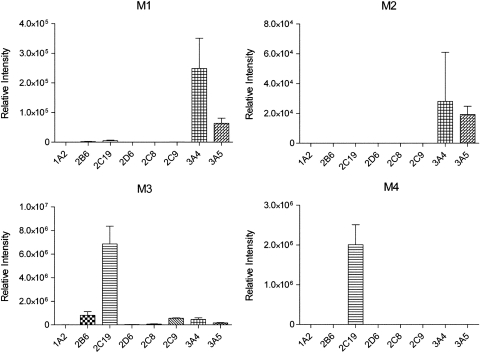
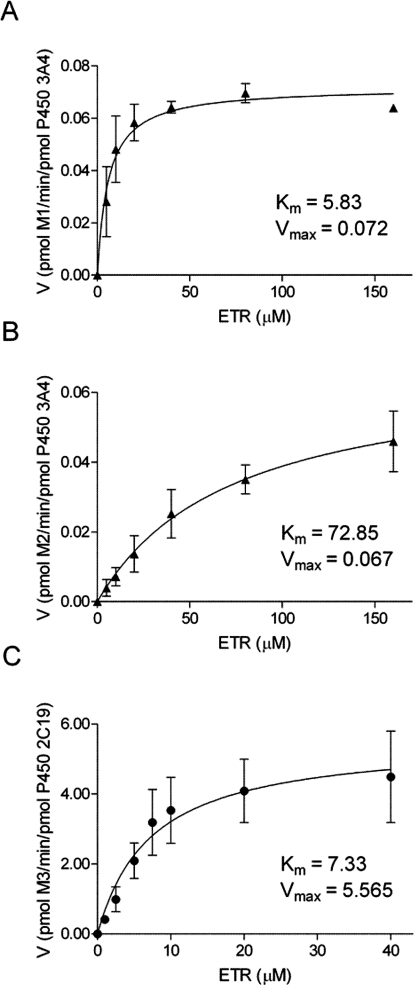
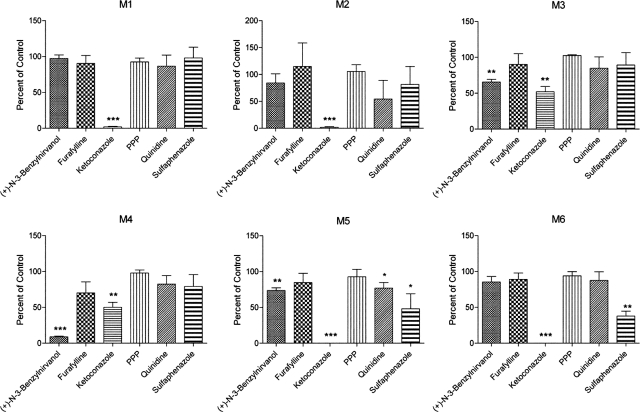
To identify the P450s involved in the biotransformation of ETR, assays were performed using cDNA-expressed CYP1A2, -2B6, -2C19, -2D6, -2C8, -2C9, -3A4, or -3A5. CYP3A4 and CYP3A5 both catalyzed the formation of M1 and M2, whereas M3 was most abundant after incubation of ETR with CYP2C19 (Fig. 3). The enzyme kinetic constants for these reactions were determined, and the Km values of M1 and M2 formation by CYP3A4 were 5.83 and 72.85 μM, respectively, whereas the Vmax values were 0.072 and 0.067 pmol · min−1 · pmol−1 CYP3A4, respectively (Fig. 4, A and B). The Km and Vmax of M3 formation by CYP2C19 were 7.33 μM and 5.57 pmol · min−1 · pmol−1 CYP2C19, respectively (Fig. 4C). In addition, CYP2C19 was the only P450 of those tested that was able to catalyze the formation of the dimethylhydroxylated product M4 when incubated alone with ETR (Fig. 3). In contrast, the dihydroxylated metabolites M5 and M6 were not detected after incubations with these individual P450s. Therefore, to confirm the data obtained using the cDNA-expressed P450s and to address the possibility that sequential metabolism involving more than one P450 was responsible for the formation of M5 and M6, HLMs were incubated with ETR in the presence and absence of chemical inhibitors of P450 activity. Inhibition of CYP1A2, 2B6, and 2D6 using furafylline, PPP, and quinidine, respectively, had little effect on ETR metabolism, whereas the effects of inhibiting CYP2C19 and CYP3A4 were marked (Fig. 5). Inhibition of CYP2C19 by (+)-N-3-benzylnirvanol decreased formation of M3 and M4 by 34 and 91%, respectively, whereas incubation with ketoconazole to block CYP3A4 activity reduced formation of M1, M2, M5, and M6 by 98, 98, 100, and 100%, respectively. The presence of ketoconazole also resulted in a 48 and 50% decrease in the abundance of M3 and M4, respectively, which the individual P450 data had indicated were primarily formed via CYP2C19-dependent metabolism. Therefore, to test whether the effect of ketoconazole on M3 and M4 formation was due to inhibition of CYP2C19 rather than inhibition of CYP3A4, cDNA-expressed CYP2C19 was incubated with ETR and either ketoconazole or vehicle control, and percentage inhibition was calculated. Ketoconazole inhibited M3 and M4 formation by 37 and 51%, respectively. Incubations conducted in parallel with the CYP2C19 inhibitor (+)-N-3-benzylnirvanol resulted in 34 and 74% inhibition of M3 and M4, respectively. Furthermore, the Km value for formation of M3 by CYP3A4 was 27.8 μM, which was approximately 3.8-fold greater than that of CYP2C19, whereas the Vmax was 0.166 pmol · min−1 · pmol−1, which was approximately 33-fold lower than that observed for CYP2C19.
Fig. 3.
Contribution of individual P450s to the formation of ETR metabolites. Individual cDNA-expressed P450s (10 pmol) were incubated with 20 μM ETR for 30 min at 37°C in the presence of an NADPH-regenerating system. Metabolite formation was monitored using UPLC-MS in multiple reaction monitoring mode as described under Materials and Methods. The data are presented as the mean relative peak intensities ± S.D. for three separate experiments.
Fig. 4.
Kinetics of ETR metabolite formation by CYP3A4 and 2C19. Enzyme kinetics experiments were performed under initial rate conditions. CYP3A4 (5 pmol) was incubated with increasing concentrations of ETR (0–160 μM) to determine the rates of formation of M1 (A) and M2 (B). CYP2C19 (0.5 pmol) was incubated in the presence of ETR (0–40 μM) to measure the rate of M3 formation (C). The reactions were initiated by addition of NADPH and were allowed to proceed for 20 min at 37°C. Data are presented as means ± S.D. of three separate experiments performed in duplicate.
Fig. 5.
Effect of chemical inhibition of individual P450s in HLMs on ETR metabolite formation. HLMs (0.5 mg/ml) were incubated with 20 μM ETR for 30 min at 37°C in the presence of the following P450 inhibitors: 10 μM (+)-N-3-benzylnirvanol (CYP2C19 inhibitor), 20 μM furafylline (CYP1A2 inhibitor), 1 μM ketoconazole (CYP3A4 inhibitor), 30 μM PPP (CYP2B6 inhibitor), 1 μM quinidine (CYP2D6 inhibitor), and 20 μM sulfaphenazole (CYP2C9 inhibitor). Formation of the oxidative metabolites of ETR was then measured using UPLC-MS analysis as described under Materials and Methods. Data are presented as percentages of control sample formation (solvent alone) and represent the means ± S.D. of three separate experiments. Statistical significance was determined by performing a Student's t test. *, p < 0.05; **, p < 0.01; ***, p < 0.001.
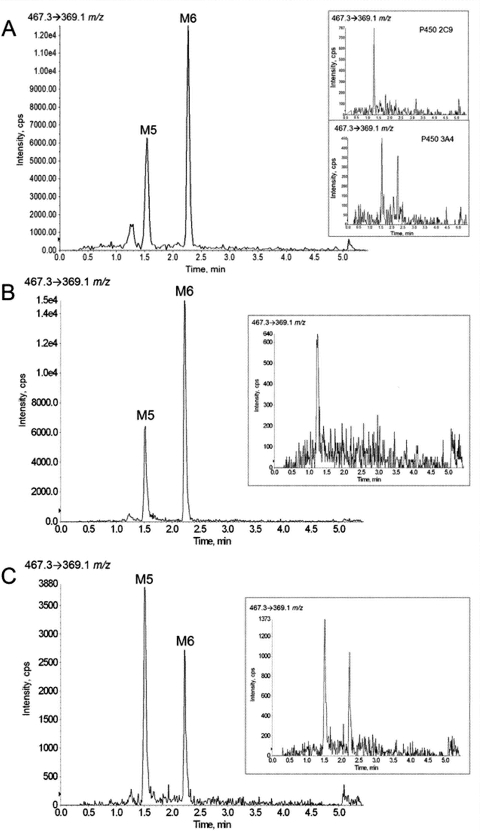
Of interest, inhibition of CYP2C9 by sulfaphenazole resulted in 52 and 62% reduction in the production of M5 and M6, respectively. The fact that inhibition of both CYP3A4 and CYP2C9 resulted in decreased formation of M5 and M6 lent support to the notion that sequential metabolism involving more than one P450 was responsible for the production of these metabolites. To test this, cDNA-expressed CYP3A4 and CYP2C9 were coincubated, and the formation of M5 and M6 was measured. As shown in Fig. 6A, although incubations with CYP3A4 or CYP2C9 alone did not result in significant M5 and M6 formation (insets), the presence of both of these P450s in a single reaction mixture was sufficient to catalyze the formation of these two dihydroxy metabolites. Of note, coincubations of CYP3A4 with CYP3A5, 2D6, or 2C19 did not lead to the production of detectable levels of M5 or M6 (data not shown). To establish the order in which CYP3A4 and CYP2C9 contribute to M5 and M6 formation, sequential incubations were performed using cDNA-expressed CYP3A4 and CYP2C9. Formation of M5 and M6 was detected, at levels comparable to those obtained in CYP3A4/CYP2C9 coincubations, when CYP3A4 was incubated with ETR and the reconstitute from this incubation then added to a reaction containing CYP2C9 (Fig. 6B). As shown in Fig. 6C, the reverse experiment did not result in comparable formation of M5 and M6. Control incubations were also performed in which the first reaction mixture lacked NADPH (Fig. 6, B and C, insets).
Fig. 6.
Coincubations and sequential incubations of cDNA-expressed CYP3A4 and CYP2C9 result in the formation of M5 and M6. ETR (20 μM) was incubated with 5 pmol of cDNA-expressed CYP3A4 and CYP2C9 for 30 min at 37°C in the presence of an NADPH-regenerating system (A). Control experiments were conducted in which ETR was incubated with either CYP3A4 or CYP2C9 alone in the presence of an NADPH-regenerating system (A, insets). For sequential incubations, CYP3A4 (5 pmol) was incubated with ETR (20 μM) in the presence of NADPH for 60 min at 37°C; these reactions were then quenched, centrifuged, dried down, and reconstituted in 5 μl of DMSO. The DMSO reconstitute (1 μl) was subsequently added to a reaction containing CYP2C9 (5 pmol) and an NADPH-regenerating system, and formation of M5 and M6 was monitored using UPLC-MS in multiple reaction monitoring mode as described under Materials and Methods (B). The reverse experiment, in which the first reaction contained CYP2C9 and the second contained CYP3A4, was also performed (C). Control experiments, in which the first reaction was incubated in the absence of NADPH, were also performed (B and C, insets).
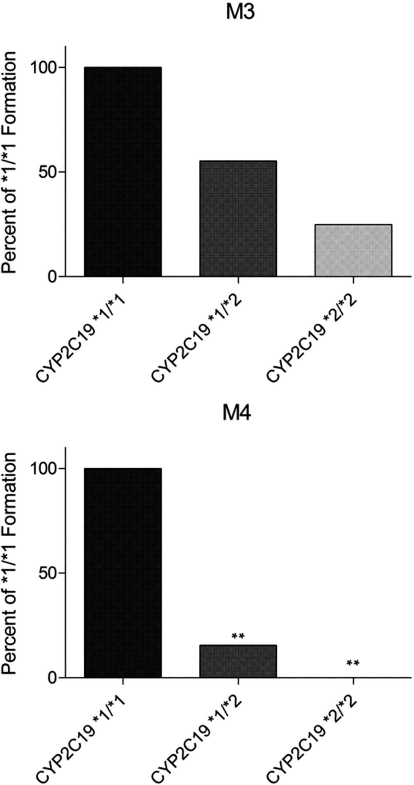
Wild-type CYP2C19 is encoded by the CYP2C19*1 allele, whereas the CYP2C19*2 allele contains a single base pair substitution (681 G>A) encoding an aberrant splice site, which ultimately results in a truncated, nonfunctional protein (de Morais et al., 1994). To confirm that CYP2C19 is primarily responsible for the formation of M3 and M4 and to gain insight into the potential variability that can occur in M3 and M4 formation between individuals, HLMs genotyped for CYP2C19 were incubated with ETR. Formation of M3 and M4 by CYP2C19*1/*2 (moderate activity) and CYP2C19*2*/2 (no activity) genotyped HLMs was calculated as a percentage of product formed by the CYP2C19*1/*1 HLMs. The CYP2C19*1/*2 HLMs formed 55.2 and 15.5% of the M3 and M4 produced by the CYP2C19*1/*1 HLMs, respectively (Fig. 7). In contrast, M4 was undetectable after incubation of ETR with the HLMs genotyped as CYP2C19*2/*2, whereas the M3 produced was 24.9% of that formed by the CYP2C19*1/*1 HLMs (Fig. 7).
Fig. 7.
Comparison of M3 and M4 formation by HLMs genotyped for CYP2C19. HLMs (0.5 mg/ml) genotyped as CYP2C19*1/*1, CYP2C19*1/*2, and CYP2C19*2/*2 were incubated with 20 μM ETR in the presence of an NADPH-regenerating system for 30 min at 37°C, and formation of M3 and M4 was measured using UPLC-MS in multiple reaction monitoring mode. Data are presented as the mean percentage of metabolite formation by CYP2C19*1/*1 HLMs. The assay was performed in triplicate. Statistical significance was determined by performing a Student's t test. **, p < 0.01.
UGT1A3 and UGT1A8 Are Responsible for Glucuronidation of a Monooxygenated Metabolite of ETR.
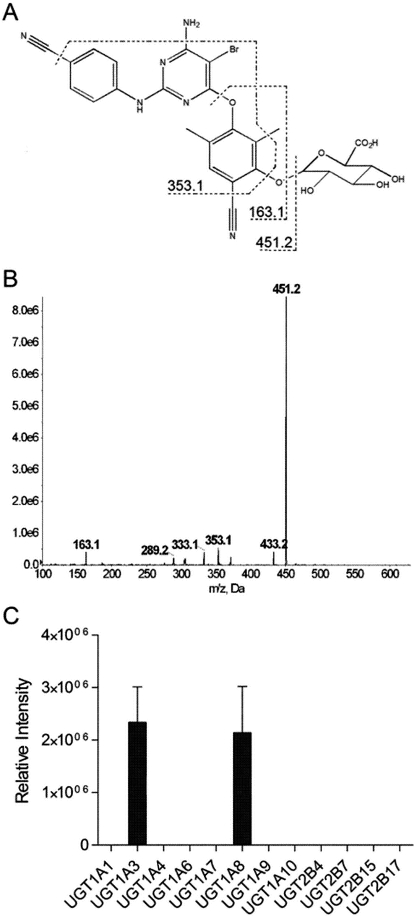
The metabolite M7 is proposed to be produced via monooxygenation of ETR followed by glucuronidation on the basis of the MS/MS spectra of M7 (Fig. 8, A and B) as well as the fact that this metabolite was detected using a Q1 → Q3 transition of 627.3 → 338.1 m/z, in which the Q1 m/z reflects the addition of oxygen and glucuronic acid to ETR. Thus, because CYP2C19 and CYP3A4 were demonstrated to be primarily involved in the formation of monohydroxy metabolites of ETR, these P450s were each coincubated with UGT1A1, 1A3, 1A4, 1A6, 1A7, 1A8, 1A9, 1A10, 2B4, 2B7, 2B15, or 2B17 in the presence of ETR to identify the UGT(s) that contribute to ETR metabolism. Of interest, no glucuronide products were detected after incubations of CYP2C19 with the individual UGTs tested. In contrast, coincubation of CYP3A4 with UGT1A3 and UGT1A8 resulted in the formation of the O-glucuronide metabolite M7 (Fig. 8C).
Fig. 8.
Glucuronidation of monohydroxylated ETR using cDNA-expressed UGTs. The proposed origins of fragment ions (A) and MS/MS spectra (B) of the O-glucuronide product M7 are shown. CYP3A4 (10 pmol) was incubated with cDNA-expressed UGT isozymes, 20 μM ETR, an NADPH-regenerating system, UDPGA, and UGT reaction mix at 37°C for 60 min. Formation of M7 was detected using UPLC-MS/MS in product ion mode (C). Data are presented as relative peak intensities and represent the means ± S.D. of three individual experiments.
ETR Modulates the Expression of Drug-Metabolizing Enzymes in a PXR-Dependent Manner.
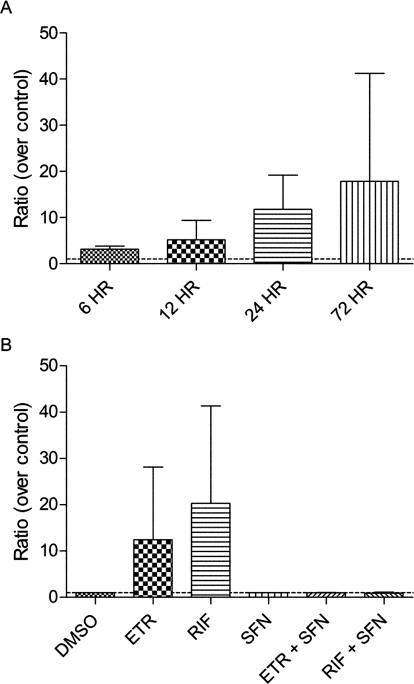
ETR has been shown to decrease the exposure to maraviroc, an antiretroviral that is a substrate of CYP3A4 (Kakuda et al., 2011), in human subjects; however, the mechanism(s) underlying this are currently unknown. Experiments were therefore performed to determine whether ETR modulates the mRNA levels of CYP3A4 using primary human hepatocytes from four donors. After treatment of primary human hepatocytes with ETR for 6, 12, 24, and 72 h, CYP3A4 mRNA expression was increased by 3.2-fold (range, 2.4- to 4.2-fold), 5.2-fold (range, 1.9- to 12.0-fold), 11.8-fold (range, 4.4- to 21.0-fold), and 17.9-fold (range, 1.3- to 58.0-fold), respectively (Fig. 9A). After 24 h of treatment with ETR, the relative amounts of metabolites formed were 0.64, 89.9, 8.45, 0.14, 0.08, and 0.08% for M1, M3, M4, M5, M6, and M7, respectively. The levels of ETR metabolites formed by these primary human hepatocytes after 72 h of ETR treatment were 17.1-fold (±17.3; M1), 1.7-fold (±0.6; M3), 0.8-fold (±0.4; M4), 7.6-fold (±3.3; M5), 3.7-fold (±1.6; M6), and 2.0-fold (±1.1; M7) those measured at 24 h. The S.D. noted above for the M1 fold change reflects a 6.0-, 3.8-, and 41.5-fold increase in M1 abundance using three separate hepatocyte preparations. In contrast to what was observed using HLMs, M2 was not detected in the primary human hepatocyte assays.
Fig. 9.
Time-dependent induction of CYP3A4 mRNA in ETR-treated primary human hepatocytes is PXR-dependent. Primary human hepatocytes were treated with 10 μM ETR or DMSO (control) for 6, 12, 24, or 72 h, and changes in P450 mRNA expression were quantified by qPCR normalizing to GAPDH. Data are presented as ratios over DMSO controls and represent treatments performed in four separate hepatocytes preparations (A). Primary human hepatocytes were treated with DMSO, ETR (10 μM), or RIF (10 μM) in the presence and absence of the PXR antagonist SFN (25 μM). RIF, an established PXR-dependent CYP3A4 inducer, was used as a positive control. Data were obtained using qPCR and are presented as ratios over control, representing the means ± S.D. of treatments performed in three separate hepatocytes preparations (B).
Because the orphan nuclear receptor PXR is a well established transcriptional regulator of CYP3A4 and prototypical inducers of CYP3A4 mRNA expression such as RIF and ritonavir exert their effects through activation of PXR (Luo et al., 2002), involvement of this transcription factor in the observed increase in CYP3A4 mRNA levels was tested using the PXR antagonist SFN. Primary human hepatocytes were treated with ETR or vehicle in the presence or absence of SFN for 24 h. The PXR-dependent inducer of CYP3A4 mRNA expression, RIF, was used as a positive control. The presence of the PXR antagonist SFN abrogated the ETR-mediated increase in CYP3A4 mRNA levels such that the mRNA levels of CYP3A4 after ETR treatment were not increased significantly above vehicle-treated control levels (Fig. 9B). SFN inhibited the ETR-mediated increases in CYP3A4 mRNA levels at 6 and 12 h as well (data not shown). Furthermore, the RIF-mediated elevation of CYP3A4 mRNA abundance was also blocked by the presence of SFN, confirming the antagonism of PXR by SFN (Fig. 9B). Because CYP2C19 and CYP2C9 play a role in the metabolism of ETR, the effects of this compound on the expression of these P450s were also monitored. Unfortunately, primers to specifically differentiate between CYP2C9 and CYP2C19 mRNA could not be obtained because of high sequence homology. However, with the use of primers that recognize both CYP2C19 and CYP2C9, a significant effect on the expression of these mRNAs was not observed after treatment of primary human hepatocytes with ETR for 6, 12, 24, or 72 h (data not shown).
Discussion
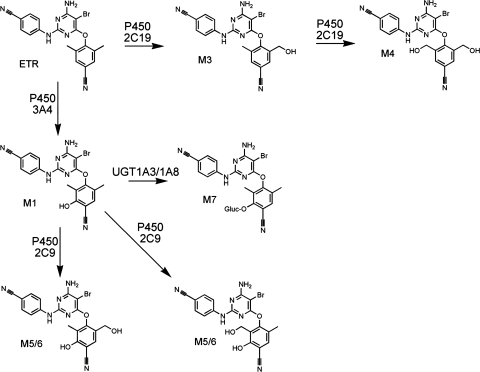
The studies presented here detail the routes of ETR metabolism (Fig. 10) while also demonstrating for the first time that ETR increases the abundance of CYP3A4 mRNA in a PXR-dependent manner. Therefore, drugs that are known substrates of CYP3A4 may be metabolized more readily in patients taking ETR concomitantly as part of their HIV treatment regimen. Indeed, it has already been demonstrated that in vivo exposure to maraviroc, a chemokine C-C motif receptor antagonist that is metabolized primarily by CYP3A4, and to dolutegravir, an integrase inhibitor, is decreased when coadministered with ETR (Kakuda et al., 2011; Song et al., 2011). Furthermore, a drug-drug interaction has been identified between ETR and omeprazole, which is a proton pump inhibitor that is often administered with antiretrovirals to combat the gastrointestinal side effects that are associated with highly active antiretroviral therapy regimens. The investigators in that study found that coadministration of ETR with omeprazole, which inhibits CYP2C19 activity, resulted in 41% greater ETR exposure in HIV-negative adults (Schöller-Gyüre et al., 2008). Therefore, our findings that ETR increases the mRNA expression of CYP3A4 and that CYP2C19 is principally responsible for the formation of the primary monohydroxy and dihydroxy metabolites of ETR provide a mechanistic basis for understanding these interactions. In addition, the fact that ETR-mediated activation of CYP3A4 mRNA expression was demonstrated to be PXR-dependent suggests that ETR may have the ability to modulate the expression of other contributors to drug metabolism including CYP2B6, UGT1A1, and P-glycoprotein that are also transcriptionally regulated by PXR (Willson and Kliewer, 2002; Wang and LeCluyse, 2003; Tolson et al., 2009). Thus, data obtained in the present study may be useful in making inferences about potential drug-drug interactions involving ETR.
Fig. 10.
Proposed mechanism of ETR metabolism.
Assays performed using both HLMs and primary human hepatocytes facilitated the identification of seven metabolites of ETR. Of interest, all of the products that were detected in this study involved metabolism of the dimethylbenzonitrile ring of ETR, whereas no metabolism of the cyanophenyl ring of the molecule was observed. With the exception of M2, which was undetectable after incubation of ETR with primary human hepatocytes, metabolite formation was consistent between both in vitro systems. Although the reason that M2 was not detected in the assays using primary human hepatocytes is currently unclear, studies are underway to investigate the possibility that this metabolite is further metabolized in primary human hepatocytes via a reaction that is not catalyzed by HLMs. This metabolite, along with M1, was found to be formed by CYP3A4 and CYP3A5. A CYP3A4-dependent metabolite of ETR subsequently was a substrate for UGT1A3 and UGT1A8. Although only one glucuronide product was detected, because M1 and M2 have nearly identical fragmentation patterns, it was not possible to determine which of these metabolites undergoes glucuronidation by UGT1A3 and UGT1A8 to form M7.
Of note, M3 and M4 were the two most abundant metabolites formed using both HLMs and primary human hepatocytes; according to the package insert for etravirine (Tibotec, Inc., 2011), these most prominent metabolites possess less than 10% of the activity of etravirine itself against HIV-1 in cell culture. Direct hydroxylation of the methyl groups of the dimethylbenzonitrile moiety appeared to be carried out almost exclusively by CYP2C19 because this enzyme catalyzed the formation of both the monomethylhydroxylated (M3) and dimethylhydroxylated (M4) products. However, in the liver microsomal chemical inhibition experiments, the presence of ketoconazole, which was used as a CYP3A4 inhibitor, decreased the formation of these metabolites by approximately 50%, raising the possibility that CYP3A4 could have the ability to catalyze these reactions. Although ketoconazole is frequently used to probe CYP3A4 activity through the inhibition of this enzyme, it has been shown previously that ketoconazole also inhibits CYP2C19-dependent (S)-mephenytoin metabolism, with a Ki value of 0.239 μM (Foti and Wahlstrom, 2008); indeed, experiments performed in our laboratory using the CYP2C19 probe substrate omeprazole indicate that the presence of ketoconazole markedly reduces the formation of 5-hydroxyomeprazole by HLMs (data not shown). Moreover, using cDNA-expressed CYP2C19, we demonstrated that ketoconazole significantly inhibits the formation of M3 and M4 by this enzyme. Enzyme kinetics experiments performed using both CYP2C19 and CYP3A4 strongly suggested that CYP2C19 has a higher affinity for ETR with regard to M3 formation and a greater capacity to metabolize ETR to M3. Together, these data indicate that ketoconazole does not specifically inhibit CYP3A4-dependent ETR metabolism and that CYP3A4 does not significantly contribute to M3 and M4 formation. Furthermore, it was demonstrated that ETR increases the mRNA levels of CYP3A4 in a time-dependent manner, whereas no ETR-mediated effect on CYP2C mRNA expression was observed. In agreement with this, the formation of metabolites M1, M5, and M6 by primary human hepatocytes was increased after 72 h of treatment compared with the 24-h treatments. In contrast, the abundance of metabolites M3 and M4, which were determined to be primarily produced by CYP2C19, did not increase, lending support to the reaction phenotyping data obtained using cDNA-expressed P450s and HLMs.
In addition, inhibition of CYP2C19 by (+)-N-3-benzylnirvanol did not completely block M3 and M4 formation, which indicated either that other P450s may catalyze the formation of these metabolites in addition to CYP2C19 or that (+)-N-3-benzylnirvanol did not completely inhibit the enzymatic activity of CYP2C19 toward ETR. To reconcile this result, the formation of M3 and M4 was measured using HLMs that did not express functional CYP2C19. To do this, HLMs that were genotyped for the loss-of-function CYP2C19*2 allele, which contains a cryptic splice site that results in a truncated nonfunctional protein, were used (de Morais et al., 1994). Because the formation of M3 and M4 by these liver microsomes was markedly reduced or undetectable, respectively, an integral role for CYP2C19 in the production of these metabolites was confirmed. However, it appears that only M4 may be formed exclusively by CYP2C19. Thus, this dimethylhydroxy metabolite of ETR may represent a novel marker that can be used to probe CYP2C19 catalytic activity. In addition, these data suggest that CYP2C19 genetic polymorphisms may affect the pharmacokinetics of ETR in vivo. Indeed, several polymorphisms exist for the CYP2C19 allele, including the CYP2C19*3 allele, which also encodes a nonfunctional protein product (Ozawa et al., 2004).
Of the three dihydroxy metabolites that were identified during our study, only M4 was initially detected after incubation of ETR with the cDNA-expressed P450s, whereas M5 and M6 were not. The fragmentation patterns of M5 and M6 were similar although these metabolites were readily separated chromatographically. A plausible explanation for this result is that one of these metabolites is produced via oxygen insertion at the position in the benzonitrile ring that is meta to the hydroxylated methyl group, whereas the other is formed via oxygenation of the benzonitrile ring at the position that is para to the hydroxylated methyl group. To identify the P450s involved in the catalysis of M5 and M6, studies were performed using a number of P450 inhibitors, namely, (+)-N-3-benzylnirvanol (CYP2C19 inhibitor), furafylline (CYP1A2 inhibitor), ketoconazole (CYP3A4 inhibitor), sulfaphenazole (CYP2C9 inhibitor), PPP (CYP2B6 inhibitor), and quinidine (CYP2D6 inhibitor). Of interest, ketoconazole abrogated the formation of M5 and M6, suggesting that CYP3A4 plays a role in formation of these dihydroxy metabolites. Furthermore, the presence of the CYP2C9 inhibitor sulfaphenazole also decreased the formation of M5 and M6, indicating that these two P450s may act in concert to metabolize ETR to M5 and M6. This was demonstrated definitively via coincubation of CYP2C9 and CYP3A4 in the presence of ETR. Of interest, although tandem mass spectra indicated that M5 and M6 involve methylhydroxylation of ETR, CYP2C19 was not shown to be involved in the production of these metabolites even though this P450 was primarily responsible for the formation of the monomethylhydroxylated and dimethylhydroxylated metabolites M3 and M4. Further studies will be performed to probe whether oxygenation of the benzonitrile ring of ETR affects the ability of this molecule to bind to CYP2C19, thereby preventing the participation of this enzyme in the formation of M5 and M6.
In summary, the present study provides a comprehensive analysis of the in vitro biotransformation of ETR as well as the autoinduction of ETR metabolism via up-regulation of CYP3A4 mRNA. Because ETR is only prescribed as part of combination therapy to treat HIV, a mechanistic understanding of the routes of ETR metabolism and pathways that may be modulated by ETR is essential for predicting potential drug-drug interactions. Finally, because our data indicate that the dimethylhydroxy metabolite of ETR is formed exclusively by CYP2C19, this metabolite may be a useful tool for probing CYP2C19 catalytic activity.
This work was supported by the PhRMA Foundation (Research Starter Grant in Pharmacology/Toxicology; to N.N.B.). The AB SCIEX QTRAP 5500 mass spectrometer was purchased using a grant from the National Institutes of Health National Center for Research Resources [Grant 1S10-RR27733]; the Waters Acquity ultraperformance liquid chromatograph interfaced with the AB SCIEX QTRAP 5500 mass spectrometer was purchased with funds provided by the Pendleton Foundation Trust.
Article, publication date, and citation information can be found at http://dmd.aspetjournals.org.
- HIV
- human immunodeficiency virus
- NNRTI
- non-nucleoside reverse transcriptase inhibitor
- ETR
- etravirine
- P450
- cytochrome P450
- UGT
- UDP-glucuronosyltransferase
- HLM
- human liver microsomes
- PXR
- pregnane X receptor
- PPP
- 2-phenyl-2-(1-piperidinyl)propane
- SFN
- sulforaphane
- RIF
- rifampin
- UDPGA
- UDP-glucuronic acid
- UPLC-MS
- ultraperformance liquid chromatography-mass spectrometry
- DMSO
- dimethyl sulfoxide
- TIS
- TurboIonSpray
- MS/MS
- tandem mass spectrometry
- PCR
- polymerase chain reaction
- qPCR
- quantitative polymerase chain reaction
- GAPDH
- glyceraldehyde-3-phosphate dehydrogenase.
Authorship Contributions
Participated in research design: Yanakakis and Bumpus.
Conducted experiments: Yanakakis.
Performed data analysis: Yanakakis and Bumpus.
Wrote or contributed to the writing of the manuscript: Yanakakis and Bumpus.
References
- Andries K, Azijn H, Thielemans T, Ludovici D, Kukla M, Heeres J, Janssen P, De Corte B, Vingerhoets J, Pauwels R, et al. (2004) TMC125, a novel next-generation nonnucleoside reverse transcriptase inhibitor active against nonnucleoside reverse transcriptase inhibitor-resistant human immunodeficiency virus type 1. Antimicrob Agents Chemother 48:4680–4686 [DOI] [PMC free article] [PubMed] [Google Scholar]
- Calcagno A, Nozza S, Bonora S, Castagna A, Gonzalez de Requena D, D'Avolio A, Lazzarin A, Di Perri G. (2011) Pharmacokinetics of the raltegravir/maraviroc/etravirine combination. J Antimicrob Chemother 66:1932–1934 [DOI] [PubMed] [Google Scholar]
- de Morais SM, Wilkinson GR, Blaisdell J, Nakamura K, Meyer UA, Goldstein JA. (1994) The major genetic defect responsible for the polymorphism of S-mephenytoin metabolism in humans. J Biol Chem 269:15419–15422 [PubMed] [Google Scholar]
- Foti RS, Wahlstrom JL. (2008) CYP2C19 inhibition: the impact of substrate probe selection on in vitro inhibition profiles. Drug Metab Dispos 36:523–528 [DOI] [PubMed] [Google Scholar]
- Gallant JE, Staszewski S, Pozniak AL, DeJesus E, Suleiman JM, Miller MD, Coakley DF, Lu B, Toole JJ, Cheng AK, et al. (2004) Efficacy and safety of tenofovir DF vs stavudine in combination therapy in antiretroviral-naive patients: a 3-year randomized trial. JAMA 292:191–201 [DOI] [PubMed] [Google Scholar]
- Götte M, Li X, Wainberg MA. (1999) HIV-1 reverse transcription: a brief overview focused on structure-function relationships among molecules involved in initiation of the reaction. Arch Biochem Biophys 365:199–210 [DOI] [PubMed] [Google Scholar]
- Gulick RM, Ribaudo HJ, Shikuma CM, Lalama C, Schackman BR, Meyer WA, 3rd, Acosta EP, Schouten J, Squires KE, Pilcher CD, et al. (2006) Three- vs four-drug antiretroviral regimens for the initial treatment of HIV-1 infection: a randomized controlled trial. JAMA 296:769–781 [DOI] [PubMed] [Google Scholar]
- Gupta S, Vingerhoets J, Fransen S, Tambuyzer L, Azijn H, Frantzell A, Paredes R, Coakley E, Nijs S, Clotet B, et al. (2011) Connection domain mutations in HIV-1 reverse transcriptase do not impact etravirine susceptibility and virologic responses to etravirine-containing regimens. Antimicrob Agents Chemother 55:2872–2879 [DOI] [PMC free article] [PubMed] [Google Scholar]
- Hyland R, Dickins M, Collins C, Jones H, Jones B. (2008) Maraviroc: in vitro assessment of drug-drug interaction potential. Br J Clin Pharmacol 66:498–507 [DOI] [PMC free article] [PubMed] [Google Scholar]
- Kakuda TN, Abel S, Davis J, Hamlin J, Schöller-Gyüre M, Mack R, Ndongo N, Petit W, Ridgway C, Sekar V, et al. (2011) Pharmacokinetic interactions of maraviroc with darunavir-ritonavir, etravirine, and etravirine-darunavir-ritonavir in healthy volunteers: results of two drug interaction trials. Antimicrob Agents Chemother 55:2290–2296 [DOI] [PMC free article] [PubMed] [Google Scholar]
- Kakuda TN, Wade JR, Snoeck E, Vis P, Schöller-Gyüre M, Peeters MP, Corbett C, Nijs S, Vingerhoets J, Leopold L, et al. (2010) Pharmacokinetics and pharmacodynamics of the non-nucleoside reverse-transcriptase inhibitor etravirine in treatment-experienced HIV-1-infected patients. Clin Pharmacol Ther 88:695–703 [DOI] [PubMed] [Google Scholar]
- Lazzarin A, Campbell T, Clotet B, Johnson M, Katlama C, Moll A, Towner W, Trottier B, Peeters M, Vingerhoets J, et al. (2007) Efficacy and safety of TMC125 (etravirine) in treatment-experienced HIV-1-infected patients in DUET-2: 24-week results from a randomised, double-blind, placebo-controlled trial. Lancet 370:39–48 [DOI] [PubMed] [Google Scholar]
- Luo G, Cunningham M, Kim S, Burn T, Lin J, Sinz M, Hamilton G, Rizzo C, Jolley S, Gilbert D, et al. (2002) CYP3A4 induction by drugs: correlation between a pregnane X receptor reporter gene assay and CYP3A4 expression in human hepatocytes. Drug Metab Dispos 30:795–804 [DOI] [PubMed] [Google Scholar]
- Madruga JV, Cahn P, Grinsztejn B, Haubrich R, Lalezari J, Mills A, Pialoux G, Wilkin T, Peeters M, Vingerhoets J, et al. (2007) Efficacy and safety of TMC125 (etravirine) in treatment-experienced HIV-1-infected patients in DUET-1: 24-week results from a randomised, double-blind, placebo-controlled trial. Lancet 370:29–38 [DOI] [PubMed] [Google Scholar]
- Nadler JP, Berger DS, Blick G, Cimoch PJ, Cohen CJ, Greenberg RN, Hicks CB, Hoetelmans RM, Iveson KJ, Jayaweera DS, et al. (2007) Efficacy and safety of etravirine (TMC125) in patients with highly resistant HIV-1: primary 24-week analysis. AIDS 21:F1–F10 [DOI] [PubMed] [Google Scholar]
- Ozawa S, Soyama A, Saeki M, Fukushima-Uesaka H, Itoda M, Koyano S, Sai K, Ohno Y, Saito Y, Sawada J. (2004) Ethnic differences in genetic polymorphisms of CYP2D6, CYP2C19, CYP3As and MDR1/ABCB1. Drug Metab Pharmacokinet 19:83–95 [DOI] [PubMed] [Google Scholar]
- Parniak MA, Sluis-Cremer N. (2000) Inhibitors of HIV-1 reverse transcriptase. Adv Pharmacol 49:67–109 [DOI] [PubMed] [Google Scholar]
- Picchio G, Vingerhoets J, Tambuyzer L, Coakley E, Haddad M, Witek J. (2011) Short communication: prevalence of susceptibility to etravirine by genotype and phenotype in samples received for routine HIV type 1 resistance testing in the United States. AIDS Res Hum Retroviruses 27:1271–1275 [DOI] [PubMed] [Google Scholar]
- Riddler SA, Haubrich R, DiRienzo AG, Peeples L, Powderly WG, Klingman KL, Garren KW, George T, Rooney JF, Brizz B, et al. (2008) Class-sparing regimens for initial treatment of HIV-1 infection. N Engl J Med 358:2095–2106 [DOI] [PMC free article] [PubMed] [Google Scholar]
- Schöller-Gyüre M, Kakuda TN, De Smedt G, Vanaken H, Bouche MP, Peeters M, Woodfall B, Hoetelmans RM. (2008) A pharmacokinetic study of etravirine (TMC125) co-administered with ranitidine and omeprazole in HIV-negative volunteers. Br J Clin Pharmacol 66:508–516 [DOI] [PMC free article] [PubMed] [Google Scholar]
- Schöller-Gyüre M, Kakuda TN, Raoof A, De Smedt G, Hoetelmans RM. (2009) Clinical pharmacokinetics and pharmacodynamics of etravirine. Clin Pharmacokinet 48:561–574 [DOI] [PubMed] [Google Scholar]
- Song I, Borland J, Min S, Lou Y, Chen S, Patel P, Wajima T, Piscitelli SC. (2011) Effects of etravirine alone and with ritonavir-boosted protease inhibitors on the pharmacokinetics of dolutegravir. Antimicrob Agents Chemother 55:3517–3521 [DOI] [PMC free article] [PubMed] [Google Scholar]
- Squires K, Lazzarin A, Gatell JM, Powderly WG, Pokrovskiy V, Delfraissy JF, Jemsek J, Rivero A, Rozenbaum W, Schrader S, et al. (2004) Comparison of once-daily atazanavir with efavirenz, each in combination with fixed-dose zidovudine and lamivudine, as initial therapy for patients infected with HIV. J Acquir Immune Defic Syndr 36:1011–1019 [DOI] [PubMed] [Google Scholar]
- Staszewski S, Morales-Ramirez J, Tashima KT, Rachlis A, Skiest D, Stanford J, Stryker R, Johnson P, Labriola DF, Farina D, et al. (1999) Efavirenz plus zidovudine and lamivudine, efavirenz plus indinavir, and indinavir plus zidovudine and lamivudine in the treatment of HIV-1 infection in adults. Study 006 Team. N Engl J Med 341:1865–1873 [DOI] [PubMed] [Google Scholar]
- Suzuki H, Kneller MB, Haining RL, Trager WF, Rettie AE. (2002) (+)-N-3-Benzyl-nirvanol and (−)-N-3-benzyl-phenobarbital: new potent and selective in vitro inhibitors of CYP2C19. Drug Metab Dispos 30:235–239 [DOI] [PubMed] [Google Scholar]
- Tibotec, Inc. (2011) Intelence (etravirine) full prescribing information. Tibotec, Inc., Beerse, Belgium [Google Scholar]
- Tolson AH, Li H, Eddington ND, Wang H. (2009) Methadone induces the expression of hepatic drug-metabolizing enzymes through the activation of pregnane X receptor and constitutive androstane receptor. Drug Metab Dispos 37:1887–1894 [DOI] [PMC free article] [PubMed] [Google Scholar]
- Vingerhoets J, Azijn H, Fransen E, De Baere I, Smeulders L, Jochmans D, Andries K, Pauwels R, de Béthune MP. (2005) TMC125 displays a high genetic barrier to the development of resistance: evidence from in vitro selection experiments. J Virol 79:12773–12782 [DOI] [PMC free article] [PubMed] [Google Scholar]
- Walsky RL, Obach RS. (2007) A comparison of 2-phenyl-2-(1-piperidinyl)propane (ppp), 1,1′,1"-phosphinothioylidynetrisaziridine (thioTEPA), clopidogrel, and ticlopidine as selective inactivators of human cytochrome P450 2B6. Drug Metab Dispos 35:2053–2059 [DOI] [PubMed] [Google Scholar]
- Wang H, LeCluyse EL. (2003) Role of orphan nuclear receptors in the regulation of drug-metabolising enzymes. Clin Pharmacokinet 42:1331–1357 [DOI] [PubMed] [Google Scholar]
- Ward BA, Gorski JC, Jones DR, Hall SD, Flockhart DA, Desta Z. (2003) The cytochrome P450 2B6 (CYP2B6) is the main catalyst of efavirenz primary and secondary metabolism: implication for HIV/AIDS therapy and utility of efavirenz as a substrate marker of CYP2B6 catalytic activity. J Pharmacol Exp Ther 306:287–300 [DOI] [PubMed] [Google Scholar]
- Willson TM, Kliewer SA. (2002) PXR, CAR and drug metabolism. Nat Rev Drug Discov 1:259–266 [DOI] [PubMed] [Google Scholar]
- Zhou C, Poulton EJ, Grün F, Bammler TK, Blumberg B, Thummel KE, Eaton DL. (2007) The dietary isothiocyanate sulforaphane is an antagonist of the human steroid and xenobiotic nuclear receptor. Mol Pharmacol 71:220–229 [DOI] [PubMed] [Google Scholar]


