

Abstract
In this report we demonstrate a hemodynamic scaling method with resting‐state fluctuation of amplitude (RSFA) in healthy adult younger and older subject groups. We show that RSFA correlated with breath hold (BH) responses throughout the brain in groups of younger and older subjects which RSFA and BH performed comparably in accounting for age‐related hemodynamic coupling changes, and yielded more veridical estimates of age‐related differences in task‐related neural activity. BOLD data from younger and older adults performing motor and cognitive tasks were scaled using RSFA and BH related signal changes. Scaling with RSFA and BH reduced the skew of the BOLD response amplitude distribution in each subject and reduced mean BOLD amplitude and variability in both age groups. Statistically significant differences in intrasubject amplitude variation across regions of activated cortex, and intersubject amplitude variation in regions of activated cortex were observed between younger and older subject groups. Intra‐ and intersubject variability differences were mitigated after scaling. RSFA, though similar to BH in minimizing skew in the unscaled BOLD amplitude distribution, attenuated the neural activity‐related BOLD amplitude significantly less than BH. The amplitude and spatial extent of group activation were lower in the older than in the younger group before and after scaling. After accounting for vascular variability differences through scaling, age‐related decreases in activation volume were observed during the motor and cognitive tasks. The results suggest that RSFA‐scaled data yield age‐related neural activity differences during task performance with negligible effects from non‐neural (i.e., vascular) sources. Hum Brain Mapp, 2011. © 2010 Wiley‐Liss, Inc.
Keywords: breath hold, BOLD, CBF, cognitive, fMRI, hypercapnia, motor, variability
INTRODUCTION
Age‐related changes in cerebrovascular physiology affect coupling between neural activity and (non‐neural) vascular reactivity reflected in the blood‐oxygen‐level‐dependent (BOLD) response that is measured in functional magnetic resonance imaging (fMRI). A significant literature showing that accuracy of BOLD signal measurement is adversely affected by age‐related cerebral vascular changes has accumulated over time [e.g., D'Esposito et al.,1999; Huettel et al.,2001; Riecker et al.,2003; Ross et al.,1997; Taoka et al.,1998]. Most fMRI studies of aging have summarily overlooked this evidence, analyzing data from younger and older adults with common regressors and without any subject or group‐specific scaling factors that could account for age‐related vascular influences. Older adults have lower resting CBF [Bentourkia et al.,2000; Leenders et al.,1990] and larger intersubject hemodynamic variability [Aizenstein et al.,2006; D'Esposito et al.,1999; Huttel et al.,2001; Samanez‐Larkin and D'Esposito,2008]. These age‐related differences in cerebrovascular conditions can exacerbate task‐induced BOLD signal variability in older samples [Kannurpatti et al.,2010]. Some researchers have used subject‐specific regressors to account for age‐related hemodynamic changes [Rypma and D'Esposito,2000,2001; Rypma et al.,2005,2007]. This method has required the assumption of regional HRF equivalence, one that is demonstrably unsafe [Maccotta and Buckner,2004]. In order to accurately assess age‐related differences in neural activity using fMRI, it is necessary to minimize the influence of the non‐neural component generally referred to as the vascular component.
Affording practical advantages over breathing CO2, breath hold (BH) has been a useful standard for evaluating vasomotor capacity in fMRI studies and has been investigated across a wide age range in humans [Kastrup et al.,1998,1999; Riecker et al.,2003; Thomason et al.,2005], and in animals [Kannurpatti et al.,2002]. BH has been recently used as a hypercapnic hemodynamic scaling variable to eliminate intersubject variability [Biswal et al.,2007; Handwerker et al.,2007; Thomason et al.,2007]. However, subject compliance issues related to, for example, individual differences in inspiration extent and lung capacity, and neural confounds related to air hunger in the hypercapnic BH task can adversely affect accurate derivation of a hypercapnic scaling factor, especially in patients and older adults [Banzett et al.,2000; Brannan et al.,2001; Cohen et al.,2004; Corfield et al.,1995; Evans et al.,2002; Liotti et al.,2001; Parsons et al.,2001].
Our studies of non‐neural influences on the resting‐state fMRI signal indicated strong amplitude and spatial correlation of the low frequency BOLD fluctuation with hypercapnic BH response [Biswal et al.,2007]. These results were supported by an earlier finding that resting‐state BOLD signal fluctuations in low frequencies are sensitive to systemic fluctuations in CO2, an indicator of vascular sensitivity [Wise et al., 2004]. Thus, this correlation occurs because subject‐specific vascular sensitivity information is contained in the resting‐state BOLD fluctuation amplitude (RSFA), available from a simple resting‐state fMRI scan [Kannurpatti and Biswal,2008]. Hence an important application of hemodynamic scaling using RSFA would be to explore neural activity differences between younger and older populations independent of non‐neural vascular activity. The purpose of the present study is validation of this method by critically assessing its performance against BH. BOLD signal change in activated regions in response to task‐related neural activity was determined by conventional statistical parametric mapping in younger and older groups. In order to determine the extent of BOLD signal change due to neural activity while minimizing influences of age‐related vascular differences, BOLD responses from the activated regions were scaled using RSFA and compared with BH. Subsequently, a model free detection method was used to obtain the task‐induced activation maps before and after scaling to determine the effects of scaling on activation. Scaling was performed on data from two different tasks to investigate the effect in different cortical systems. The first task was a simple “motor” task, in which subjects serially touched the thumb of each hand to each finger. This task was performed without any difficulty by both age groups. The second task was a “cognitive” task in which, on each trial, subjects were required to report whether or not a probe digit‐symbol pair also appeared in a simultaneously presented digit‐symbol table that appeared just above the probe. This task is known to elicit age‐differential performance [e.g., Erber et al.,1981; Joy et al.,2000; Motes and Rypma,2009; Salthouse,1992]. Our primary results were that (1) task‐induced BOLD signal amplitude changes were spatially more variable within the activated regions in younger when compared with older subjects, (2) mean task‐induced BOLD signal amplitude in activated voxels varied to a lesser extent between younger subjects when compared with older, (3) scaling with RSFA and BH reduced the intra‐ and intersubject variability to similar levels despite age‐related variability differences in unscaled BOLD signals between the two groups, (4) RSFA mitigated vascular influences on BOLD signal variability in a manner and extent similar to BH after scaling, but attenuated the BOLD response amplitude significantly less than BH, and (5) smaller group activation volume in the older subjects during both tasks persisted after scaling, indicating task‐induced neural activation differences with normal aging.
METHOD
Subjects
Twelve younger healthy subjects (6 males and 6 females; mean age, 24 years; range, 19–27 years) and 12 older healthy subjects (5 males and 7 females; mean age, 58 years; range, 55–71 years) with no history of head trauma and neurological diseases were scanned. All experimental procedures were approved by the Institutional Review Board of the University of Texas at Dallas. Written informed consent was obtained from all subjects and paid on an hourly basis during the study.
Experimental Tasks
Each subject performed a BH, bilateral fingertapping (FTAP), and Digit‐Symbol Substitution task (DSST) paradigm. Resting‐state fMRI scans were also obtained for all the subjects.
Breath hold (BH)
The BH experiment consisted of a 40‐s rest period (normal breathing) followed by three repetitions of alternate epochs of 20 s of end‐tidal inspirational BH and 40 s of normal breathing [Biswal et al.,2007; Kannurpatti et al.,2002]. Subjects were trained on the BH technique before the actual scanning session and advised to avoid inhalation of larger than normal volume of air before BH. A white circle remained centered on the screen during the normal respiration periods, and to signal the breath‐hold periods, the circle changed color to cyan and began flashing at 0.5 Hz. Participants were instructed to take a normal breath when the circle changed colors and began flashing and to hold the breath until the circle stopped flashing.
Bilateral fingertapping (FTAP)
A white circle remained centered on the screen during the rest periods, and to signal the finger‐tapping periods, the circle changed color to cyan and began flashing at 0.5 Hz. Participants sequentially touched each finger of each hand to its respective thumb making one touch and release, as best they could, in synchrony with the flashing circle. Subjects repetitively performed the sequence 1‐2‐3‐4 where the numbers represented the little, ring, middle, and index fingers, respectively. The FTAP paradigm consisted of an initial 10‐s rest period followed by four repetitions of alternate epochs of 20‐s of bilateral fingertapping and 20‐s of rest. There was no group specific inability to maintain the minimal performance rate.
Digit symbol substitution (DSST)
Adapted from the Wechsler Adult Intelligence Scale, [Wechsler,1981] the modified Digit Symbol Substitution (DSST) task consisted of a code table that represents pairings of digits and nonsense symbols. The code table containing digit‐symbol pairs and a single digit‐symbol probe was projected simultaneously on a screen for 4 s viewed by subjects inside the MR‐scanner [Rypma et al.,2006]. If the probe‐pair matched one of those in the table, subjects pressed a right‐thumb button; otherwise, they pressed a left‐thumb button. There was a total of 52 trials in a single scanning run. On half the trials, the probe‐pair matched one of the digit‐symbol pairs in the code table, on the other half, the probe‐pair did not match one of the pairs in the code table. The stimuli stayed on the screen for 4 s followed by variable inter‐trial intervals of 0, 4, 8, or 12 s. Figure 1 shows a schematic of the DSST task.
Figure 1.
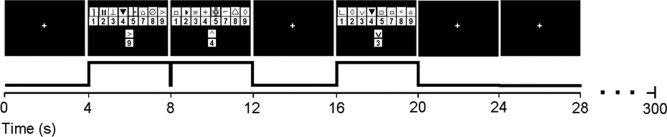
Schematic of the DSST task paradigm. A digit‐symbol key and a digit‐symbol probe appearing simultaneously for 4 s in each trial. The trials were jittered with 4‐s periods of rest.
Resting‐state
Subjects remained relaxed with their eyes closed during the acquisition of the resting‐state MR images.
MRI Acquisition
MR Imaging was performed on a Philips Achieva 3T scanner equipped with an 8‐element, SENSE, receive‐only head coil and a fixed asymmetric head gradient coil. Subjects were positioned supine on the gantry with head in a midline location in the coil. Foam padding and a pillow were used to minimize head motion. High‐resolution anatomical images were obtained using an MPRAGE sequence with 1 mm isovoxel; sagittal; TE = 3.7 ms and flip angle = 12°. Gradient echo‐EPI images were subsequently obtained during rest, BH, FTAP and the DSST task. 32 slices were obtained in the axial plane covering the entire brain. Imaging parameters were: FOV of 220 mm, 64 × 64 matrix, TR/TE = 2000/30 msec and slice thickness of 4 mm; 120, 110, 150, and 90 EPI images were obtained during each of rest, BH, DSST, and FTAP tasks, respectively. Imaging parameters remained the same for all four runs.
Data Analysis
All fMRI data sets were preprocessed using AFNI [Cox,1996]. The EPI images were corrected for motion using a rigid‐body volume registration algorithm available in AFNI. The motion correction algorithm calculated motion in six directions of rotation and translation throughout each run. The maximal displacement (D) was computed after considering motion in all six directions to obtain a single D value for each volume [Jiang et al.,1995]. EPI data sets with D > 2 mm were omitted from further analysis. All the data sets were detrended to remove quadratic trends and statistical analysis was performed only on the voxels that represented brain tissue after masking out nonbrain structures. Data from one older subject was not considered for further analysis due to excessive head motion and the resting‐state data from one young subject was corrupted. MR saturation effects at the beginning of the scan were accounted for by eliminating the first four images in all calculations.
Hemodynamic scaling of task‐induced response
Definition of measured and estimated parameters for every voxel:
-
i
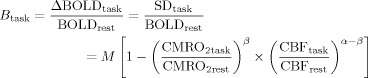
Standard deviation (SD) estimated from the respective time series are defined as BOLD signal response amplitude (ΔBOLD). For the motor and cognitive tasks ΔBOLDtask = SDtask, for BH ΔBOLDBH = SDBH, for the resting‐state ΔBOLDrest = SDrest, i.e., RSFA (depicted in Appendix, Fig. A1).
-
ii
BOLD signal change before scaling, (i.e., the percent change) for every voxel was obtained using the function 3dfim in AFNI [Cox,1996]. For the motor and cognitive tasks this parameter is B task = ΔBOLDtask/BOLDrest, for BH B BH = ΔBOLDBH/BOLDrest and for the resting‐state B rest = ΔBOLDrest/BOLDrest. Where BOLDrest is the mean resting‐state BOLD signal before and between task presentation accounted by the resting periods in the reference function time series by 3dfim.
-
iiiBOLD signal change after scaling with BH;

-
ivBOLD signal change after scaling with RSFA;

-
v
After division of the amplitudes, the scaled BOLD response had dimensions similar to the unscaled BOLD responses (i.e., percent change).
Task‐induced activation areas from conventional statistical parametric mapping and effect of scaling in those regions
To determine conventional activation maps in response to the tasks in the two groups, a γ‐variate function was convolved with the task reference function and cross correlated with the BOLD signal on a voxel‐wise basis. Parameters of the γ‐variate function were derived according to Cohen [1997]. During BH, the reference function was shifted by 12 s to account for the hemodynamic delay during the BH response [Kannurpatti et al.,2002]. As the tasks had different time series lengths (resting‐state: 120 images; motor task: 90 images; DSST task: 150 images; BH task: 110 images), different correlation coefficient threshold values were required to obtain similar Bonferroni corrected P values. FTAP activation was determined using a threshold of 0.35, BH‐activation using a threshold of 0.30 and DSST activation using a threshold of 0.20, corresponding to a Bonferroni corrected P < 0.01 [Bandettini et al.,1993]. To minimize false positives, a minimum cluster size of 20 voxels was considered for generating the activation maps at the subject level during all tasks. Group activation maps were determined after converting each subject's anatomical and functional map to standard MNI coordinates using the ICBM‐152 template in FSL/FLIRT [Jenkinson and Smith,2001]. The correlation coefficients from each individual subject's functional maps were z‐transformed by considering the arctanh on a voxel‐wise basis and z‐maps from each subject were averaged. The averaged z‐maps were inverse Fisher transformed by considering the tanh of the z‐values to subsequently obtain the average correlation coefficient map for each group.
Detection of model‐free activation maps for comparative analysis of brain activity before and after scaling
To compare how brain activation patterns may be altered after scaling, maps were generated using the 99th percentile level of the null distribution, i.e., the distribution obtained from the resting‐state scan as a threshold on a subject‐wise basis. The motivation for such an analysis was to obtain a model free statistical estimate using a data driven approach. This type of analysis does not need any user input and compensates for putative intra‐ and intersubject differences in physiology that may alter the noise structures of the acquired images [Baudewig et al.,2003]. Null distributions were obtained using all voxels representing the brain after masking the skull. To obtain the null distributions before scaling, the task reference function was cross‐correlated on a voxel wise basis with the resting‐state scan from each subject and BOLD signal percent change was calculated using 3dfim. To obtain the null distributions after scaling, the SD of the first half of the resting‐state time series was divided by the SD of the second half to obtain the ratio in every voxel (this procedure avoided the acquisition of another resting‐state scan). The null distribution after scaling with BH was obtained by dividing the SD of the resting‐state time series by the SD of the BH time series. The activation map in a particular subject was thresholded at the 99th percentile value using the null distribution generated for that subject.
To identify intra‐ and intersubject BOLD signal variability, the average BOLD signal change across all voxels in each subject (meanintra) and its standard deviation (sdintra) across all active voxels were determined. The intra‐subject coefficient of variation (CVintra = sdintra/meanintra) was estimated for each subject in the younger and older groups. The group average of the BOLD signal change in the activated region (meaninter) and its standard deviation across the younger and older subjects (sdinter) was determined. The inter‐subject coefficient of variation (CVinter = sdinter/meaninter) was estimated for the younger and older groups.
Differences between group means was tested using the unpaired student's t‐test and the equality of variances between groups was tested using the Bartlett's test and P < 0.05 was required for significance.
RESULTS
Group activation volumes were smaller in the older, relative to the younger group during the motor and cognitive tasks. Figure 2 shows the activation during the motor task and Figure 3 shows that during the cognitive task. When the data were analyzed from each subject, the activation volume was significantly smaller in the older, relative to the younger group during the cognitive task, but no significant group difference was observed during the motor task (Table I). Significant differences during the motor task were not apparent despite higher average activation volumes. This result was due to significantly larger variability in the older compared with the younger subjects (P < 0.03; Bartlett's test). Activation volume variability was not significantly different in the older compared with the younger subjects during the cognitive task (P < 0.1; Bartlett's test).
Figure 2.
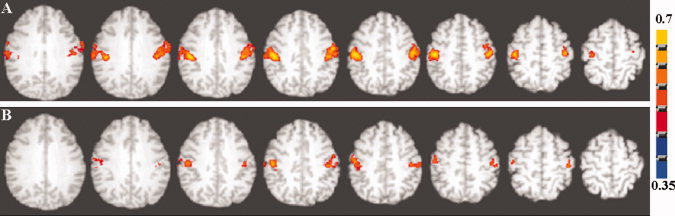
Axial view of the group activation maps during the motor task in (A) younger and (B) older subjects. A voxel‐wise cross‐correlation of the BOLD signal time course was performed with the reference function representing the task paradigm for each subject convolved with a γ‐variate function. The subject‐wise correlation coefficient maps representing activation were z‐transformed and averaged. The group activation map was determined after an inverse z‐transform and using a correlation coefficient threshold of 0.35 corresponding to a Bonferroni corrected P < 0.01. [Color figure can be viewed in the online issue, which is available at wileyonlinelibrary.com.]
Figure 3.
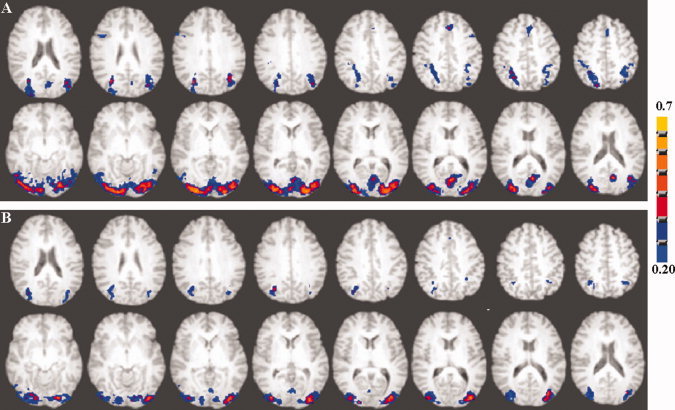
Axial view of the group activation maps during the cognitive task in (A) younger and (B) older subjects. A voxel‐wise cross‐correlation of the BOLD signal time course was performed with the reference function representing the task paradigm for each subject convolved with a γ‐variate function. The subject‐wise correlation coefficient maps representing activation were z‐transformed and averaged. The group activation map was determined after an inverse z‐transform and using a correlation coefficient threshold of 0.2 corresponding to a Bonferroni corrected P < 0.01. [Color figure can be viewed in the online issue, which is available at wileyonlinelibrary.com.]
Table I.
Activation volume (in cm3) in response to the motor (FTAP), cognitive (DSST), and hypercapnia (BH) tasks in young and old subjects
| Subject | Young | Old | ||||
|---|---|---|---|---|---|---|
| FTAP | DSST | BH | FTAP | DSST | BH | |
| 1 | 62.56 | 59.48 | 393.96 | — | — | — |
| 2 | 41.68 | 39.08 | 685.84 | 53.48 | 13.08 | 665.28 |
| 3 | 44.92 | 48.12 | 695.36 | 15.2 | 27.48 | 261.12 |
| 4 | 178.68 | 51.2 | 667.0 | 32.68 | 38.92 | 308.92 |
| 5 | 56.8 | 59.92 | 359.08 | 36.64 | 45.0 | 554.64 |
| 6 | 77.64 | 88.56 | 665.0 | 236.48 | 21.84 | 278.28 |
| 7 | 59.76 | 34.76 | 540.48 | 48.64 | 22.52 | 445.32 |
| 8 | 42.0 | 51.68 | 204.76 | 115.88 | 42.76 | 181.68 |
| 9 | 46.84 | 39.16 | 266.84 | 171.32 | 39.68 | 438.92 |
| 10 | 74.92 | 28.84 | 335.24 | 48.04 | 50.08 | 392.68 |
| 11 | 84.28 | 82.08 | 449.68 | 28.84 | 89.68 | 323.12 |
| 12 | 46.56 | 68.96 | 229.56 | 134.36 | 46.44 | 442.0 |
| Mean ± SD | 68.05 ± 37.76 | 54.32 ± 18.50 | 457.73 ± 186.71 | 83.77 ± 71.10 | 39.77 ± 20.40* | 390.18 ± 139.50 |
Significantly different P < 0.05 compared with DSST in young subjects; unpaired t‐test.
Correlation of RSFA with BH
In a smaller group of subjects (mean age of 43 years), we have shown that resting‐state BOLD fluctuation amplitude (RSFA) correlated strongly with BH‐induced BOLD response amplitude [Kannurpatti and Biswal,2008]. In order to see if a similar relationship would obtain in older subjects and if there were any group differences in the correlation between younger and older, we correlated older subjects' RSFA with BH. In each subject, RSFA, estimated as the temporal standard deviation (SD) of the resting‐state BOLD time series, was correlated with the BH signal response, estimated as the temporal SD of the BH time series on a voxel‐wise basis. The results of this analysis in two younger and older subjects are shown in Figure 4. Strong and significant correlations were observed between RSFA and BH in corresponding voxels throughout the brain. Similar correlations were observed in all other subjects (Table II). All voxels within the brain were used for the correlation and no significant difference was observed in the RSFA‐BH correlation between the younger and older groups.
Figure 4.
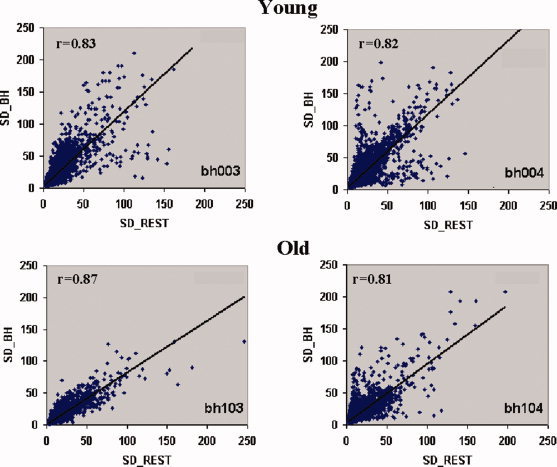
Correlation between RSFA and BH from four randomly selected subjects (two young and two old). A high correlation of (r > 0.78) was observed over the subjects irrespective of age. [Color figure can be viewed in the online issue, which is available at wileyonlinelibrary.com.]
Table II.
Correlation between RSFA and BH over all subjects (younger and older)
| Younger subjects | Correlation (r) | Older subjects | Correlation (r) |
|---|---|---|---|
| 1 | NA | 1 | NA |
| 2 | 0.83 | 2 | 0.87 |
| 3 | 0.82 | 3 | 0.81 |
| 4 | 0.80 | 4 | 0.86 |
| 5 | 0.81 | 5 | 0.81 |
| 6 | 0.83 | 6 | 0.90 |
| 7 | 0.88 | 7 | 0.89 |
| 8 | 0.88 | 8 | 0.85 |
| 9 | 0.68 | 9 | 0.86 |
| 10 | 0.78 | 10 | 0.87 |
| 11 | 0.80 | 11 | 0.82 |
| 12 | 0.92 | 12 | 0.91 |
Scaling and Intrasubject BOLD Amplitude Variation
Spatial variation in the BOLD hemodynamic response during task performance can occur depending on tissue characteristics, [e.g., proportions of gray and white matter, presence of large vessels or draining veins; Bandettini and Wong,1997; Lee et al.,1995]. With advancing age, BOLD characteristics can further change depending on gray matter loss and vessel compliance changes. To estimate the effects of these characteristics within each subject, the intra‐subject coefficient of variation (CVintra) was calculated for each subject in the younger and older groups. The CVintra for both the motor and cognitive task‐induced response was significantly smaller after scaling with RSFA and BH (Fig. 5). The extent of reduction in the spatial variation of BOLD signal change, as measured by CVintra, during the motor and cognitive tasks was similar in both the younger and older subjects. We tested for a significant difference in CVintra by considering any value greater than the mean for the older group as a “success” using the sign and binomial test [Siegel,1956]. The CVintra values in the younger subjects were found to be significantly greater than the older subjects during the motor (sign and binomial test; P < 0.02) and the cognitive task (sign and binomial test; P < 0.02). The results indicated that the BOLD signal amplitude change was more spatially variable in the younger compared with the older.
Figure 5.
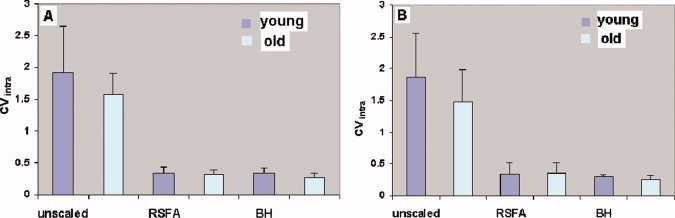
Spatial coefficient of variation (CVintra) in the BOLD signal change in the younger and older subjects. Spatial variation in BOLD response are plotted before and after hemodynamic scaling with RSFA and BH. (A) During the motor task. (B) During the cognitive task. [Color figure can be viewed in the online issue, which is available at wileyonlinelibrary.com.]
Figure 6 shows the effect of scaling of the frequency distribution of the BOLD signal change during the motor and cognitive tasks for younger and older subjects. The BOLD signal change varied spatially between 1%–15% in every subject during both tasks. Each distribution is the average of the individual subject distributions obtained from each group. Figure 6A,B show the average frequency distributions of the BOLD signal change in response to the motor task in the younger and older subjects after scaling with RSFA and BH respectively. Figure 6C,D show the same for the cognitive task. Scaling with RSFA or BH consistently reduced the intra‐subject variation in the BOLD signal change. The distributions after scaling with RSFA and BH during both tasks were significantly narrower than the distributions before scaling. It is evident from Figure 6, Tables III and IV, that BH scaling reduced the mean BOLD signal change more than RSFA in both age groups irrespective of the task.
Figure 6.
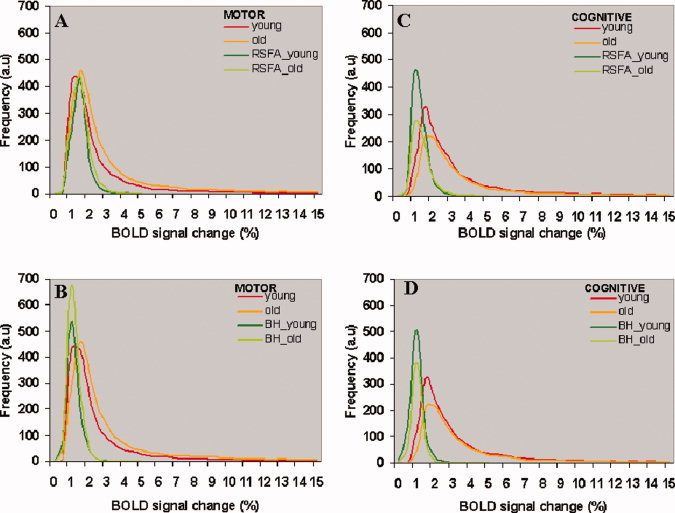
The distributions of the percent change in BOLD signal during the motor and cognitive task in the younger and older subjects. (A, C) Before and after hemodynamic scaling with RSFA. (B, D) Before and after hemodynamic scaling with BH. Each distribution represents the average of all subjects in each group. Each subject's distribution was generated from the significantly active voxels after cross‐correlation of the task‐reference time series with BOLD signal time series over all voxels in the brain. Same number of voxels went toward the distributions before and after scaling. [Color figure can be viewed in the online issue, which is available at wileyonlinelibrary.com.]
Table III.
BOLD signal amplitude change in younger and older subjects to a motor task (FTAP) and their values after hemodynamic scaling with RSFA or BH
| Subject | Younger | Older | ||||
|---|---|---|---|---|---|---|
| Unscaled | Scaled_RSFA | Scaled_BH | Unscaled | Scaled_RSFA | Scaled_BH | |
| 1 | 3.27 | NA | 0.93 | NA | NA | NA |
| 2 | 2.62 | 1.22 | 0.9 | 3.00 | 1.41 | 1.38 |
| 3 | 2.58 | 1.06 | 0.73 | 1.64 | 0.98 | 0.70 |
| 4 | 3.60 | 1.40 | 0.90 | 2.36 | 1.36 | 1.04 |
| 5 | 2.47 | 1.67 | 1.08 | 2.94 | 0.91 | 1.17 |
| 6 | 3.39 | 1.53 | 1.40 | 5.94 | 1.65 | 1.23 |
| 7 | 2.35 | 1.25 | 1.10 | 8.91 | 1.39 | 0.75 |
| 8 | 2.94 | 1.20 | 1.02 | 3.28 | 1.38 | 0.93 |
| 9 | 3.15 | 1.46 | 1.00 | 3.68 | 1.41 | 0.87 |
| 10 | 1.83 | 1.60 | 1.30 | 2.04 | 1.58 | 0.77 |
| 11 | 2.71 | 1.10 | 1.00 | 2.71 | 0.96 | 1.16 |
| 12 | 2.69 | 1.20 | 0.93 | 3.70 | 1.03 | 1.00 |
| Mean ± SD | 2.80 ± 0.49 | 1.34 ± 0.20 | 1.02 ± 0.18* | 3.65 ± 2.07 | 1.28 ± 0.26* | 1.00 ± 0.22*** |
| CVinter | 0.18 | 0.15 | 0.15 | 0.57 | 0.20*** | 0.22*** |
Significantly different P < 0.01 compared with scaled_RSFA (younger and older subjects); unpaired student's t‐test.
Significantly different P < 0.005 compared with unscaled‐FTAP (older subjects); unpaired student's t‐test.
P < 1 × 10⁻⁶ with respect to unscaled‐FTAP (older subjects); Bartlett's test of equality of variance.
Table IV.
BOLD signal amplitude change in old subjects to a cognitive task (DSST) and their values after hemodynamic scaling with RSFA or BH
| Subject (old) | Younger | Older | ||||
|---|---|---|---|---|---|---|
| Unscaled | Scaled_RSFA | Scaled_BH | Unscaled | Scaled_RSFA | Scaled_BH | |
| 1 | 3.56 | NA | 0.84 | 7.01 | NA | 1.16 |
| 2 | 3.78 | 1.00 | 0.75 | 5.91 | 1.45 | 1.25 |
| 3 | 4.96 | 1.00 | 0.63 | 2.79 | 1.24 | 0.80 |
| 4 | 3.12 | 1.13 | 0.66 | 2.86 | 1.05 | 0.70 |
| 5 | 3.16 | 1.86 | 1.15 | 5.12 | 1.45 | 1.47 |
| 6 | 4.48 | 1.42 | 1.26 | 4.12 | 1.75 | 1.24 |
| 7 | 3.12 | 1.13 | 1.16 | 2.9 | 0.90 | 0.51 |
| 8 | 3.75 | 1.00 | 0.76 | 3.83 | 1.33 | 0.89 |
| 9 | 3.42 | 1.33 | 0.91 | 3.77 | 1.53 | 0.81 |
| 10 | 6.81 | 1.59 | 1.25 | 3.22 | 1.8 | 0.79 |
| 11 | 4.00 | 0.83 | 0.75 | 4.44 | 1.01 | 1.00 |
| 12 | 3.12 | 1.13 | 0.80 | 4.17 | 1.04 | 1.00 |
| Mean ± SD | 3.94 ± 1.10 | 1.22 ± 0.30 | 0.91 ± 0.23* | 4.18 ± 1.30 | 1.32 ± 0.30 | 0.97 ± 0.27** |
| CVinter | 0.28 | 0.25 | 0.25 | 0.31 | 0.23 | 0.28 |
Significantly different P < 0.01 compared with scaled_RSFA (younger subjects); unpaired student's t‐test.
Significantly different P < 0.01 compared with scaled_RSFA (older subjects); unpaired student's t‐test.
Scaling and Intersubject BOLD Amplitude Variability
Vascular properties and baseline physiological conditions may differ between subjects, which can contribute to BOLD variation. To quantify these influences on BOLD signal, inter‐subject BOLD amplitude variability was determined. Table III shows the BOLD signal amplitude change for the motor task before, and after scaling, with BH and RSFA in the two groups. Table IV shows the same analyses for the cognitive task. After scaling with BH, a significantly larger reduction in BOLD variation during the motor task was observed in the older subject group. The inter‐subject coefficient of variation (CVinter) decreased from 0.57 to 0.22 (P < 1 × 10⁻⁶; Bartlett's test of equality of variance). Such large reductions in the inter‐subject variation were not evident in the younger subject group where CVinter reduced insignificantly from 0.18 to 0.15 after scaling with BH. Importantly, age‐group differences in CVinter reductions after scaling for the cognitive task were not significantly different. During the cognitive task, CVinter reduced minimally from 0.31 to 0.28 in the older and from 0.28 to 0.25 in the younger subject group. A similar trend was observed after scaling with RSFA. These results indicate that vascular sensitivity‐induced BOLD variation in the motor cortex was more prominent in the older when compared with the younger subjects.
Scaling and Spatial Extent of Activation
BOLD signal amplitude change was obtained for every voxel before and after scaling in younger and older subjects. Activation maps were generated using the 99th percentile values of rest‐related BOLD signal change as a threshold. Group maps generated using the above procedure are depicted in Figure 7 for the motor task and Figure 8 for the cognitive task. BOLD activation patterns obtained using the above statistical threshold method were very similar to that obtained using cross‐correlation analysis of the BOLD signal time series with a reference function representing the task convolved with a γ‐variate function (compare Figs. 2 and 3 with Figs. 7 and 8).
Figure 7.
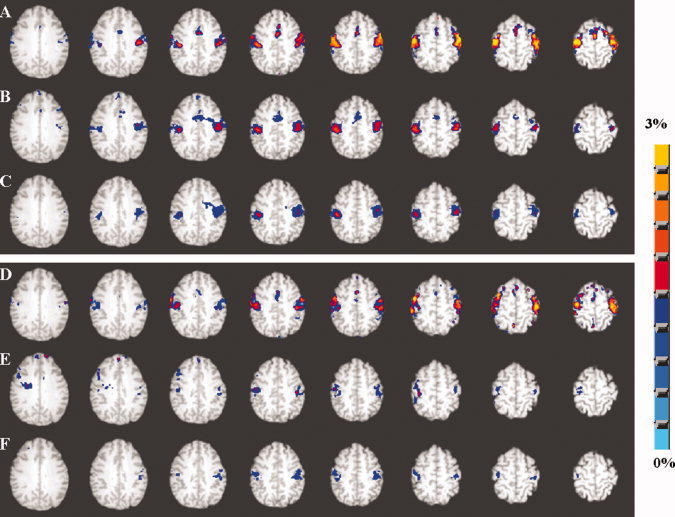
Axial view of the group activation maps representing the percent change in BOLD signal from the prestimulus baseline in the younger (A–C) and older subjects (D–F) during the motor task performance. A and D represents activation before hemodynamic scaling. B and E represents activation after hemodynamic scaling with RSFA and C and F represents activation after hemodynamic scaling with BH. Group activation maps were generated using the 99th percentile threshold value (P < 0.001; uncorrected) of the averaged null distribution of BOLD percent change values when no stimulus was present. [Color figure can be viewed in the online issue, which is available at wileyonlinelibrary.com.]
Figure 8.
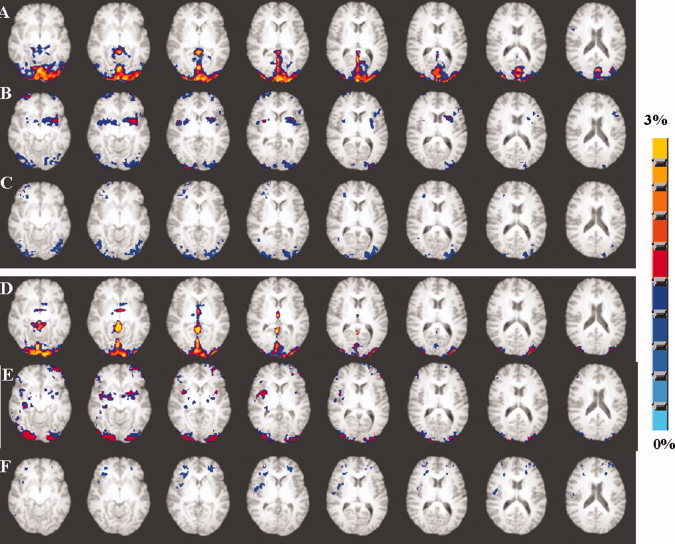
Axial view of the group activation maps representing the percent change in BOLD signal from the pre‐stimulus baseline in younger (A–C) and older subjects (D–F) during the cognitive task performance. A and D represents activation before hemodynamic scaling. B and E represents activation after hemodynamic scaling with RSFA and C and F represents activation after hemodynamic scaling with BH. Group activation maps were generated using the 99th percentile threshold value (P < 0.001; uncorrected) of the averaged null distribution of BOLD percent change values when no stimulus was present. [Color figure can be viewed in the online issue, which is available at wileyonlinelibrary.com.]
Figure 7 shows the group activation map of percent change in BOLD signal during performance of the motor task in the younger and older subjects. The older group showed no difference in BOLD signal change except activity differences in the supplementary motor areas in response to the motor task (compare Figs. 7A and 6D). Scaling with RSFA diminished BOLD change in both younger and older subjects (Fig. 7B,E). The activation volume after hemodynamic scaling with RSFA was smaller in the older subjects when compared with the younger in the motor cortex regions. Scaling with BH produced similar results as RSFA, but BOLD activation was attenuated further in the younger and older groups where activation, previously present in the supplementary motor areas in the younger group, was no longer above threshold (Fig. 7C,F). Figure 8 shows the spatial extent of the group activation map of percent change in BOLD signal during performance of the cognitive task in the younger and older subjects. The group maps in the older subjects showed decreased activation volume compared with the younger subjects before scaling (compare Fig. 8A,D). Scaling with RSFA and BH diminished the amplitude of the percent change maps in both younger and older subjects. RSFA attenuated the neural response significantly less than BH. As evident from Figure 8C,F, scaling with BH almost eliminated activation in visual areas in the older subjects, which did not occur during scaling with RSFA (Fig. 8B,E). The percent change after scaling the cognitive task response was smaller in both the younger and older groups.
DISCUSSION
Scaling using RSFA provides an empirically tractable and convenient method for removing intra‐ and inter‐subject variability arising from vascular factors. Some areas of the brain may have more non‐neural variability than other depending on the vascular composition of the regions [Bandettini and Wong,1997]. Studying two different cortical systems and their responses to scaling can provide a direct measure of vascular variability differences in certain cortical regions. In our earlier study, scaling using BH mitigated inter‐subject variability to a larger extent during a motor task [Kannurpatti and Biswal,2008] compared with a cognitive task shown by a different group [Thomason et al.,2007]. In the present study where each subject performed motor and cognitive tasks in the same session, comparison of vascular variability between two cortical systems could be made. Scaling confirmed that a significantly larger vascular component contributed to the inter‐subject variability during the motor task compared with the cognitive task. Further, scaling resulted in the largest reduction of inter‐subject variability during the motor task in the older subjects, which was significantly higher compared with the younger. Such differences were not observed during the cognitive task. This result indicates that vascular components in the motor cortical regions are altered more with age than the vascular components in those cortical regions involved by the cognitive task. Indirect clues to the extent of neural variability were obtained in the comparative studies of these two cortical systems. Assuming that the total BOLD variability is the sum of neural and vascular variability, the residual variability after scaling is predominantly neural. As can be observed in Tables III and IV, the CVinter after hemodynamic scaling was larger during the cognitive compared with the motor task. This result indicates that cortical regions affected by the cognitive task had more neural variability than the motor cortical regions during the motor task performance.
RSFA scaling reduced the skew of the BOLD amplitude distribution, known to be predominantly vascular in origin [Biswal et al.,2007]. One concern could be that such scaling might also be attenuating the BOLD responses, which are neural in origin. With the vascular component predominantly leading to the skew, and in light of the global BOLD amplitudes assessed, it must be noted that residual skew could also result from varying BOLD amplitudes of neural origin in different brain regions or (as can be seen in Fig. 6) different subjects. RSFA and BH scaling reduced the skew in the BOLD distributions to equivalent extents.This result suggests that RSFA E(1) captures vascular contributions to BOLD as well as BH. However, RSFA scaling attenuated the task‐induced BOLD response significantly less than BH during the motor and cognitive tasks in both groups (Tables III and IV; unpaired student's t‐test p<0.01). Relatively greater sparing of task‐induced BOLD response with RSFA compared with BH may indicate reduced attenuation of genuine neural activity related BOLD changes. Subject compliance with BH instructions could adversely affect the accuracy of vascular estimation if it led to individual differences in true vascular perturbation. Fortunately, in the present study, the mean BH response (from the whole brain) in both younger and older groups did not show any significant difference (data not shown). As far as we know, factors such as breathing rate, depth or volume, (which may have differed in the elderly) did not seem to significantly influence the BH response amplitude and thus the BH scaling factor in our sample.
Comparison of inter‐ and intra‐subject variability indicated that, whereas inter‐subject variability was significantly larger in the older group than the younger group, intra‐subject variability (as measured by CVintra) was significantly smaller in the older group. Spatially more variable BOLD signal change in younger compared with older subjects may be a result of well‐preserved diversity of vascular reactivity in younger brains when compared with older brains. Scaling reduced the intra‐subject variability (CVintra) in the younger and older groups during both the motor and cognitive tasks. The CVintra was significantly smaller in the older subject group during the motor and cognitive tasks. The CVintra reduced to similar levels of 0.3 in both groups (Fig. 5). Thus relatively more diverse vascular reactivity may have led to greater spatial variability of task‐induced BOLD signal response, in the younger subjects. Scaling mitigated this vascular reactivity spread in the younger to match with that of the older subject group.
RSFA scaling, based on division in the present study, consistently reduced inter‐subject BOLD variation. The motor task results in the present study also showed a minimal decrease in CVinter in the younger and a larger decrease in the older subjects. A similar reduction in inter‐subject BOLD variation has been shown in younger subjects performing a cognitive task [Thomason et al.,2007] and a motor task [Kannurpatti and Biswal,2008]. These results are in contrast to those observed in a couple of studies from other groups where an increase in inter‐subject BOLD variation has been observed after scaling by division (i.e., Cohen et al.,2004; Liau and Liu,2009]. The increase in the inter‐subject BOLD variation can be due to the different methods used to induce hypercapnia. For example, both studies that show an increase in inter‐subject variability, [i.e., Cohen et al.,2004; Liau and Liu,2009] used 5% CO2 inhalation for an extended period of time (3 min) as the hypercapnia task. In our earlier study [Biswal et al.,2007], we compared a brief period of 5% CO2 inhalation to a 20 sec BH paradigm. Inhalation of 5% CO2 through a breathing mask for the duration of 20 sec was sufficient to induce BOLD amplitude change equivalent to a 20 sec BH task. Hence in the above studies wherein increased inter‐subject variability was observed, hypercapnia induced by 3 min breathing of 5% CO2 induced large increases in BOLD amplitudes [almost 16%–100% in Liau and Liu,2009], that they may not efficiently scale by division. However, Liau and Liu [2009] compared hypercapnic scaling by division and covariate analysis. They observed a decrease in inter‐subject BOLD variation when the hypercapnic response was treated as a covariate. However, scaling using the hypercapnic response as a covariate is affected by a bias originating from a finite intercept value in the regression of task‐induced BOLD responses and hypercapnia induced BOLD responses and can be used only during analysis on a subject level. Accordingly, significant reduction of inter‐subject BOLD variation after scaling by division, in the present study, maybe attributed to the relatively minimal nature of the BOLD response amplitude change induced by BH and the resting state.
Older subjects, despite having a significantly smaller intra‐subject BOLD signal variability compared with younger, showed significantly greater inter‐subject variability. This result replicates earlier results [D'Esposito et al.,1999] and indicates that baseline physiological levels may vary more among older subjects leading to greater task‐induced BOLD signal variability between subjects. Previous studies have indicated that CBF significantly decreased with age [Bentourkia et al.,2000; Leenders et al.,1990] and led to a decreased ‘M’ value as a result of a decrease in the resting‐state CBV and oxygen extraction fraction (OEF) [Ances et al.,2008]. According to the relationship defined by Eqs. (1) to (3), scaling with RSFA and BH mitigates inter‐subject variability in the BOLD signal response by eliminating the variability in ‘M’. The larger variability in ‘M’ in the older subjects indicated by our results may stem from a larger variability in baseline CBV and hence CBF. Thus in older subject groups, in addition to decreased mean baseline CBV and CBF levels, one can expect a larger variation in these physiological parameters. In a recent study investigating a memory‐encoding task, older subjects demonstrated a relatively higher CBF change with no significantly different BOLD signal change when compared with younger [Restom et al.,2007]. The relatively large inter‐subject variability in baseline CBF in the older subjects may have reduced the sensitivity to detect significant differences in BOLD signal change as this may have translated into a large variability in ‘M’.
To enable the comparison of regions of significant BOLD signal change before and after scaling (Figs. 7 and 8), BOLD amplitude change maps were obtained without prior assumptions regarding the hemodynamic response function or the equivalence of noise parameters in the younger and older subject images [Baudewig et al.,2003]. They were based on a statistical threshold obtained from the respective null distributions of the percent change in BOLD signal on a subject‐wise basis for each experimental paradigm. The regions of activation obtained using this statistical method had a strong resemblance to that obtained using conventional statistical parameteric mapping (compare with Figs. 2 and 3). The scaled activation in the younger group was larger in volume and amplitude when compared with the older group during the motor task. These results indicate that neural activity in those regions, in the older group, were less than that in the younger group during the motor task. During the cognitive task, scaled regions of activation were spatially different from the un‐scaled (Fig. 8). From Figure 8F, BH almost completely attenuated the BOLD response in the visual areas, which was not the case with RSFA. This result indicates that scaling with RSFA spares neural activity related BOLD responses relatively more than BH. Activity was also observed in the parahippocampal gyrus and insula in both hemispheres. This result indicates that these regions maybe vulnerable to inter‐subject variations and that they may not be accurately represented in group fMRI maps without accounting for vascular variability. Chronic insular activation has been shown to differ between individuals, and has been proposed as an endophenotypic marker of anxiety proneness [Paulus and Stein,2006]. However, our data indicate that significant vascular variability between subjects may also attenuate insular activation. Parahippocampal gyrus, the second vulnerable region to significant vascular variability between subjects has been implicated in the encoding and maintenance of working memory [Luck et al.,2009]. However, in light of recent evidence, the medial temporal lobe, that includes the parahippocampal gyrus, is being reconsidered from its classical role in maintaining long‐term memory [Squire et al.,2004] to short‐term maintenance of bound information [Jonides et al.,2008; Kumaran et al.,2008]. Thus, working memory studies in aging populations need to carefully consider vascular variability in vulnerable regions such as the insular cortex and parahippocampal gyrus.
With experimental evidence showing diminished hypercapnia‐induced BOLD response, indicating compromised vasoactive capacity in the elderly [Riecker et al.,2003], it has been argued that age‐related changes in the vasculature can lead to age‐related differences in BOLD signal during task‐induced neural activation, which may not be due to true differences in neural computation [Gazzaley and D'Esposito,2005]. However, in addition to compromised vasoactive capacity, there is strong evidence to suggest altered brain metabolism with aging. Positron Emission Tomography (PET), which measures brain metabolism, have indicated decreased glucose metabolism associated with age [Kalpouzos et al.,2009; Salat et al.,2004]. After accounting for vascular differences, the persistent task‐induced differences in BOLD activity between the older and younger may indicate genuine differences in neural metabolism during the performance of the tasks. Mitochondrial oxidative function has been implicated in age‐related neurodegenerative diseases through reactive oxygen species and might have a role in the loss of brain function with healthy aging [Reddy,2007]. Mitochondrial oxidative metabolism is significantly decreased in the neuronal and altered in the glial compartment in older when compared with younger [Boumezbeur et al.,2009]. Thus, age‐related decreases in the scaled BOLD responses in the present study, after accounting for vascular differences, predicted a possible decrease in neuronal oxidative metabolism coupling blood flow in the older adults. However, more research is required to understand the relationship of age‐related changes in neural metabolism on the BOLD response.
In conclusion, hemodynamic scaling with RSFA permitted more accurate assessment of genuine task‐related neural activity differences between younger and older subjects. The extent of vascular contribution to BOLD signal variability between subjects depended upon the cortical system involved. The influence of vascular variables and baseline physiology on BOLD variability between subjects can increase with larger age range and can be successfully mitigated by scaling using the resting‐state BOLD fluctuation. BOLD signal change was more spatially variable in the younger when compared with the older, perhaps due to well‐preserved diversity of vascular reactivity function in the younger brain.
A schematic of the estimated parameters described in the Methods section for the task and resting‐state conditions is depicted in Figure A1. With these measured parameters, the theoretical relationship of BOLD signal change to its underlying physiological variables CBF and CMRO2 [Davis et al., 1998; Hoge et al., 1999] can be defined as:
 |
(1) |
where B task is the BOLD signal change in response to a task that has substantial changes in neural activity, M is a constant dependent on the vasomotor properties, α and β are constants. α = 0.38 for normocapnic conditions [Grubb et al., 1974], while β can vary between 1and 2 depending on the susceptibility and contribution from intra and extravascular compartments which can vary with the field strength. A value of β = 1 can be approximated for a field strength of 3T used in this study [Boxerman et al., 1995; Buxton, 2002].
Figure A1.
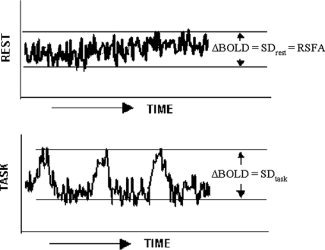
Schematic of the temporal structures of the resting state and task‐induced BOLD signals and the representation of the SD for each case.
Assuming negligible changes in neural activity during the performance of BH, which implies no change in CMRO2 [Fox and Raichle, 1986], Eq. (1) reduces to:
| (2) |
During the resting state, subjects remained in the scanner with their eyes closed and breathed spontaneously. This condition can be treated as equivalent to subjects spontaneously performing the BH task with a short stimulus and interstimulus‐interval. For typical human subjects where breathing ranges between 12 and 16 cycles/min, the resting‐state condition can be treated as the subject spontaneously performing the BH with a stimulus and interstimulus‐interval time in the range of 2 s each. Thus the BOLD signal change during the resting state can be defined by an equation similar to (2) as:
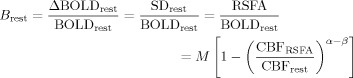 |
(3) |
where B rest is analytically equivalent to B BH. Also CBFRSFA, which is analytically equivalent to CBFBH, can be defined as the peak value of the CBF fluctuation during rest. This was based on the empirical relationship observed between BOLD and CBF fluctuations measured during physiological state modulations through controlled hypotension, (which apparently does not change neural activity), using laser Doppler flowmetry [Hudetz et al., 1992] and fMRI [Kannurpatti et al., 2008].
Dividing Eq. (1) by (2) and (1) by (3) provides a measurable indicator of cerebral activity, defined as the scaled BOLD response and is simply the ratio of the SDs during the task and BH, and task and resting conditions, respectively. The multiplicative constant M, a baseline physiological and vasomotive component, is a constant for any subject during the task activated and BH conditions is eliminated after scaling by division.
REFERENCES
- Aizenstein HJ, Butters MA, Clark KA, Figurski JL, Andrew Stenger V, Nebes RD, Reynolds CF III, Carter CS ( 2006): Prefrontal and striatal activation in elderly subjects during concurrent implicit and explicit sequence learning. Neurobiol Aging 27: 741–751. [DOI] [PubMed] [Google Scholar]
- Ances BM, Liang CL, Leontiev O, Perthen JE, Fleisher AS, Lansing AE, Buxton RB ( 2008): Effects of aging on cerebral blood flow, oxygen metabolism, and blood oxygenation level dependent responses to visual stimulation. Hum Brain Mapp 30: 1120–1132. [DOI] [PMC free article] [PubMed] [Google Scholar]
- Bandettini PA, Jesmanowicz A, Wong EC, Hyde JS ( 1993): Processing strategies for the time‐course data sets in fMRI of the human brain. Mag Reson Med 30: 161–173. [DOI] [PubMed] [Google Scholar]
- Bandettini PA, Wong EC ( 1997): A hypercapnia‐based normalization method for improved spatial localization of human brain activation with fMRI. NMR Biomed 10: 197–203. [DOI] [PubMed] [Google Scholar]
- Banzett RB, Mulnier HE, Murphy K, Rosen SD, Wise RJ, Adams L ( 2000): Breathlessness in humans activates insular cortex. Neuroreport 11: 2117–2120. [DOI] [PubMed] [Google Scholar]
- Baudewig J, Dechent P, Merboldt KD, Frahm J ( 2003): Thresholding in correlation analyses of magnetic resonance functional neuroimaging. Magn Reson Imaging 21: 1121–1130. [DOI] [PubMed] [Google Scholar]
- Bentourkia M, Bol A, Ivanoiu A, Labar D, Sibomana M, Coppens A, Michel C, Cosnard G, De Volder AG ( 2000): Comparison of regional cerebral blood flow and glucose metabolism in the normal brain: Effect of aging. J Neurol Sci 181: 19–28. [DOI] [PubMed] [Google Scholar]
- Biswal BB, Kannurpatti SS, Rypma B ( 2007): Hemodynamic scaling of fMRI‐BOLD signal: Validation of low‐frequency spectral amplitude as a scalability factor. Magn Reson Imaging 25: 1358–1369. [DOI] [PMC free article] [PubMed] [Google Scholar]
- Boumezbeur F, Mason GF, de Graaf RA, Behar KL, Cline GW, Shulman GI, Rothman DL, Petersen KF ( 2009): Altered brain mitochondrial metabolism in healthy aging as assessed by in vivo magnetic resonance spectroscopy. J Cereb Blood Flow Metab 30: 211–221. [DOI] [PMC free article] [PubMed] [Google Scholar]
- Boxerman JL, Bandettini PA, Kwong KK, Baker JR, Davis TL, Rosen BR, Weisskoff RM ( 1995): The intravascular contribution to fMRI signal change. Monte Carlo modeling and diffusion‐weighted studies in vivo. Magn Reson Med 34: 4–10. [DOI] [PubMed] [Google Scholar]
- Brannan S, Liotti M, Egan G, Shade R, Madden L, Robillard R, Abplanalp B, Stofer K, Denton D, Fox PT ( 2001): Neuroimaging of cerebral activations and deactivations associated with hypercapnia and hunger for air. Proc Natl Acad Sci USA 98: 2029–2034. [DOI] [PMC free article] [PubMed] [Google Scholar]
- Buxton RB ( 2002): Introduction to Functional Magnetic Resonance Imaging. Cambridge, UK: Cambridge University Press; pp 394–395. [Google Scholar]
- Cohen MS ( 1997): Parametric analysis of fMRI data using linear systems methods. Neuroimage 6: 93–103. [DOI] [PubMed] [Google Scholar]
- Cohen ER, Rostrup E, Sidaros K, Lund TE, Paulson OB, Ugurbil K, Kim SG ( 2004): Hypercapnic normalization of BOLD fMRI: Comparison across field strengths and pulse sequences. Neuroimage 23: 613–624. [DOI] [PubMed] [Google Scholar]
- Corfield DR, Fink GR, Ramsay SC, Murphy K, Harty HR, Watson JD, Adams L, Frackowiak RS, Guz, A ( 1995): Evidence for limbic system activation during CO2 ‐stimulated breathing in man. J Physiol 488: 77–84. [DOI] [PMC free article] [PubMed] [Google Scholar]
- Cox RW ( 1996): AFNI: Software for analysis and visualization of functional magnetic resonance neuroimages. Comput Biomed Res 29: 162–173. [DOI] [PubMed] [Google Scholar]
- Davis T, Kwong K, Weisskoff R, Rosen BR ( 1998): Calibrated functional MRI: Mapping the dynamics of oxidative metabolism. Proc Natl Acad Sci USA 95: 1834–1839. [DOI] [PMC free article] [PubMed] [Google Scholar]
- D'Esposito M, Zarahn E, Aguirre GK, Rypma B ( 1999): The effect of normal aging on the coupling of neural activity to the bold hemodynamic response. Neuroimage 10: 6–14. [DOI] [PubMed] [Google Scholar]
- Erber JT, Botwinick J, Storandt M ( 1981): The impact of memory on age differences in digit symbol performance. J Gerontol 36: 586–590. [DOI] [PubMed] [Google Scholar]
- Evans KC, Banzett RB, Adams L, McKay L, Frackowiak RS, Corfield DR ( 2002): BOLD fMRI identifies limbic, paralimbic, and cerebellar activation during air hunger. J Neurophysiol 88: 1500–1511. [DOI] [PubMed] [Google Scholar]
- Fox P, Raichle ME ( 1986): Focal physiological uncoupling of cerebral blood flow and oxidative metabolism during somatosensory stimulation in human subjects. Proc Natl Acad Sci USA 83: 1140–1144. [DOI] [PMC free article] [PubMed] [Google Scholar]
- Gazzaley A, D'Esposito M ( 2005): BOLD Functional MRI and Cognitive Aging. Cognitive Neuroscience of Aging: Linking Cognitive and Cerebral Aging. New York, NY: Oxford University Press; pp 107–131. [Google Scholar]
- Grubb RL Jr, Raichle ME, Eichling JO, Ter‐Pogossian MM ( 1974): The effects of changes in PaCO2 on cerebral blood volume, blood flow and vascular mean transit time. Stroke 5: 630–639. [DOI] [PubMed] [Google Scholar]
- Handwerker DA, Gazzaley A, Inglis BA, D'Esposito M ( 2007): Reducing vascular variability of fMRI data across aging populations using a breathholding task. Hum Brain Mapp 28: 846–859. [DOI] [PMC free article] [PubMed] [Google Scholar]
- Hoge RD, Atkinson J, Gill B, Crelier GR, Marrett S, Pike GB ( 1999): Investigation of BOLD signal dependence on cerebral blood flow and oxygen consumption: The deoxyhemoglobin dilution model. Magn Reson Med 42: 849–863. [DOI] [PubMed] [Google Scholar]
- Hudetz AG, Roman RJ, Harder DR ( 1992): Spontaneous flow fluctuations in the cerebral cortex during acute changes in mean arterial pressure. J Cereb Blood Flow Metab 12: 491–499. [DOI] [PubMed] [Google Scholar]
- Huettel SA, Singerman JD, McCarthy G ( 2001): The effects of aging upon the hemodynamic response measured by functional MRI. Neuroimage 13: 161–175. [DOI] [PubMed] [Google Scholar]
- Jenkinson M, Smith SM ( 2001): A global optimisation method for robust affine registration of brain images. Med Image Anal 5: 143–156. [DOI] [PubMed] [Google Scholar]
- Jiang A, Kennedy DN, Baker JR, Weisskoff RM, Tootell RBH, Woods RP, Benson RR, Kwong KK, Brady TJ, Rosen BR, Belliveau JW ( 1995): Motion detection and correction in functional MR imaging. Human Brain Mapp 3: 224–235. [Google Scholar]
- Jonides J, Lewis RL, Nee DE, Lustig CA, Berman MG, Moore KS ( 2008): The mind and brain of short‐term memory. Ann Rev Psychol 59: 193–224. [DOI] [PMC free article] [PubMed] [Google Scholar]
- Joy S, Fein D, Kaplan E, Freedman M ( 2000): Speed and memory in WAIS‐R‐NI digit symbol performance among healthy older adults. J Int Neuropsychol Soc 6: 770–780. [DOI] [PubMed] [Google Scholar]
- Kalpouzos G, Chetelat G, Baron JC, Landeau B, Mevel K, Godeau C, Barre L, Constans JM, Viader F, Eustache F, Desgranges B ( 2009): Voxel‐based mapping of brain gray matter volume and glucose metabolism profiles in normal aging. Neurobiol Aging 30: 112–124 [DOI] [PubMed] [Google Scholar]
- Kannurpatti SS, Biswal BB, Hudetz AG ( 2002): Differential fMRI‐BOLD signal response to apnea in humans and anesthetized rats. Magn Reson Med 47: 864–870. [DOI] [PubMed] [Google Scholar]
- Kannurpatti SS, Biswal BB ( 2008): Detection and scaling of task‐induced fMRI‐BOLD response using resting state fluctuations. Neuroimage 40: 1567–1574. [DOI] [PMC free article] [PubMed] [Google Scholar]
- Kannurpatti SS, Biswal BB, Kim YR, Rosen BR ( 2008): Spatio‐temporal characteristics of low‐frequency BOLD signal fluctuations in isoflurane‐anesthetized rat brain. Neuroimage 40: 1738–1747. [DOI] [PMC free article] [PubMed] [Google Scholar]
- Kannurpatti SS, Motes MA, Rypma, Biswal BB ( 2010): Neural and vascular variability and the fMRI‐BOLD response in normal aging. Magn Reson Imaging 28: 466–476. [DOI] [PMC free article] [PubMed] [Google Scholar]
- Kastrup A, Li TQ, Takahashi A, Glover GH, Moseley ME ( 1998): Functional magnetic resonance imaging of regional cerebral blood oxygenation changes during breath holding. Stroke 29: 2641–2645. [DOI] [PubMed] [Google Scholar]
- Kastrup A, Kruger G, Glover GH, Moseley ME ( 1999): Assessment of cerebral oxidative metabolism with breath‐holding and fMRI. Mag Reson Med 42: 608–611. [DOI] [PubMed] [Google Scholar]
- Kumaran D ( 2008): Short‐term memory and the human hippocampus. J Neurosci 28: 3837–3838. [DOI] [PMC free article] [PubMed] [Google Scholar]
- Lee AT, Glover GH, Meyer CH ( 1995): Discrimination of large venous vessels in time‐course spiral blood‐oxygen‐level‐dependent magnetic‐resonance functional neuroimaging. Magn Reson Med 33: 745–754. [DOI] [PubMed] [Google Scholar]
- Leenders KL, Perani D, Lammertsma AA, Heather JD, Buckingham P, Healy MJ, Gibbs JM, Wise RJ, Hatazawa J, Herold S, Beaney RP, Brooks DJ, Spinks T, Rhodes C, Frackowiak RSJ, Jones T ( 1990): Cerebral blood flow, blood volume and oxygen utilization. Normal values and effect of age. Brain 113: 27–47. [DOI] [PubMed] [Google Scholar]
- Liotti M, Brannan S, Egan G, Shade R, Madden L, Abplanalp B, Robillard R, Lancaster J, Zamarripa FE, Fox PT, Denton D ( 2001): Brain responses associated with consciousness of breathlessness (air hunger). Proc Natl Acad Sci USA 98: 2035–2040. [DOI] [PMC free article] [PubMed] [Google Scholar]
- Liau J, Liu TT ( 2009): Inter‐subject variability in hypercapnic normalization of the BOLD fMRI response. Neuroimage 45: 420–430. [DOI] [PMC free article] [PubMed] [Google Scholar]
- Luck D, Danion JM, Marrer C, Pham BT, Gounot D, Foucher J ( 2009): The right parahippocampal gyrus contributes to the formation and maintenance of bound information in working memory. Brain Cogn 72: 255–263. [DOI] [PubMed] [Google Scholar]
- Maccotta L, Buckner RL ( 2004): Evidence for neural effects of repetition that directly correlate with behavioral priming. J Cogn Neurosci 16: 1625–1632. [DOI] [PubMed] [Google Scholar]
- Marvel CL, Desmond JE ( 2009): The contributions of cerebro‐cerebellar circuitry to executive verbal working memory. Cortex 46: 880–895. [DOI] [PMC free article] [PubMed] [Google Scholar]
- Motes MA, Rypma B ( 2009): Working memory component processes: Isolating BOLD signal changes. Neuroimage 49: 1933–1941. [DOI] [PMC free article] [PubMed] [Google Scholar]
- Parsons LM, Egan G, Liotti M, Brannan S, Denton D, Shade R, Robillard R, Madden L, Abplanalp B, Fox PT ( 2001): Neuroimaging evidence implicating cerebellum in the experience of hypercapnia and hunger for air. Proc Natl Acad Sci USA 98: 2041–2046. [DOI] [PMC free article] [PubMed] [Google Scholar]
- Paulus MP, Stein MB ( 2006): An insular view of anxiety. Biol Psychiatry 60: 383–387. [DOI] [PubMed] [Google Scholar]
- Reddy PH ( 2007): Mitochondrial dysfunction in aging and Alzheimer's disease: strategies to protect neurons. Antioxid Redox Signal 9: 1647–1658. [DOI] [PubMed] [Google Scholar]
- Restom K, Bangen KJ, Bondi MW, Perthen JE, Liu TT ( 2007): Cerebral blood flow and BOLD responses to a memory encoding task: A comparison between healthy young and elderly adults. Neuroimage 37: 430–439. [DOI] [PMC free article] [PubMed] [Google Scholar]
- Riecker A, Grodd W, Klose U, Schulz JB, Gröschel K, Erb M, Ackermann H, Kastrup A ( 2003): Relation between regional functional MRI activation and vascular reactivity to carbon dioxide during normal aging. J Cereb Blood Flow Metab 23: 565–573. [DOI] [PubMed] [Google Scholar]
- Ross MH, Yurgelun‐Todd DA, Renshaw PF, Maas LC, Mendelson JH, Mello NK, Cohen BM, Levin JM ( 1997): Age‐related reduction in functional MRI response to photic stimulation. Neurology 48: 216–221. [DOI] [PubMed] [Google Scholar]
- Rypma B, D'Esposito M ( 2000): Isolating the neural mechanisms of age‐related changes in human working memory. Nat Neurosci 3: 509–515. [DOI] [PubMed] [Google Scholar]
- Rypma B, Prabhakaran V, Desmond JE, Gabrieli JD ( 2001): Age differences in prefrontal cortical activity in working memory. Psychol Aging 16: 371–384. [DOI] [PubMed] [Google Scholar]
- Rypma B, Berger JS, Genova HM, Rebbechi D, D'Esposito M ( 2005): Dissociating age‐related changes in cognitive strategy and neural efficiency using event‐related fMRI. Cortex 41: 582–594. [DOI] [PubMed] [Google Scholar]
- Rypma B, Berger JS, Prabhakaran V, Bly BM, Kimberg DY, Biswal BB, D'Esposito M ( 2006): Neural correlates of cognitive efficiency. Neuroimage 33: 969–979. [DOI] [PubMed] [Google Scholar]
- Rypma B, Eldreth DA, Rebbechi D ( 2007): Age‐related differences in activation‐performance relations in delayed‐response tasks: A multiple component analysis. Cortex 43: 65–76. [DOI] [PubMed] [Google Scholar]
- Salat DH, Buckner RL, Snyder AZ, Greve DN, Desikan RS, Busa E, Morris JC, Dale AM, Fischl B ( 2004): Thinning of the cerebral cortex in aging. Cereb Cortex 14: 721–730. [DOI] [PubMed] [Google Scholar]
- Salthouse TA ( 1992): What do adult age differences in the Digit Symbol Substitution Test reflect? J Gerontol 47: 121–128. [DOI] [PubMed] [Google Scholar]
- Samanez‐Larkin GR, D'Esposito M ( 2008): Group comparisons: Imaging the aging brain. Soc Cogn Affect Neurosci 3: 290–297. [DOI] [PMC free article] [PubMed] [Google Scholar]
- Siegel S ( 1956): Nonparametric Statistics for the Behavioral Sciences. NY: McGraw‐Hill: New York. [Google Scholar]
- Squire LR, Stark CE, Clark RE ( 2004): The medial temporal lobe. Ann Rev Neuroscince 27: 279–306. [DOI] [PubMed] [Google Scholar]
- Taoka T, Iwasaki S, Uchida H, Fukusumi A, Nakagawa H, Kichikawa K, Takayama K, Yoshioka T, Takewa M, Ohishi H ( 1998): Age correlation of the time lag in signal change on EPI‐fMRI. J Comput Assist Tomogr 22: 514–517. [DOI] [PubMed] [Google Scholar]
- Thomason ME, Burrows BE, Gabrieli JD, Glover GH ( 2005): Breath holding reveals differences in fMRI BOLD signal in children and adults. Neuroimage 25: 824–837. [DOI] [PubMed] [Google Scholar]
- Thomason ME, Foland LC, Glover GH ( 2007): Calibration of BOLD fMRI using breath holding reduces group variance during a cognitive task. Hum Brain Mapp 28: 59–68. [DOI] [PMC free article] [PubMed] [Google Scholar]
- Wechsler D. 1981. Manual for the Wechsler Adult Intelligence Scale‐Revised. New York: The Psychological Corp. [Google Scholar]
- Wise RG, Ide K, Poulin MJ, Tracey I ( 2004): Resting fluctuations in arterial carbon dioxide induce significant low frequency variations in BOLD signal. Neuroimage 16: 52–64. [DOI] [PubMed] [Google Scholar]