

Abstract
Objective
Historically, acute kidney injury (AKI) carried a deadly prognosis in the burn population. Our aim with this study was to provide a modern description of AKI in the burn population and to develop a prediction tool for identifying patients at risk for late AKI.
Methods
A large multi-institution database, the Glue Grant's trauma related database (TRDB), was used to characterize AKI in a cohort of critically ill burn patients. We defined AKI according to the RIFLE criteria and categorized AKI as early, late or progressive. We then used Classification and Regression Tree (CART) analysis to create a decision tree with data obtained from the first 48 hours of admission to predict which subset of patients would develop late AKI. We tested the accuracy of this decision tree in a separate, single-institution cohort of burn patients who met the same criteria for entry into the Glue Grant study
Results
Of the 220 total patients analyzed from the Glue Grant cohort, 49 (22.2%) developed early AKI, 39 (17.7%) developed late AKI, and 16 (7.2%) developed progressive AKI. The group with progressive AKI was statistically older, with more comorbidities, and with the worst survival when compared to those with early or late AKI. Using CART analysis, we developed a decision tree with an overall accuracy of 80% for the development of late AKI for the Glue Grant dataset. We then tested this decision tree on a smaller dataset from our own institution to validate this tool, and found it to be 73% accurate.
Conclusions
AKI is common in severe burns with notable differences between early, late, and progressive AKI. Additionally, CART analysis provided a predictive model for early identification of patients at highest risk for developing late AKI with proven clinical accuracy.
Keywords: Acute Renal Failure, hemodialysis, Burns, Classification and regression tree
Introduction
Historically, acute kidney injury (AKI) has carried a deadly prognosis in the burn population with most studies reporting a mortality of 80-85% (1, 3-5), and the oldest report reaching 100% mortality (6). Since the 1950's, the incidence of AKI has ranged from 1 to 40% of burned patients (1, 3, 4, 6-8). Varying definitions of AKI account for this wide range in incidence and have hampered research efforts to accurately define or classify patients with renal dysfunction. Often burn patients were not considered to have renal dysfunction until they required renal replacement therapy (RRT). Therefore, up to 50% of these AKI patients were treated with RRT (9).
The Risk, Injury, Failure, Loss, and End-stage kidney (RIFLE) classification system has been developed to more accurately categorize severity of renal dysfunction and has enabled investigators to better study outcomes of acute kidney injury (AKI) in critically ill patients, including burn patients (10-15). RIFLE defines three grades of increasing severity of AKI: Risk, Injury, and Failure based on changes in serum creatinine or urine output along with two outcome categories—Loss and End-stage kidney disease (10). Recently, RIFLE criteria have been used in the burn population to correlate early AKI, late AKI, and worst RIFLE score with hospital outcomes (16, 17).
Inadequate fluid resuscitation during the initial post-burn period contributes to early AKI, or AKI occurring during resuscitation (9). In contrast, late AKI has multiple etiologies and is usually associated with sepsis and multiple organ dysfunction (MODS) (2, 9). Improvements in early fluid resuscitation have decreased the incidence of early AKI but have only modestly improved the overall mortality rate since early MODS is relatively uncommon. In contrast, late MODS is a relatively common problem and is the most common cause of death in the severely burned patient who dies after the initial resuscitative phase (15, 18, 19).
The exact pathophysiology of late AKI in the burned patient is still poorly understood (1, 2). These poorly understood etiologies makes predicting which burn patients will suffer late AKI quite difficult, and there remains controversy about how best to treat AKI; with questions about the best dose of dialysis per treatment and timing of renal replacement therapy (RRT) initiation (16, 20-22). Thus, as we explore the answers to these questions, it is clear that any reno-protective strategy would require early identification of patients at risk for AKI.
The “Inflammation and Host Response to Injury” (Glue Grant) is a collaborative program supported by the National Institute of General Medical Sciences. As part of this study, a large clinical database of patients with extensive burn injury has been maintained. In the context of this prospective cohort study, we sought out to investigate the incidence of late AKI and employed decision analysis methods, specifically classification and regression tree (CART), to examine complex interactions and identify patients at risk for late AKI early in their hospital course.
In contrast to traditional statistical modeling methods, CART divides the data set into subgroups (segmentation), stratifying individuals based on the desired outcome(s) to create a set of decision rules (23). CART is a nonparametric analysis that simultaneously examines interactions between multiple variables to create a decision tree (23, 24). Researcher bias is limited as CART can use large numbers of variables to create a decision tree. The resulting tree is not evaluated with traditional statistical tests (p values), but instead the classification accuracy is tested on an independent set of data or with cross-validation techniques applied to the same dataset. To date, there are no studies in either the general surgery or trauma literature that employ these methods to predict an outcome such as AKI, but this method has been used extensively in industry and other medical fields (25-27).
Methods
Study Design
We conducted a retrospective cohort study of prospectively acquired data to identify predictive factors for developing late AKI in the context of a prospective multicenter observational study and then analyzed our results in a second population to validate our results. CART analysis was used to predict which patients were at risk for developing late AKI. Specifically, we were interested in early (within the first 48 hours post-injury) clinical characteristics that predict late AKI (defined as AKI occurring after the resuscitative phase, or first 48 hours). After first characterizing AKI in critically ill burn patients using the Glue Grant's Trauma-Related Database (TRDB), we then entered early patient data into CART analysis, creating a simple decision tree that identified patients who subsequently developed late AKI. Finally, after developing our decision tree in the Glue Grant database, we then tested the accuracy of the decision tree with a smaller, retrospective database from our own institution.
Patients and Data Collection
For the first study population and identification of predictive factors associated with late AKI, eligible subjects included all 220 adults with complete outcome data enrolled in the burn component of the Glue Grant's TRDB as of August 15, 2008. Criteria for adult patient enrollment into the Glue Grant study were age ≥ 18 years, burn size ≥ 20% total body surface area (TBSA), no other concomitant trauma, and admission to the study center within 96 hours of injury. Patients who were not resuscitated and placed on comfort care were not eligible for enrollment (28).
To validate the decision tree created with the Glue Grant dataset we analyzed patients treated at the LUMC burn center. In this process, we conducted a retrospective chart review of 1,688 consecutive burn center admissions between January 1, 2006 and December 31, 2008. Patients at least 18 years old with burns of 20% or greater TBSA were selected. Patients with toxic epidermal necrolysis syndrome (TENS), necrotizing fasciitis, or other soft tissue infections were excluded from further analysis. Also excluded were seven patients that did not survive beyond 48 hours, as these patients were also likely not included in the Glue Grant study. Patients meeting these criteria but who had enrolled in the Glue Grant Study were excluded to eliminate duplications. This left 89 LUMC patients who met our inclusion criteria.
For our analysis of the LUMC patients, we extracted the same data that was included from the TRDB. This included patient factors such as age, sex, race, height, and weight as well as injury features such as burn mechanism, %TBSA burned, presence of inhalation injury, resuscitation volume, urine output, transfusion requirements, and the need for mechanical ventilation on admission and laboratory findings such as the highest and lowest values from the first 24 hours of admission for sodium, potassium, base deficit, pH, and glucose as well as early creatinine values, and the highest creatinine during the hospitalization.
All of the pre-existing comorbidities and medications were also recorded, and a complete listing of all these variables can be found in the supplementary table. Pertinent outcomes from the hospital course such as treatment with dialysis, type of dialysis, and hospital survival were also collected. This study was conducted following approval by the Glue Grant administrative core and by the LUMC institutional review board.
Definitions
We defined AKI based on the Acute Dialysis Quality Initiative's RIFLE (Risk, Injury, Failure, Loss, and End stage kidney disease) classification which utilizes serum creatinine and urine output criteria to grade severity of AKI in critically ill patients (12). The RIFLE score was calculated by assessing incremental increases in serum creatinine and urine output as has been reported previously (10, 17). Early AKI was defined as the worst RIFLE score within the first 48 hours. When urine output data was not available, the worst early RIFLE score was obtained using the creatinine values alone. Because baseline creatinine levels were not available for patients enrolled in the Glue Grant study or from LUMC and the initial creatinine level at hospital admission likely reflects the effects of the burn injury that occurred before admission or during the initial phase of care, baseline creatinine values were estimated by age, race, and sex according the modification of diet in renal disease equation as has been done by other investigators (12).
Late AKI was defined by calculating a RIFLE score using the highest creatinine value obtained during the patient's hospital stay. Urine output data was not available for either the Glue Grant patients or those from our own database after resuscitation. Therefore, if the highest creatinine value indicated an increase of at least one and a half times the baseline (corresponding to the “Risk” category), then the patient was considered to have late AKI. The RIFLE score is calculated by adding 1 point for each successive category obtained by the RIFLE criteria (i.e, 1 point for “Risk,” 2 points for “Injury,” etc). Progressive AKI was defined as those patients with early AKI whose RIFLE score either remained the same or got worse at later time points.
Data Analysis
We compared baseline patient and clinical characteristics between patients with and without AKI including age, sex, ethnicity, %TBSA, burn mechanism, presence of inhalation injury, Denver multiorgan failure score at 24 hours and maximal Denver score, resuscitation volume, urine output, abdominal compartment syndrome, escharotomy, and decompression laparotomy. Total fluid volume (including colloid and crystalloid) administered in the first 24 hours after injury was examined as a function of the volume predicted by the Parkland Formula (4ml/kg/%TBSA). Acute respiratory distress syndrome (ARDS), progression of AKI defined by worsening RIFLE classification, initiation of RRT, development of MODS, and discharge status were recorded for each patient.
Since late AKI is often associated with MODS, we used the Non-renal Organ Failure (NROF) score as a marker of MODS that eliminates the AKI component and serves as an indicator of the degree of systemic illness during the resuscitative phase. The NROF score creates a modified Denver score by assigning one point for each non-renal organ system (cardiac, pulmonary, or hepatic) in dysfunction (29). Patient comorbidities were recorded and then used to create a Charlson score as an index of each patient's overall pre-existing level of health (30). This index has been used previously in the burn population (17).
Statistical analyses were performed with STATA software, version 10.0 (Stata Corporation, College Station, TX). The Fisher's exact test or chi-square test was used to compare qualitative data while the student's t-test was used for continuous variables. When comparing values from more than 2 groups, ANOVA or the Kruskal-Wallis test was used for continuous variables where appropriate. Differences were considered statistically significant if p<0.05.
CART (CART® 6.0; Salford Systems, San Diego, CA) was used to analyze the interactions between 33 different predictor variables (see Supplementary Table for list of variables included) and the outcome of interest, late AKI. CART analysis was used to grow a decision tree using the Gini splitting function with maximum tree depth of five and a minimum number of parent node cases of 30 while the minimum number of cases for the child nodes was set at 10.
Results
Patient & Injury Characteristics
Baseline characteristics for both the Glue Grant and LUMC datasets are displayed in Table 1. Two hundred twenty patients in the Glue Grant study and 89 patients from LUMC met our inclusion criteria (Table 1). The average age in the Glue Grant dataset was 42.4 years while the average age in the LUMC dataset was 46.2 years (p = 0.07) (Table 1). As expected, most patients were male (72.9% in the Glue Grant, 76.4% in the LUMC set, p = 0.52), and the most common injury type was a flame burn (Table 1). The majority of patients were Caucasian although the LUMC component contained significantly fewer Caucasian patients compared to the Glue Grant dataset (67.9% vs. 53.9%, p = 0.02) (Table 1). Average burn size was larger in the Glue Grant (43.1% TBSA vs. 38.2%TBSA, p = 0.02), although more patients from LUMC suffered inhalation injury (42.7% vs. 39.1%, p <0.01) (Table 1).
TABLE 1. Baseline Characteristics in Glue Grant and LUMC datasets.
| Variable | Glue Grant (n = 220) | LUMC (n = 89) | p value |
|---|---|---|---|
| Age | 42.38 (16.15) | 46.20 (1.95) | 0.07 |
| % Male | 161 (72.85) | 68 (76.40) | 0.52 |
| BMI (kg/m2) | 28.50 (11.01) | 27.98 (15.48) | 0.74 |
| Race: | |||
| Caucasian | 150 (67.87) | 48 (53.93) | 0.02 |
| African-American | 30 (13.57) | 17 (19.10) | 0.22 |
| Hispanic | 29 (13.12) | 6 (6.74) | 0.32 |
| Asian | 5 (2.26) | 6 (6.74) | 0.54 |
| American Indian | 11 (4.98) | 2 (2.25) | 0.79 |
| Median Charlson score | 0 (1.27) | 1 (1.12) | <0.01 |
| Number of medications | 1 (1.60) | 1.01 (1.34) | 0.95 |
| % TBSA | 43.11 (16.13) | 38.20 (19.18) | 0.02 |
| Burn Mechanism: | |||
| Flame | 185 (83.71) | 75 (84.27) | 0.90 |
| Flash | 15 (6.79) | 1 (1.12) | 0.04 |
| Scald | 8 (3.62) | 7 (7.87) | 0.12 |
| Other | 0 (0) | 1 (1.12) | 0.11 |
| Median Non-Renal Organ Failure (NROF) | 0 (0.68) | 1 (0.83) | <0.01 |
| Inhalation Injury | 86 (39.09) | 38 (42.70) | <0.01 |
| Intubated on arrival | 132 (60.00) | 50 (56.18) | 0.54 |
Data are reported as means (± SD) or percentage, where appropriate. LUMC, Loyola University Medical Center; BMI, body mass index; %TBSA, percent total body surface area
Comparing the LUMC and Glue Grant patients, it is important to note that the LUMC patients presented with more comorbidities as measured by the median Charlson comorbidity index (1 vs. 0, p <0.01) and experienced more organ dysfunction as measured by their median NROF score (1 vs. 0, p<0.01) (Table 1).
Differences Observed by AKI Type
To identify patients in the Glue Grant with early and late AKI, RIFLE scores were used to divide patients into four groups: those with no renal dysfunction at any time, those with early AKI, those with late AKI, and those with progressive AKI. Using this classification scheme, 117 of the 220 total patients (53.2%) did not suffer any renal dysfunction during their hospitalization, 49 patients (22.3%) suffered early AKI, 39 patients (17.7%) suffered late AKI, and16 patients (7.3%) developed progressive AKI (Table 2).
TABLE 2. Patient and Clinical Characteristics by AKI Type.
| Variable | No AKI (n = 117) (52.94%) | Early AKI (n = 49) (22.17%) | Late AKI (n = 39) (17.65%) | Progressive AKI (n = 16) (7.24%) | p value |
|---|---|---|---|---|---|
| PATIENT CHARACTERISTICS | 38.07 (14.02) | 48.84 (18.74) | 42.00 (12.80) | 55.06 (17.73) | <0.01 |
| Age | |||||
| % Male | 83 (70.94) | 34 (69.39) | 30 (76.92) | 14 (87.50) | 0.46 |
| Caucasian | 86 (73.50) | 40 (81.63) | 24 (61.54) | 8 (50.00) | 0.04 |
| Charlson Score | 0.20 (0.58) | 0.90 (1.66) | 0.67 (1.34) | 1.00 (1.03) | <0.01 |
| Number of Medications | 0.67 (1.17) | 1.49 (1.84) | 1.10 (2.07) | 1.69 (1,82) | <0.01 |
| INJURY CHARACTERISTICS | |||||
| % TBSA | 38.78 (13.99) | 49.53 (18.68) | 42.77 (12.82) | 55.94 (17.67) | <0.01 |
| Flame Burn | 96 (82.05) | 38 (77.55) | 36 (92.31) | 15 (93.75) | 0.18 |
| Intubated on Admit | 56 (47.86) | 30 (61.22) | 33 (86.84) | 13 (81.25) | <0.01 |
| Inhalation Injury | 29 (25.00) | 22 (44.90) | 25 (64.10) | 10 (62.50) | <0.01 |
| NROF | 0.37 (0.52) | 0.53 (0.62) | 0.95 (0.60) | 1.63 (0.89) | <0.01 |
| Parkland Score | 1.30 (0.64) | 1.30 (0.48) | 1.36 (0.54) | 1.18 (0.57) | 0.82 |
| LABORATORY VALUES | |||||
| Highest Cr (mg/dL) | 0.947 (0.22) | 1.40 (0.80) | 3.60 (2.00) | 5.12 (1.89) | <0.01 |
| Lowest Hematocrit | 42.50 (6.42) | 43.73 (8.04) | 42.42 (7.96) | 39.25 (7.67) | 0.20 |
| 24 Hr Highest K | 4.50 (0.69) | 4.75 (0.84) | 4.52 (0.78) | 4.69 (0.77) | 0.19 |
| 24 Hr Highest Na | 138.54 (2.86) | 138.35 (4.10) | 138.03 (3.69) | 139.88 (2.42) | 0.30 |
| 24 Hr Lowest Na | 135.66 (3.02) | 136.12 (3.55) | 134.87 (3.50) | 137.13 (3.38) | 0.10 |
| Admission BD | -4.23 (3.60) | -5.41 (3.66) | -6.75 (5.02) | -8.70 (8.10) | <0.01 |
| 24 Hr Worst BD | -5.23 (3.80) | -6.69 (3.54) | -8.29 (5.04) | -10.33 (7.86) | <0.01 |
| 24 Hr Lowest pH | 7.31 (0.08) | 7.28 (0.10) | 7.24 (0.09) | 7.17 (0.17) | <0.01 |
| 24 Hr Highest glucose | 174.61 (44.21) | 178.52 (56.33) | 202.92 (66.80) | 237.88 (98.64) | <0.01 |
| 24 Hr Lowest glucose | 109.00 (23.18) | 119.89 (41.83) | 105.00 (28.05) | 86.50 (24.31) | <0.01 |
| VITAL SIGNS | |||||
| 24 Hr Lowest MAP | 70.44 (16.13) | 64.13 (14.20) | 59.88 (12.72) | 57.60 (11.64) | <0.01 |
| Admission temp(°C) | 36.39 (1.02) | 36.11 (1.20) | 35.72 (1.55) | 35.73 (1.18) | 0.01 |
| 24 Hr Lowest temp(°C) | 35.84 (0.98) | 35.69 (1.13) | 35.29 (1.42) | 35.48 (1.04) | 0.06 |
|
|
|||||
Data are reported as means (± SD) or percentage, where appropriate. AKI, acute kidney injury; Cr, creatinine; BD, base deficit; MAP, mean arterial pressure
Table 2 provides patient, injury, and clinical data according to AKI type. The progressive AKI subset was statistically older with more comorbidities than those with early or late AKI and was the group with the highest NROF scores (p<0.001) (Table 2). Accordingly, this group had the worst survival, with only 18.8% of the progressive AKI group surviving, compared to 79.6% and 64.1% in the early and late AKI groups, respectively. The highest percentage of patients intubated on arrival to the burn center occurred in the late AKI group (86.8%), and this group also had the highest incidence of inhalation injury (64.1%) (p<0.001). There were no differences between the groups in terms of the resuscitative volume administered as measured by the fraction of Parkland resuscitation received (Table 2).
Laboratory and clinical values obtained within the first 24-hour period were notable for worsening base deficit in the groups with late or progressive AKI. Additionally, the progressive AKI group also displayed the worst glucose control, having both the highest and lowest mean glucose levels among the four groups (Table 2).
Renal Replacement Therapy, MODS, and Length of Stay
Table 3 describes the four groups in their need for dialysis, mode of renal replacement therapy (RRT), development of late MODS, hospital length of stay (LOS), and hospital mortality. None of the patients with early AKI were treated with hemodialysis whereas 75% of those with progressive AKI and 33% of those with late AKI were treated with hemodialysis (Table 3). Patients were classified by dialysis type according to the modality used for the greatest number of days during their hospitalization. Most patients, however, were treated with a combination of intermittent and continuous hemodialysis as their hemodynamic condition dictated. Notably, from a cost of care and ongoing utilization of resources standpoint, of the patients treated with hemodialysis, only 23.1% of the patients with late AKI needed dialysis at discharge compared to 62.5% of those with progressive AKI (Table 3).
TABLE 3. Renal failure characteristics and hospital outcomes.
| Variable | No AKI (n = 117) | Early AKI (n = 49) | Late AKI (n = 39) | Progressive AKI (n = 16) | p value |
|---|---|---|---|---|---|
| Early RIFLE score | 0 (0) | 1.82 (0.67) | 0 (0) | 1.5 (0.52) | <0.01 |
| Late RIFLE score | 0 (0) | 0.35 (0.73) | 2.23 (0.90) | 2.89 (0.34) | <0.01 |
| Highest Serum Cr (mg/dL) | 0.947 (0.22) | 1.40 (0.80) | 3.60 (2.00) | 5.12 (1.89) | <0.01 |
| Hemodialysis | 0 (0) | 0 (0) | 13 (33.33) | 12 (75.00) | <0.01 |
| Intermittent | 0 (0) | 0 (0) | 7 (17.95) | 6 (37.50) | <0.01 |
| Continuous | 0 (0) | 0 (0) | 6 (15.38) | 6 (37.50) | <0.01 |
| Dialysis at discharge | 0 (0) | 0 (0) | 9 (23.08) | 10 (62.50) | 0.41 |
| Late MODS | 5 (4.27) | 12 (24.49) | 24 (61.54) | 15 (93.75) | <0.01 |
| Length of stay (days) | 37.38 (32.72) | 47.23 (32.97) | 71.22 (50.35) | 26.67 (20.80) | <0.01 |
| Hospital Survival | 111 (94.87) | 39 (79.59) | 25 (64.10) | 3 (18.75) | <0.01 |
Data are reported as means (± SD) or percentage, where appropriate. AKI, acute kidney injury
RIFLE score is calculated as follows: Risk = 1 point, Injury = 2 points, Failure = 3 points, Loss = 4 points, End stage = 5 points
Since renal dysfunction frequently occurs as part of MODS, we also examined rates of MODS by AKI type. MODS was rare (4.3%) in those patients not suffering any type of AKI; however, 24.5% of patients with early AKI and 61.5% of those with late AKI experienced MODS (Table 3). The highest incidence of MODS (93.8%) occurred in the progressive AKI group (Table 3). Interestingly, patients with late AKI had the longest length of stay (LOS) at an average of 71 days and patients with progressive AKI had the shortest LOS at 27 days, as many died relatively early.
CART Analysis for Late AKI
To create the CART decision tree, 33 separate predictor variables were entered into the software to classify patients who later would develop the outcome of interest, late AKI. Variables included clinical, demographic, and laboratory values usually obtained within the first 24 hours of admission (See Supplementary Table for a full listing of variables entered into CART). Since we sought a simple decision tree that could be employed at the bedside to identify patients at risk for late AKI early in their hospital course, we chose variables that would be readily obtained within the first 48 hours of admission. In addition, we limited the number of derived variables to the Charlson score and NROF score.
The CART tree grown with the Glue Grant dataset contained four levels (Figure 1). The most important factor was the NROF score, as 88.3% of those with an NROF score of zero did not suffer late AKI (Table 1). Of patients with an NROF score of greater than or equal to one, the next most important predictor was the worst base deficit obtained within the first 24 hours of admission. The second terminal node contained those patients having a worst 24 hour base deficit of less than or equal to -11.4 with 75% of these patients suffering late AKI. In the group with a 24 hour base deficit of greater than -11.4, the next most important determinant of late AKI was a lowest 24 hour glucose measurement of less than or equal to 83 mg/dL. In this group, 68.8% of patients suffered late AKI. The final split among patients with a lowest glucose of greater than 83 mg/dL was whether or not they received a transfusion during the resuscitative phase (Figure 1). In this final level of the tree, the terminal nodes were the least decisive, demonstrated by only 56.3% of transfused patients developing late AKI.
Figure 1.
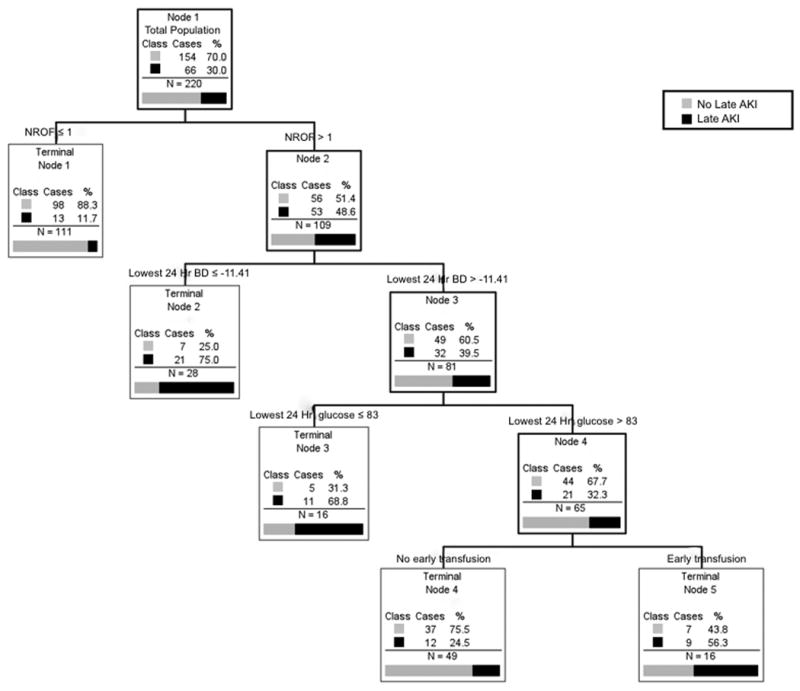
Classification and Regression Tree (CART) analysis to predict late AKI. Titles above the boxes indicate predictor variables (and appropriate limits) while the boxes contain data on how each predictor split the subjects within that group according to the outcome (Late AKI). Patients who suffered late AKI are coded as black while those not suffering late AKI are gray as indicated. Terminal nodes provide the best division of the data according to the outcome of interest and could not be split further based on the Gini function and the limits of tree growth set by the investigators (see Methods section). AKI, acute kidney injury, NROF, non-renal organ failure score, Lowest 24 Hr BD, the lowest base deficit value obtained within the first 24 hours of admission, Lowest 24 Hr glucose, the lowest glucose value obtained within the first 24 hours of admission.
This decision tree had an overall classification accuracy of 80% (Table 4) for the Glue Grant dataset. To validate these findings in another separate dataset, we tested this tree using the LUMC data where it had an overall accuracy of 73.3% (Table 4).
TABLE 4. Classification Accuracy of CART Analysis.
| Total Cases | Classification by CART | % Correct | Total Cases | Classification by CART | % Correct | ||||||
|---|---|---|---|---|---|---|---|---|---|---|---|
|
|
|
||||||||||
| - Late AKI | + Late AKI | - Late AKI | + Late AKI | ||||||||
|
|
|
||||||||||
| Actual Class | - Late AKI | 154 | 135 | 19 | 87.66 | Actual Class | - Late AKI | 52 | 43 | 9 | 82.69 |
| + Late AKI | 66 | 25 | 41 | 62.12 | + Late AKI | 37 | 15 | 22 | 59.46 | ||
|
|
|
||||||||||
| Total | 220 | Overall % Correct | 80.00 | Total | 89 | Overall % Correct | 73.03 | ||||
|
|
|
||||||||||
Training Set: Glue Grant
Testing Set: LUMC
CART, Classification and regression tree; AKI, Acute kidney injury
It is important to note that the CART software created these segmentations in the continuous or ordinal variables to best categorize the patients with late AKI. Neither the predictive variables nor the cutoff values were empiric or arbitrary choices by the investigators.
Discussion
This study provides a modern description of AKI among adult patients with severe burns. Unlike reports from the last century (1), that include patients with varying severity, onset, and etiology of AKI, we have provided a structured definition of AKI based on the RIFLE criteria. Using a large, prospectively collected multi-institutional database, we were able to distinguish early (occurring during the resuscitative phase) from late (occurring after the resuscitative phase) AKI, and we found significant differences in outcomes between these two groups. Survival with early AKI was better (79.6%) than with late AKI (64.1%) and late AKI was also associated with both early and late organ failure (Tables 2 and 3).
We also noted that those with progressive AKI had more comorbidities, the worst organ failure scores (NROF), and the lowest survival (18.8%) (Table 2). While none of the patients with early AKI were treated with dialysis and one third of those with late AKI were treated with dialysis, the highest dialysis use (75%) occurred in the progressive AKI group and 62.5% of these patients continued dialysis at the time of discharge (Table 3). In comparison, only 23.1% of those with late AKI were being dialyzed at discharge, indicating that most patients with late AKI regained enough renal function to be liberated from renal replacement therapy and that progressive AKI is a different entity from early or late AKI.
It is important to contrast our 17.7% rate of late AKI with recent reports of AKI using the RIFLE criteria. The first use of RIFLE criteria in the burned population was by Coca et al. who report an overall 27% rate of AKI, but they included patients with 10% TBSA or greater, used the lowest creatinine value in the first five days as a baseline, and used the highest creatinine value of the hospitalization to create a RIFLE score (15). Their reported mortality of 60% with the Failure class, is similar to our mortality for late AKI of 64.1% (Table 2), but they did not distinguish between early or late AKI and analyzed smaller burns (15). Mosier and colleagues found that patients with early AKI had a higher mortality and greater incidence of early MODS than patients without early AKI and also identified differences between early, progressive, and late AKI (17). Clearly, the timing of AKI onset significantly effects outcomes, as those with late AKI suffer more MODS and worse mortality (Table 2 and 3), but it is not as dismal of a prognosis of 80 to 100% mortality as previously reported in the last century (1, 2, 4, 19, 31). Defining the subset of patients with progressive AKI distinguishes the group of patients with the worst survival (18.8%), and we feel that these classifications will be important in stratifying patients for evaluation of novel AKI therapies in the future.
With this in mind, we created a decision tree using CART analysis to identify patients at risk for late AKI early in their hospital course. Our goal was to create a simple decision tool that could be used at the bedside. The resulting decision tree was four levels. Not surprisingly, the NROF score was the best variable for classifying patients at risk for late AKI (Figure 1). Late AKI has long been associated with sepsis and MODS (1, 32, 33). Additionally, MODS and late kidney injury have been associated with inhalation injury (1, 7, 33), but our decision tree does not include inhalation injury. Although univariate analysis found significant differences in the percentage of inhalation injury between those with none, early, or late AKI, there were a significant number of patients with inhalation injury among those that did not suffer any AKI or who only experienced early AKI (25% and 44.9%, respectively, Table 2). The mathematical driving force behind CART analysis is to develop a “pure” node where 100% of its subjects can be classified as having a particular outcome. Therefore, inhalation injury proved less powerful in its ability to split the group into a “pure” node. A NROF score of zero, on the other hand, provided a terminal node where 88% of its occupants did not suffer late AKI (Figure 1).
For patients with a NROF score of one or greater, their worst base deficit within the first 24 hours proved best in its ability to split the group according to the outcome of interest, late AKI (Figure 1). Numerous studies in both humans and animal models have demonstrated a relationship between early base deficit, MODS, and death (34-38). Most of these reports find that early base deficits correlate with a more severe inflammatory response, tissue malperfusion, and higher fluid requirements. This has led some to suggest real-time monitoring of acid-base status with therapy specifically directed at this end-point rather than traditional end-points of urine output or mean arterial pressure (37-39). Volumes of resuscitation did not differ between those without AKI, early AKI, or late AKI (Table 2), and although Parkland score was a variable input into the CART software (Supplementary Table), it was not selected for the decision tree. Alterations in acid-base status may reflect kidney malperfusion, or an early subclinical renal injury, while traditional markers of urine output and hemodynamic parameters are preserved; as other investigators have noted a higher incidence of ARDS and MODS with a 24 hour base deficit < -6 (40).
Among those with less severe base deficit, lowest glucose within the first 24 hours split the group into those with late AKI (lowest glucose ≤ 83 mg/dL) versus those without late AKI (lowest glucose > 83 mg/dL). Hyperglycemia has long been associated with poor outcomes in both burn and trauma patients (41-45). Pidcoke and colleagues have demonstrated an increased mortality associated with glucose variability, as opposed to hyperglycemia alone (46). Here, the lowest glucose reading within the first 24 hours may be a marker for glucose variability or may highlight the increased mortality observed with hypoglycemic events that occur with intensive insulin therapy (47). Other proposed mechanisms include increased muscle catabolism and modulation of the innate immune response (42, 48).
This last point underscores CART's ability to uncover layered relationships not immediately obvious with simple observation or univariate analysis. For example, the decision tree depicts a connection between those with NROF score of one or greater, worst base deficit, lowest glucose, and blood transfusion within the first 24 hours of admission (Figure 1). Such a relationship was not immediately obvious either by intuition or traditional statistical methods (Table 2), illustrating this method's power in discerning and displaying these relationships in an intuitive, visual output that can easily be converted into clinically useful algorithms.
The final layer in our decision tree indicated that among those with a lowest 24-hour glucose of greater than 83 mg/dL, a blood transfusion during this same early period best divided the group into those with late AKI versus those who did not have late AKI, although this last layer is less “pure” than some of the terminal nodes higher in the tree. As an example, 56.3% of those who received a blood transfusion within the first 24 hours subsequently developed late AKI. Nonetheless, blood product transfusion has been associated with increased complications, including MODS and death in trauma, burn, and critically ill patients (49-51). The only direct link between blood product transfusion and kidney injury occurs with antigen mismatch or other immunologic reactions. Given this variable's lack of discerning power for late AKI, it may simply be a marker for late MODS or severity of injury.
This last level of the decision tree illustrates how CART lacks explanatory capability. Variables that prove best at subdividing patients according to outcome of interest might not be causal factors. Rather, they could be markers for etiologic variables either not collected, or data that is not predictive because of how it is coded. The latter might certainly be the case in this large, multi-institutional database.
Another limitation of the study is that the Glue Grant TRDB was prospectively gathered while the data from LUMC was retrospectively collected. This might account for the decreased classification accuracy within the LUMC dataset. An accuracy of 73% in the testing set and 80% in the learning set; however, is in line with many published results using this same method, and often trees are developed and published without any evaluation of its performance on a separate dataset as we have done here (27, 52-54).
Conclusion
This study generated a prediction tool that utilized clinical and laboratory information already part of routine practice. The CART decision tree created was highly accurate within a large multi-institutional dataset, and its accuracy remained when tested in a smaller, single institution population that was slightly older and had more comorbidities than the learning set (Table 1). If new strategies for early intervention are to be successful in further improving survival for burn patients who suffer late AKI, then early identification of patients at risk is necessary. The next phase of this study will be a prospective examination of its predictive capability at our own institution. We feel that this tool will also be useful for selecting patients in randomized studies that are evaluating newer treatment or prevention strategies for late AKI.
Here, we have provided a simple tool for early identification of burn patients at risk for late AKI that can be used for developing clinical pathways, designing clinical trials, and improving care for this complication that remains less deadly but still challenging.
Supplementary Material
Supplementary table. Variables in cart analysis:
CART, Classification and Regression Tree, %TBSA, percent total body surface area, NROF, non-renal organ failure, AKI, acute kidney injury, BMI, body mass index, kg, kilograms, m2, meters squared, ACE, angiotensin-converting enzyme, NSAID, non-steroidal anti-inflammatory drugs, K, potassium, Na, sodium, hr, hour, MAP, mean arterial pressure
Acknowledgments
We acknowledge the contribution of the Inflammation and the Host Response to Injury Large-Scale Collaborative Project Award 2-U54-GM062119 from the National Institute of General Medical Sciences.
The Inflammation and the Host Response to Injury “Glue Grant” program is supported by the National Institute of General Medical Sciences. This article was prepared using a dataset obtained from the Glue Grant program and does not necessarily reflect the opinions or views of the Inflammation and Host Response to Injury Investigators or the National Institute of General Medical Sciences.
References
- 1.Holm C, Horbrand F, von Donnersmarck GH, et al. Acute renal failure in severely burned patients. Burns. 1999;25:171–8. doi: 10.1016/s0305-4179(98)00144-2. [DOI] [PubMed] [Google Scholar]
- 2.Chrysopoulo MT, Jeschke MG, Dziewulski P, et al. Acute renal dysfunction in severely burned adults. J Trauma. 1999;46:141–4. doi: 10.1097/00005373-199901000-00024. [DOI] [PubMed] [Google Scholar]
- 3.Vertel RM, Knochel JP. Nonoliguric acute renal failure. JAMA. 1967;200:598–602. [PubMed] [Google Scholar]
- 4.Davies DM, Pusey CD, Rainford DJ, et al. Acute renal failure in burns. J Plast Reconstr Surg. 1979;13:189–92. doi: 10.3109/02844317909013054. [DOI] [PubMed] [Google Scholar]
- 5.Davies MP, Evans J, McGonigle RJS. The dialysis debate: acute renal failure in burns patients. Burns. 1994;20:71–3. doi: 10.1016/0305-4179(94)90111-2. [DOI] [PubMed] [Google Scholar]
- 6.Cason JS, editor. Transactions of the II International Congress on Research in Burns. Edinburgh; Livingstone: 1966. [Google Scholar]
- 7.Cameron JS, Miller-Jones CMH. Renal function and renal failure in badly burned patients. Br J Surg. 1967;54:132. doi: 10.1002/bjs.1800540213. [DOI] [PubMed] [Google Scholar]
- 8.Leblanc M, Thibeault Y, Querin S. Continuous haemofiltration and haemodiafiltration for acute renal failure in severely burned patients. Burns. 1997;23:160–5. doi: 10.1016/s0305-4179(96)00085-x. [DOI] [PubMed] [Google Scholar]
- 9.Mustonen KM, Vuola J. Acute Renal Failure in Intensive Care Burn Patients. J Burn Care Res. 2008;29:227–37. doi: 10.1097/BCR.0b013e31815f3196. [DOI] [PubMed] [Google Scholar]
- 10.Ricci Z, Cruz D, Ronco C. The RIFLE criteria and mortality in acute kidney injury: A systematic review. Kidney International. 2008;73:538–46. doi: 10.1038/sj.ki.5002743. [DOI] [PubMed] [Google Scholar]
- 11.Ostermann M, Chang RW. Acute kidney injury in the intensive care unit according to RIFLE. Crit Care Med. 2007;35:1837–43. doi: 10.1097/01.CCM.0000277041.13090.0A. [DOI] [PubMed] [Google Scholar]
- 12.Bellomo R, Ronco C, Kellum JA, et al. Acute renal failure - definition, outcome measures, animal models, fluid therapy, and information technology needs: the second international consensus conference of the acute dialysis quality initiative (ADQI) group. Crit Care. 2004;8:R204–R12. doi: 10.1186/cc2872. [DOI] [PMC free article] [PubMed] [Google Scholar]
- 13.Hoste EA, Clermont G, Kersten A, et al. RIFLE criteria for acute kidney injury are associated with hospital mortality in critically ill patients: a cohort analysis. Crit Care. 2006;10:R73. doi: 10.1186/cc4915. [DOI] [PMC free article] [PubMed] [Google Scholar]
- 14.Bagshaw SM, George C, Dinu I, Bellomo R. A multi-centre evaluation of the RIFLE criteria for early acute kidney injury in critically ill patients. Nephrol Dial Transplant. 2008;23:1203–10. doi: 10.1093/ndt/gfm744. [DOI] [PubMed] [Google Scholar]
- 15.Coca SG, Bauling P, Schifftner T, Howard CS, Teitelbaum I, Parikh CR. Contribution of acute kidney injury toward morbidity and mortality in burns: a contemporary analysis. Am J Kidney Dis. 2007;49:517–23. doi: 10.1053/j.ajkd.2006.12.018. [DOI] [PubMed] [Google Scholar]
- 16.Chung KK, Juncos LA, Wolf SA, Mann EE, Renz EM, White CE, et al. Continuous renal replacement therapy improves survival in severely burned military casualties with acute kidney injury. J Trauma. 2008;64:S179–S87. doi: 10.1097/TA.0b013e3181608676. [DOI] [PubMed] [Google Scholar]
- 17.Mosier MJ, Pham TN, Klein MB, Gibran NS, Arnoldo BD, Gamelli RL, et al. Early acute kidney injury predicts progressive renal dysfunction and higher mortality in severely burned adults. J Burn Care Res. 2010;31:83–92. doi: 10.1097/BCR.0b013e3181cb8c87. [DOI] [PMC free article] [PubMed] [Google Scholar]
- 18.McGwin G, George RL, Cross JM, Rue LW. Improving the ability to predict mortality among burn patients. Burns. 2008;34:320–7. doi: 10.1016/j.burns.2007.06.003. [DOI] [PubMed] [Google Scholar]
- 19.Miller SF, Bessey PQ, Schurr MJ, Browning SM, Jeng JC, Caruso DM, et al. National Burn Repository 2005: A ten-year review. J Burn Care Res. 2006;27:411–36. doi: 10.1097/01.BCR.0000226260.17523.22. [DOI] [PubMed] [Google Scholar]
- 20.Venkataraman R, Subramanian S, Kellum JA. Clinical review: extracorporeal blood purification in severe sepsis. Crit Care. 2003;7:139–45. doi: 10.1186/cc1889. [DOI] [PMC free article] [PubMed] [Google Scholar]
- 21.Weksler N, Chorny I, Gurman GM, Shapira AR. High-volume slow continuous venovenous haemofiltration in septic non-oliguric burned patients. Ann Burns Fire Disasters. 1998;11:105–8. [Google Scholar]
- 22.Oudemans-van Straataen HM, Boseman RJ, van der Spoel JL, et al. Outcome in critically ill patients treated with intermittent high-volume haemofiltration: a prospective cohort analysis. Intensive Care Med. 1999;25:814–21. doi: 10.1007/s001340050957. [DOI] [PubMed] [Google Scholar]
- 23.Breiman L, Freidman J, Olshen RA, Stone CJ. Classification and regression trees. New York: Wadsworth; 1984. [Google Scholar]
- 24.Biggs D, de Ville B, Suen B. A method of choosing multiway partitions for classification and decision trees. J Appl Statistics. 1991;18:49–62. [Google Scholar]
- 25.Skidmore ER, Rogers JC, Chandler LS, Holm MB. Dynamic interactions between impairment and activity after stroke: examining the utility of decision analysis methods. Clin Rehabil. 2006;20:523–35. doi: 10.1191/0269215506cr980oa. [DOI] [PubMed] [Google Scholar]
- 26.McKee LA, Fabres J, Howard G, Peralta-Carcelen M, Carlo WA, Ambalavanan N. PaCO2 and neurodevelopment in extremely low birth weight infants. J Pediatr. 2009;155:217–21. doi: 10.1016/j.jpeds.2009.02.024. [DOI] [PubMed] [Google Scholar]
- 27.Falconer JA, Naughton BJ, Dunlop DD, Roth EJ, Strasser DC, Sinacore JM. Predicting stroke inpatient rehabilitation outcome using a classification tree approach. Arch Phys Med Rehabil. 1994;75:619–25. doi: 10.1016/0003-9993(94)90182-1. [DOI] [PubMed] [Google Scholar]
- 28.Silver GM, Klein MB, Herndon DN, Gamelli RL, Gibran NS, Altstein L, et al. Standard operating procedures for the clinical management of patients enrolled in a prospective study of Inflammation and the Host Response to Thermal Injury. J Burn Care Res. 2007;28:222–30. doi: 10.1097/BCR.0B013E318031AA44. [DOI] [PubMed] [Google Scholar]
- 29.Barrantes F, Tian J, Vazquez R, Amoateng-Adjepong Y, Manthous CA. Acute kidney-injury criteria predict outcomes of ciritcally ill patients. Crit Care Med. 2008;36:1397–403. doi: 10.1097/CCM.0b013e318168fbe0. [DOI] [PubMed] [Google Scholar]
- 30.Charlson M, Szatrowski TP, Peterson J, Gold J. Validation of a combined comorbidity index. J Clin Epidemiol. 1994;47:1245–51. doi: 10.1016/0895-4356(94)90129-5. [DOI] [PubMed] [Google Scholar]
- 31.Kim GH, Oh KH, Yoon JW, et al. Impact of burn size and initial serum albumin level on acute renal failure occurring in major burn. Am J Nephrol. 2003;23:55–60. doi: 10.1159/000066299. [DOI] [PubMed] [Google Scholar]
- 32.Boswick JA, et al. Critical care of the burned patient. Anesthesiology. 1997;47:164–70. doi: 10.1097/00000542-197708000-00007. [DOI] [PubMed] [Google Scholar]
- 33.Planas M, Wachtel T, Frank H, Henderson LW. Characterization of acute renal failure in the burned patient. Arch Intern Med. 1982;142:2087–91. [PubMed] [Google Scholar]
- 34.Jeng JC, Jablonski K, Bridgeman A, Jordan MH. Serum lactate, not base deficit, rapidly predicts survival after major burns. Burns. 2002;28:161–6. doi: 10.1016/s0305-4179(01)00098-5. [DOI] [PubMed] [Google Scholar]
- 35.Kaups KL, Davis JW, Dominic WJ. Base deficit as an indicator of resuscitation needs in patients with burn injuries. J Burn Care Rehabil. 1998;19:346–8. doi: 10.1097/00004630-199807000-00013. [DOI] [PubMed] [Google Scholar]
- 36.Jeng JC, Lee K, Jablonski K, Jordan MH. Serum lactate and base deficit suggest inadequate resuscitation of patients with burn injuries: application of a point-of-care laboratory instrument. J Burn Care Rehabil. 1997;18:402–5. doi: 10.1097/00004630-199709000-00005. [DOI] [PubMed] [Google Scholar]
- 37.Light TD, Jeng JC, Jain AK, Jablonski KA, Kim DE, Phillips TM, et al. Real-time metabolic monitors, ischemia-reperfusion, titration endpoints, and ultraprecise burn resuscitation. J Burn Care Rehabil. 2004;25:33–44. doi: 10.1097/01.BCR.0000105344.84628.C8. [DOI] [PubMed] [Google Scholar]
- 38.Cancio LC, Eleuterio G, Turner CE, Kypreos NG, Parker A, Holcomb JB. Base deficit and alveolar-arterial gradient during resuscitation contribute independently but modestly to the prediction of mortality after burn injury. J Burn Care Res. 2006;27:289–96. doi: 10.1097/01.BCR.0000216457.25875.F4. [DOI] [PubMed] [Google Scholar]
- 39.Holm C, Mayr M, Tegeler J, et al. A clinical randomized study on the effects of invasive monitoring on burn shock resuscitation. Burns. 2004;30:798–807. doi: 10.1016/j.burns.2004.06.016. [DOI] [PubMed] [Google Scholar]
- 40.Choi J, Cooper A, Gomez M, Fish J, Carlotto R. The 2000 Moyer Award. The relevance of base deficits after burn injuries. J Burn Care Rehabil. 2000;21:499–505. [PubMed] [Google Scholar]
- 41.Laird AM, Miller PR, Kilgo PD, Meredith JW. Relationship of early hyperglycemia to mortality in trauma patients. J Trauma. 2004;56:1058–62. doi: 10.1097/01.ta.0000123267.39011.9f. [DOI] [PubMed] [Google Scholar]
- 42.Gore DC, Chinkes DL, Hart DW, Wolf SE, Herndon DN, Sanford AP. Hyperglycemia exacerbates muscle protein catabolism in burn-injured patients. Crit Care Med. 2002;30:2438–42. doi: 10.1097/00003246-200211000-00006. [DOI] [PubMed] [Google Scholar]
- 43.Mowlavi A, Andrews K, Milner S, Herndon DN, Heggers JP. The effects of hyperglycemia on skin graft survival in the burn patient. Ann Plast Surg. 2000;45:629–32. doi: 10.1097/00000637-200045060-00010. [DOI] [PubMed] [Google Scholar]
- 44.Yendamuri S, Fulda GJ, Tinkoff GH. Admission hyperglycemia as a prognostic indicator in trauma. J Trauma. 2003;55:33–8. doi: 10.1097/01.TA.0000074434.39928.72. [DOI] [PubMed] [Google Scholar]
- 45.Van den Berghe G, Wouters P, Weekers F, et al. Intensive insulin therapy in the critically ill patients. N Eng J Med. 2001;345:1359–67. doi: 10.1056/NEJMoa011300. [DOI] [PubMed] [Google Scholar]
- 46.Pidcoke HF, Wanek SM, Rohleder LS, Holcomb JB, Wolf SE, Wade CE. Glucose variability is associated with high mortality after severe burn. J Trauma. 2009;67:990–5. doi: 10.1097/TA.0b013e3181baef4b. [DOI] [PubMed] [Google Scholar]
- 47.Intensive versus Conventional Glucose Control in Critically Ill Patients. New England Journal of Medicine. 2009;360(13):1283–97. doi: 10.1056/NEJMoa0810625. [DOI] [PubMed] [Google Scholar]
- 48.Van den Berghe G. How does blood glucose control with insulin save lives in intensive care? J Clin Invest. 2004;114:1187–95. doi: 10.1172/JCI23506. [DOI] [PMC free article] [PubMed] [Google Scholar]
- 49.Kopriva BM, Helmer SD, Smith RS. Jack A. Barney resident paper award: blood transfusions increase complications in moderately injured patients. Am J Surg. 2010;200:746–50. doi: 10.1016/j.amjsurg.2010.07.024. [DOI] [PubMed] [Google Scholar]
- 50.Johnson JL, Moore EE, Kashuk JL, Banerjee A, Cothren CC, Biffl WL, et al. Effect of blood products transfusion on the development of postinjury multiple organ failure. Arch Surg. 2010;145:973–7. doi: 10.1001/archsurg.2010.216. [DOI] [PubMed] [Google Scholar]
- 51.Napolitano LM, Kurek S, Luchette FA, Corwin HL, Barie PS, Tisherman SA, et al. Clinical practice guideline: red blood cell transfusion in adult trauma and critical care. Crit Care Med. 2009;37:124–57. doi: 10.1097/CCM.0b013e3181b39f1b. [DOI] [PubMed] [Google Scholar]
- 52.Liu Y, Wei LQ, Li GQ, Lv FY, Wang H, Zhang YH, et al. A decision-tree model for predicting extubation outcome in elderly patients after successful spontaneous breathing trial. Anesthesia & Analgesia. 2010;111:1211–8. doi: 10.1213/ANE.0b013e3181f4e82e. [DOI] [PubMed] [Google Scholar]
- 53.Delbaere K, Close JC, Heim J, Sachdev PS, Brodaty H, Slavin MJ, et al. A multifactorial approach to understanding fall risk in older people. J Am Ger Soc. 2010;58:1679–85. doi: 10.1111/j.1532-5415.2010.03017.x. [DOI] [PubMed] [Google Scholar]
- 54.Fulton-Kehoe D, Stover BD, Turner JA, Sheppard L, Gluck JV, Wickizer TM, et al. Development of a brief questionnaire to predict long-term disability. J Occupational & Environmental Med. 2008;50:1042–52. doi: 10.1097/JOM.0b013e31817d361e. [DOI] [PubMed] [Google Scholar]
- 55.Dennen P, Douglas IS, Anderson R. Acute kidney injury in the intensive care unit: an update and primer for the intensivist. Crit Care Med. 2010;38:261–75. doi: 10.1097/CCM.0b013e3181bfb0b5. [DOI] [PubMed] [Google Scholar]
- 56.Collins AJ, Foley R, Herzog C, et al. Excerpts from the United States Renal Data System 2007 annual data report. Am J Kidney Dis. 2008;2008(51):S1–S320. doi: 10.1053/j.ajkd.2007.11.001. [DOI] [PubMed] [Google Scholar]
Associated Data
This section collects any data citations, data availability statements, or supplementary materials included in this article.
Supplementary Materials
Supplementary table. Variables in cart analysis:
CART, Classification and Regression Tree, %TBSA, percent total body surface area, NROF, non-renal organ failure, AKI, acute kidney injury, BMI, body mass index, kg, kilograms, m2, meters squared, ACE, angiotensin-converting enzyme, NSAID, non-steroidal anti-inflammatory drugs, K, potassium, Na, sodium, hr, hour, MAP, mean arterial pressure