

Abstract
Traditional risk factors for premature cardiovascular disease such as systemic hypertension and hypercholesterolemia, all described more than half a century ago, are relatively few in number. Efforts to expand the epidemiological canon have met with limited success due to the high hurdle of causality. Fortunately, another solution to current deficiencies in risk assessment – in particular, the underestimation of risk both before and after initiation of pharmacotherapy – may exist. Parallel to the investigation of novel biomarkers, such as high-sensitivity C-reactive protein, ongoing research has yielded improved metrics of known causative conditions. This evolution of traditional risk factors, heralded by measures such as ambulatory blood pressure, central hemodynamics, low density lipoprotein particle concentration, genetic testing, and “vascular age,” may better address the detection gap in cardiovascular disease.
Keywords: prevention, cholesterol, lipoproteins, blood pressure, cardiovascular risk, coronary artery calcium, carotid intima-media thickness
While the concept of risk factors (RFs) permeated earlier Framingham publications,1, 2 the 1961 manuscript describing the relationship between hypertension, total cholesterol, left ventricular hypertrophy, and coronary heart disease provided the first literary usage of the term “risk factor.”3 In contradistinction to risk markers, RFs have come to represent causative conditions, not merely statistical associations, and thus provide invaluable information regarding prognosis and underlying pathophysiology; those that are modifiable further serve as targets of therapy. Traditional RFs for cardiovascular disease (CVD), all described nearly half a century ago, are relatively few in number, limited to dyslipidemia, family history, hypertension, age, cigarette smoking, diabetes mellitus, obesity, and physical inactivity. Efforts to expand the epidemiological canon have met with limited success due to the high hurdle of causality.4 Fortunately, another solution to current deficiencies in risk assessment – in particular, the underestimation of risk both before and after initiation of pharmacotherapy – may exist. Parallel to the investigation of novel biomarkers, such as high-sensitivity C-reactive protein, lipoprotein-associated phospholipase A2, and lipoprotein(a), ongoing research has yielded improved metrics of known causative conditions. This evolution of traditional RFs, heralded by measures such as ambulatory blood pressure (BP), central hemodynamics, low-density lipoprotein (LDL) particle concentration, genetic testing, and “vascular age,” may better address the “detection gap” in CVD.5
From Office Blood Pressure to Ambulatory Monitoring and Central Hemodynamics
Hypertension, the leading attributable RF for death worldwide,6 confers a two-fold risk of coronary heart disease and a four-fold risk of developing heart failure or stroke.7 Through varied pathways including endothelial injury and cardiac hypertrophy, high BP directly mediates adverse CV outcomes.8, 9 Traditionally, the diagnosis and management of hypertension are based on BP measurements taken in the physician's office.10 As a single snapshot of peripheral BP, however, this metric is not synonymous with, but rather reflects the underlying pathogenic process. The actual vascular insult varies from beat to beat as a dynamic pressure waveform. The pressure waveform represents a summation of outgoing pressure waves generated by left ventricular systole and centrally-directed waves reflected at sites of impedance mismatch in the periphery.11
Approaches to capture temporal and spatial dimensions of BP provide a more accurate and comprehensive profile of this traditional RF. Ambulatory monitoring involves serial assessment of upper arm pressures over 24 to 48 hours.12 Use of a small, automated, oscillometric device yields mean daily BP, revealing the time-integrated exposure of the brachial artery to BP throughout the day. Ambulatory BP is intuitively superior to standard office-based BP measurement to reflect the true pattern of BP changes during usual daily life. Numerous longitudinal studies convincingly showed the superiority of this technique over clinic BP for improving CV risk stratification in a variety of clinical settings and supported the prognostic superiority of mean ambulatory BP over conventional office BP for the general population, the elderly, and patients with hypertension, diabetes mellitus, cerebrovascular disease, and chronic kidney disease.13-20 Compared to equivalent differences in office BPs, increments of mean ambulatory BPs exhibited greater multivariate-adjusted risk ratios for mortality, myocardial infarction, stroke, and heart failure (Table 1).13-15, 21-25 Importantly, office BP cannot be used to derive mean ambulatory BP. While the two are well correlated in population studies, the measures are only modestly concordant. In other words, for any given value of office BP, the observed ambulatory BP may vary considerably (Figure 1),26 giving rise to potential misdiagnoses, as discussed below. To better define ambulatory BP thresholds, the International Database on Ambulatory Blood Pressure Monitoring in Relation to Cardiovascular Outcomes (IDACO) study performed 24-hour monitoring on 5,682 individuals and followed CV outcomes over 10 years.20 An outcome-driven reference frame was then determined by calculating three ambulatory BP levels yielding similar long-term CV risks to optimal, normal, and high BP as conventionally defined by office assessment (Table 2).20, 27, 28 Of note, these reference ranges are lower than those put forward by the American Society of Hypertension and the American Heart Association guidelines for the use of ambulatory BP monitoring (Table 2).20, 27, 28
Table 1.
Prospective studies comparing the association of 24-hour ambulatory blood pressure, standard office-based blood pressure, and adverse cardiovascular outcomes.
| Study Cohort | Outcomes | ABPM | OBPM |
|---|---|---|---|
| The Dublin Outcome Study: 5292 untreated hypertensive patients15 | All-cause mortality | Adjusted HR for each 10-mm Hg increment in mean SBP: 1.11 (95% CI 1.07-1.16; p<0.001 versus OBPM)* | Adjusted HR for each 10-mm Hg increment in SBP: 1.02 (95% CI 0.99-1.05)* |
| Ohasama study: 1542 unselected subjects25 | Cardiovascular mortality | Adjusted HR for each 1-mm Hg increment in mean SBP: 1.047 (95% CI 1.018-1.076)** | Adjusted HR for each 1-mm Hg increment in SBP: 0.992 (95% CI 0.971-1.012)** |
| Uppsala Longitudinal Study of Adult Men: 578 untreated 70-year-old men13 | Cardiovascular mortality and morbidity (hospitalization) | Adjusted HR for 1-SD increment in daytime mean SBP: 1.47 (95% CI 1.09-1.97; p=0.011)*** | Adjusted HR for 1-SD increment in SBP: 1.08 (95% CI 0.79-1.47; p=0.632)*** |
| Office versus Ambulatory Blood Pressure Study: 1963 patients with treated hypertension14 | Cardiovascular mortality and morbidity (MI, stroke, heart failure, angina, peripheral artery disease, sudden death) | Adjusted HR for 1-SD increment in 24-hour mean SBP: 1.50 (95% CI 1.27-1.78)**** After additional adjustment for OBPM, HR for 1-SD in 24-hour mean SBP: 1.34 (95% CI 1.11-1.62) |
Adjusted HR for 1-SD increment in SBP: 1.48 (95% CI 1.25-1.75)**** |
| 1200 patients without cardiovascular disease referred for ABPM22 | Cardiovascular mortality and morbidity (MI, stroke, heart failure, angina, coronary revascularization) | Unadjusted HR for 1-SD increment in 24-hour mean SBP: 1.58 (95% CI 1.37-1.80) After adjustment for covariates including OBPM, HR for 1-SD increment in 24-hour mean SBP: 1.41 (95% CI 1.20-1.65)***** |
Unadjusted HR for 1-SD increment in SBP: 1.02 (95% CI 1.01-1.02) |
| Anglo-Scandinavian cardiac outcomes trial-blood pressure lowering arm (ASCOT-BPLA): 1905 patients with hypertension21 | Cardiovascular mortality and morbidity (MI, stroke, coronary revascularization) | Adjusted HR for 1-SD increment in 24-hour mean SBP: 1.43 (95% CI 1.25-1.63)****** | Adjusted HR for 1-SD increment in SBP: 1.39 (95% CI 1.21-1.59)****** |
| Systolic Hypertension in Europe (Syst-Eur) Trial: 808 hypertensive patients age 60 years or older24 | Cardiovascular mortality and morbidity (MI, stroke, heart failure, sudden death) | Adjusted HR for each 10-mm Hg increment in mean SBP: 1.18 (95% CI 1.04-1.35; p<0.01 versus OBPM)******* | Adjusted HR for each 10-mm Hg increment in SBP: 1.13 (95% CI 0.96-1.34)******* |
ABPM: ambulatory 24-hour blood pressure measurement; OBPM: standard office-based blood pressure measurement; MI: myocardial infarction; SBP: systolic blood pressure; HR: hazard ratio; CI: confidence interval
Adjusted for gender, age, body mass index, presence of diabetes mellitus, history of cardiovascular events, and smoking status.
Adjusted for age, sex, smoking status, and use of antihypertensive medication.
Adjusted for serum cholesterol, smoking status, diabetes status, and body-mass index.
Adjusted for sex, age, body-mass index, smoking status, presence or absence of diabetes mellitus, serum cholesterol concentration, use or nonuse of lipid-lowering drugs, and presence or absence of cardiovascular complications at entry
Adjusted for age, sex, body mass index, smoking status, antihypertensive treatment, diabetes mellitus and office blood pressure.
Adjusted for age, sex, history of diabetes, total cholesterol, smoking status and body mass index.
Adjusted for sex, age, cardiovascular complications at entry, current smoking status, and residence in western Europe.
Figure 1. Discordance between ambulatory 24-hour blood pressure monitoring and clinic blood pressure assessment.
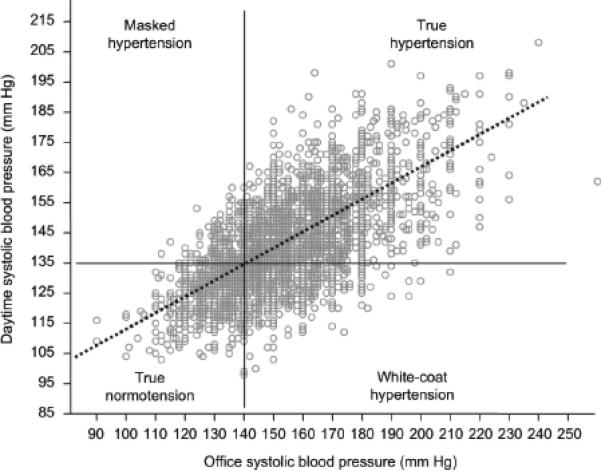
For any given value of office systolic blood pressure, plotted on the horizontal axis, the observed mean daytime systolic blood pressure measured via ambulatory 24-hour monitoring may vary considerably.26 Data from the Progetto Ipertensione Umbria Monitoraggio Ambulatoriale study.
Table 2.
Reference ranges for ambulatory blood pressure monitoring.
| Office-based blood pressure | ||||
|---|---|---|---|---|
| Guidelines or Study | Time | Optimal | Normal | Abnormal |
| Seventh Report of the Joint National Committee on Prevention, Detection, Evaluation, and Treatment of High Blood Pressure 200327 | Daytime | <120/80 | <130/85 | >140/90 |
| 24-hour ambulatory blood pressure | ||||
|---|---|---|---|---|
| Guidelines or Study | Time | Optimal | Normal | Abnormal |
| American Heart Association and American Society of Hypertension 200828 | 24-hour | <125/75 | <130/80 | >135/85 |
| Daytime | <130/80 | <135/85 | >140/90 | |
| Nighttime | <115/65 | <120/70 | >125/75 | |
| International Database of Ambulatory Blood Pressure in relation to Cardiovascular Outcomes 200720 | 24-hour | <115/75 | <125/75 | >130/80 |
| Daytime | <120/80 | <130/85 | >140/85 | |
| Nighttime | <100/65 | <110/70 | >120/70 | |
Other techniques acknowledge the regional variation of BP and provide insight into hemodynamics within central arteries. Applanation tonometry, the most widely used non-invasive technique, allows continuous recording of radial or carotid arterial pressure waveforms by applanating, or flattening, the superficial artery with an external transducer.11, 29 Mathematical models validated by invasive monitoring are then applied to derive central pressures. As the direct load imposed on the major target organs of hypertension, aortic pressures are likely more relevant to underlying pathophysiology than peripheral pressures.29 A closer relationship is supported by prognostic studies showing a stronger relationship between central hemodynamics and clinical outcomes, including all-cause mortality, stroke, myocardial infarction, and surrogate measures such as intima-media thickness and left ventricular hypertrophy (Table 3).30-38 Similar to ambulatory BP, aortic BP demonstrates limited concordance with conventional office BP. In one study, one-third of men with normal brachial BPs exhibited the same aortic pressure as those with clinic-defined Stage I hypertension (Figure 2).39 Defining normal and abnormal reference ranges for varied populations requires further research.
Table 3.
Prospective studies comparing the association of central blood pressure, peripheral (brachial) blood pressure, and association with adverse cardiovascular outcomes.
| Study Cohort | Outcomes | Central BP | Peripheral BP |
|---|---|---|---|
| 180 patients with end-stage renal disease36 | All-cause mortality | Adjusted HR for each 1-SD increment in PP measured by CT: 1.4 (95% CI 1.1-1.8)* | Adjusted HR for each 1-SD increment in PP: 1.2 (95% CI 0.9-1.5)* |
| Strong Heart Study: 3250 unselected American Indian subjects35 | Cardiovascular mortality and morbidity (MI, stroke, heart failure, sudden death) | Adjusted HR for each 10-mm Hg increment in PP measured by RT: 1.15 (95% CI 1.07-1.24)** | Adjusted HR for each 10-mm Hg increment in PP: 1.10 (95% CI 1.03-1.18)** |
| ICARe Dicomano: unselected subjects age 65 years or older34 | Cardiovascular mortality and morbidity (MI, stroke, heart failure, sudden death) | Adjusted HR for each 10-mm Hg increment in PP measured by RT: 1.23 (95% CI 1.10-1.37)*** Adjusted HR for each 10-mm Hg increment in SBP measured by RT: 1.19 (95% CI 1.08-1.31)*** |
No significant association with brachial BP |
| 1109 subjects with suspected coronary artery disease undergoing non-emergent coronary angiography33 | Cardiovascular mortality and morbidity (MI, stroke, sudden death, heart transplantation, coronary revascularization) | Adjusted HR for each 1-SD increment in PP measured by DI: 1.24 (95% CI 1.06-1.45)**** | Adjusted HR for each 1-SD increment in PP: 1.04 (95% CI 0.90-1.20)**** |
| 1272 unselected Chinese subjects37 | Cardiovascular mortality | Adjusted HR for each 10-mm Hg increment in SBP measured by CT: 1.303 (95% CI 1.21-1.515)***** | No significant association with brachial BP***** |
BP: blood pressure; SBP: systolic blood pressure; MI: myocardial infarction; PP: pulse pressure; CI: confidence interval; HR: hazard ratio; CT: carotid artery applanation tonometry; RT: radial artery applanation tonometry; DI: direct invasive assessment
Adjusted for age, time on dialysis before inclusion, and previous cardiovascular events.
Adjusted for age, gender, current smoking, body mass index, cholesterol:HDL ratio, creatinine, fibrinogen, diabetes, and heart rate.
Adjusted for age and gender.
Adjusted for age, gender, ejection fraction, mean coronary artery stenosis, heart failure, heart rate, risk factors, cardiovascular history, glomerular filtration rate, and prescribed drugs.
Adjusted for age, sex, heart rate, body-mass index, current smoking, fasting plasma glucose levels, ratio of total cholesterol to high-density lipoprotein, carotid–femoral pulse wave velocity, left ventricular mass, intima-media thickness, and estimated glomerular filtration rate.
Figure 2. Discordance between central blood pressure and peripheral blood pressure.

For any given value of brachial systolic blood pressure, plotted on the vertical axis, the observed aortic systolic blood pressure may vary considerably.39 Data from the Anglo-Cardiff Collaborative Trial II.
Relying on routine clinic BPs alone may, at its worst, result in misdiagnoses or misleading clinical trial data; more commonly, subtle inaccuracies in risk calibration likely occur. Masked hypertension represents the archetypal problem limiting standard clinical BP assessment. A “false negative” result of office measurement, masked hypertension is defined as clinic BP < 140/90 mmHg despite evidence of hypertension during the remainder of the day.26, 40, 41 The latter is defined as self-measured pressures exceeding 135/85 mmHg or ambulatory daytime pressures > 130/85 mmHg. Masked hypertension afflicts 8% to 17% of the general population, in particular younger men with psychological stress, and confers a risk of myocardial infarction and stroke similar to sustained hypertension.19, 23, 26, 42 A recent meta-analysis of clinical studies investigating the prognosis of masked hypertension detected by ambulatory BP showed that masked hypertension was associated with a two-fold increased risk of CV events when compared to normotension (HR 2.00, 95% CI 1.54-2.60; p<0.001).26
On the other hand, white coat hypertension, also referred to as office hypertension or isolated clinic hypertension, is generally defined as persistently elevated office BP in the presence of normal BP outside the office. The aforementioned classification generally applies to untreated subjects, as most available analyses assessed this particular group of patients. Despite a large number of studies, the definition of white coat hypertension has not been definitively established. In fact, while the usual definition of elevated office BP has been settled (≥140 mmHg systolic and/or ≥90 mmHg diastolic), there remains controversy about the definition of normal BP outside the office. Usually, the exaggerated alerting reaction manifests as office BPs > 140/90 mmHg with home recordings < 135/85 mmHg and ambulatory daytime pressures < 130/80 mmHg.41 In the Spanish Ambulatory Blood Pressure Monitoring Registry, almost half of the patients diagnosed with Stage I hypertension (140-159/90-99 mmHg) and approximately one-fourth of those identified as having Stage II hypertension (>160/100 mmHg) by office assessment were found to be normotensive by ambulatory measurement.43
For now, it is reasonable to consider the possibility that antihypertensive drug treatment might be unnecessary in a considerable portion of subjects with white coat hypertension. It is worth noting, however, that some of the subjects with white coat hypertension may be at increased CV risk because of concomitant RFs such as diabetes, cigarette smoking, or elevated cholesterol. Withholding antihypertensive drug treatment in these individuals may not be justified in the absence of supporting data. Randomized trials are needed in patients with white coat hypertension in order to compare lifestyle measures alone with pharmacotherapy according to current recommendations based on office BP.18
In addition to improper diagnosis, the use of office BP alone as an endpoint in antihypertensive drug trials may result in inappropriate conclusions. The Heart Outcomes Prevention Evaluation (HOPE) trial44 studied the effects of ramipril among patients at high-risk for vascular events without traditionally defined Stage I hypertension. Compared to placebo, the treatment group exhibited a significant 20% reduction in the composite endpoint of CV mortality, myocardial infarction, and stroke. The comparatively small decrease in office BPs of 3/2 mmHg, far less than the 9/5 mmHg reduction associated with such a magnitude of benefit in other clinical trials,45 suggested the presence of pleiotropic benefits of tissue-selective angiotensin converting enzyme inhibitors (ACEI) above and beyond BP effects. However, ambulatory BP measurement of a subset of enrolled patients uncovered a more likely explanation.44 Ramipril therapy resulted in significantly lower mean daily BPs of 10/4 mmHg compared to placebo that could wholly explain the observed CV benefits.44 While ACEI-mediated antiatherosclerotic pathways may indeed exist, and clinical use of ACEIs remains justified in many patients at high risk,46-49 mechanisms “beyond blood pressure” are undoubtedly less important than the initial HOPE data would indicate, particularly in the presence of concomitant aggressive lipid-lowering and anti-platelet therapy.50-52
The Conduit Artery Function Evaluation (CAFÉ) study evaluated changes in central artery waveforms after treatment with atenolol or amlodipine.38 While no differences in brachial artery BPs were found, radial artery applanation tonometry demonstrated significantly higher central pressures in the group treated with atenolol, with a difference in the AUC of 4 mmHg. Importantly, elevated aortic pressures were significantly associated with worsened CV events in the atenolol group. The critical finding, only revealed by analysis of central hemodynamics, may well explain the adverse outcomes associated with atenolol in multiple meta-analyses.45, 53-55 Hypothesized mechanisms for atenolol-induced changes in aortic waveform include a proximal shift in arterial reflection sites resulting in earlier wave reflection and a prolonged ejection time delaying the peak of the outgoing pressure wave.38
From LDL-Cholesterol Content to Number of LDL Particles
Hyperlipidemia, specifically elevated circulating LDL, is integral to the initiation and progression of atherosclerosis. Accumulation and modification of LDL in the arterial intima initiates the inflammatory cascade resulting in plaque formation. Epidemiologic studies indicate that, in the absence of adequate LDL levels, coronary heart disease is uncommon even in the presence of other RFs.56, 57 The current standard assay to evaluate LDL-related risk, the Friedewald method, estimates the cholesterol content within the LDL fraction.58 Its low cost and rapidity enabled the study of large cohorts required to illuminate the association between LDL and coronary disease. Developed in 1972 as a simpler alternative to ultracentrifugation, the Friedewald method assesses total cholesterol and triglycerides enzymatically, and high-density lipoprotein (HDL) cholesterol after precipitation of apolipoprotein B (ApoB)-containing lipoproteins. LDL-cholesterol is then calculated as the cholesterol remaining after HDL-cholesterol and very LDL-cholesterol, using one-fifth of triglyceride mass as a proxy, are subtracted from total cholesterol. The surrogate for very LDL-cholesterol is a well appreciated limitation, prohibiting testing in a non-fasting state or when triglycerides exceed 400 mg/dL, when the ratio of triglycerides to cholesterol in very LDL deviates from the usual 5 to 1.58 However, an even more fundamental problem exists, as LDL-cholesterol concentration, regardless of the assay used for its determination, represents a limited surrogate of LDL-related atherogenicity. LDL particles, and not the cholesterol transported within their hydrophobic core, interact with the vessel wall to initiate plaque formation,59 and the concentration of lipoproteins cannot be reliably derived from cholesterol levels. Similar to office and ambulatory BP, the two measures of LDL-related risk – LDL-cholesterol concentration and the number of LDL particles – exhibit strong correlation, but are only modestly concordant (Figure 3).60 For any given LDL-cholesterol, LDL particle number may vary depending on the quantity of cholesterol carried by each particle.
Figure 3. Discordance between LDL-particle concentration and LDL-cholesterol.
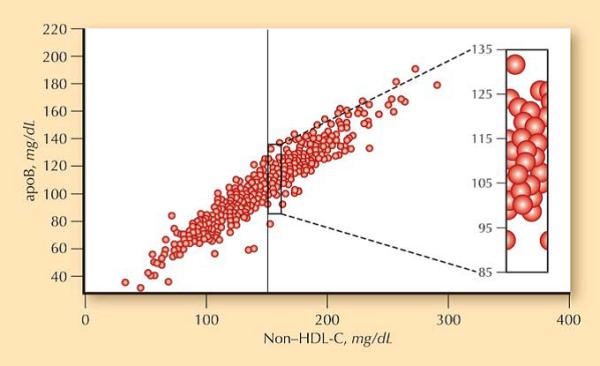
For any given value of non-HDL-cholesterol, plotted on the horizontal axis, the observed apolipoprotein B may vary considerably.60 Data from the National Health and Nutrition Examination Survey.
Assessing lipoprotein concentration would thus appear advantageous to counting cholesterol cargo. The former can be achieved using antibodies directed towards ApoB, which is present as a single copy on each atherogenic lipoprotein, or nuclear magnetic resonance techniques. Clinical ApoB assays measure the total concentration of ApoB-100 and ApoB-48, isoforms present on lipoproteins derived from the liver and intestine, respectively.59 LDL ApoB-100 accounts for over 90% of total ApoB even in the non-fasting state; therefore, ApoB is predominantly a measure of LDL-related atherogenicity.61 Nuclear magnetic resonance, an alternative method, takes advantage of two important principles to permit rapid quantification of lipoprotein particle number without requiring physical separation. First, each lipoprotein subclass emits a distinct signal when subjected to electromagnetic pulses in a magnetic field; second, the signal amplitudes generated are directly proportional to the concentration of the particles emitting the signal. Using a library of known lipids, sample signals can be deconvoluted to determine concentrations of individual lipoprotein subclasses, most importantly, LDL particle number.62
The majority of studies comparing LDL-cholesterol and the number of LDL particles have demonstrated a stronger association of the latter with atherosclerotic CVD as measured by higher multivariate adjusted risk ratios.63 Importantly, in no cohort have cholesterol measures proven superior. The prospective Apolipoprotein-related MOrtality RISk (AMORIS) study of 147,576 subjects in Sweden reported improved discrimination, as well, with use of ApoB compared to LDL-cholesterol.64 AUC increased from 0.60 to 0.65 in men and 0.60 to 0.69 in women (p<0.0001).
Beyond traditional summary measures of association and discrimination, situations of discordance provide the clinical argument for measuring lipoprotein levels. In the general population, approximately 1 in 5 individuals exhibit significantly different LDL particle concentration and cholesterol levels on a percentile basis, such as an LDL-cholesterol of 100 mg/dL (20th percentile) and an LDL particle number of 1300 nmol/L (40th percentile).65 Discordance increases to almost 1 in 2 individuals in the presence of diabetes, hypertriglyceridemia, low HDL-cholesterol, or low LDL-cholesterol.66-68 When discordance exists, the risk of CV events tracks LDL particle number and not cholesterol concentration, as exemplified by a study of the Framingham cohort (Figure 4).65 In the Multi-Ethnic Study of Atherosclerosis, carotid intima-media thickness, a validated surrogate measure of stroke and myocardial infarction, was similarly related to LDL particle number but not to LDL-cholesterol among the 1 out of 5 subjects in whom the two measures differed. Discordance is particularly evident among patients treated with lipid-lowering agents. Intervention trials reveal an attenuated reduction in LDL particle number compared to LDL-cholesterol, with residual risk of adverse CV events only associated with measures of on-treatment LDL particle concentration.63
Figure 4. Association of LDL-particle concentration and LDL-cholesterol and adverse cardiovascular outcomes in the setting of discordance.
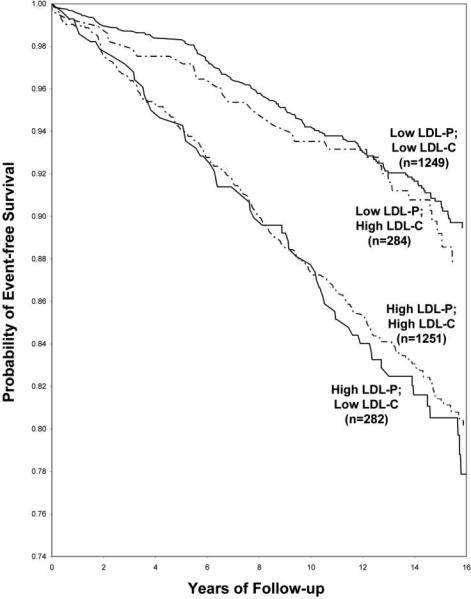
Among the 1 in 5 patients with discordant LDL-P and LDL-C, LDL-P was strongly associated with outcomes while LDL-C had no relation.65 Data from the Framingham Offspring
Reliance on LDL-cholesterol for risk assessment may confound interpretation of clinical trial results. The Justification for the Use of Statins in Primary Prevention: An Intervention Trial Evaluating Rosuvastatin (JUPITER) study was designed as a primary prevention trial of low-risk subjects, with LDL-cholesterol levels not warranting routine initiation of statin therapy.69 Although the LDL-cholesterol was only 108 mg/dL, or 25th percentile, ApoB was significantly higher at 109 mg/dL, or 60th percentile.70 The elevated ApoB levels may at least partly explain the significant 44% reduction in events observed with rosuvastatin.
From Family History to Genetic Profile
Family history of premature CVD is a catch-all non-modifiable RF incorporating both known and as yet unidentified environmental and heritable traits that cluster in families. For coronary heart disease, a positive premature family history is variably defined as myocardial infarction in a male or female first-degree relative younger than 55 or 65 years of age, respectively,71 or a parental history of myocardial infarction before the age of 60.72 Family history of premature cerebrovascular disease has been described as documented stroke by 65 years of age in a parent or other first-degree relative.73, 74
Numerous studies support the role of family history as a RF for CVD, with prospective analyses describing a relative risk up to two-fold among offspring and siblings.75, 76, 77 By validating parental outcomes, the prospective Framingham Offspring Study provided perhaps the most accurate effect size of parental history of premature atherosclerotic CVD. Odds ratios after adjustment for other traditional RFs were 2.0 (95% CI 1.2-3.1) for men and 1.7 (95% CI 0.9-3.1) for women.76
Unfortunately, confirming CV outcomes of relatives remains a luxury not afforded by the vast majority of clinical care. Patient interview currently forms the basis of pedigree analysis and, as such, family history suffers from limited reliability. Even in the closely monitored Framingham cohort, a best-case scenario, patients were accurate only 28% of the time when they reported a positive parental history of early-onset heart attack.78 A national mail survey of the U.S. population aged 18 years and older sponsored by the Centers for Disease Control showed that less than one-third of respondents actively inquired about health information from their relatives, even though almost all considered knowledge of family history important.79 A systematic review of family history in the risk assessment for common diseases, including cancer, diabetes, and CV, expressed similar concerns about the collection and accuracy of reported data.80
As a marker of heritable atherogenic traits, family history suffers from other limitations. Accuracy relies on an unbroken chain of events – phenotypic manifestation of the inherited predisposition, correct diagnosis in the affected relative, and precise communication to and recall of the condition by the patient. Much attention has focused on faltering at the terminal step, but the preceding ones lead to misclassification, as well. Variable penetrance and expression may result in a relatively benign presentation in one generation, and fulminant disease in the next. Given the unusual occurrence of heart attack or stroke in younger patients, morbidity or mortality may instead be attributed to other causes or even accidents, leaving the primary culprit undiagnosed.
Genetic testing, though still in its infancy, may offer significant advantages over patient-reported family history of premature CVD by directly evaluating for heritable traits. For many years, the genetic basis of CVD was poorly understood, limited to underpowered candidate gene studies of a few selected markers ultimately yielding predominantly false positive associations as a consequence of publication bias.81, 82,83 However, the past several years have witnessed a remarkable transformation attributable to genome-wide association studies (GWAS), which utilize high-throughput genotyping technologies to interrogate hundreds of thousands to millions of common single nucleotide polymorphisms (SNPs) across the genome.84-89 The GWAS findings have proven more robust than candidate gene associations as a result of very stringent criteria for both defining an association, with a p-value less than 5 × 10⁻⁸ conferring statistical significance, and requirements for replicating the findings in multiple independent cohorts. The importance of a rigorous approach cannot be overstated, as highlighted by recent GWAS data casting doubt on the previously reported association with KIF6.83, 90, 91
GWAS have identified over 500 disease-associated SNPs, including many related to CVD. Associations have been found for most traditional RFs including lipids,92-97 BP,98, 99, weight and body mass index,100-104 smoking behavior,105, 106 and diabetes.107-114 Importantly, GWAS have also identified susceptibility variants for coronary heart disease and myocardial infarction that are independent of traditional RFs (Table 4).115-120 The first, and so far the strongest, of these signals was found in the 9p21.3 locus and is associated with a 20-40% heightened risk of coronary heart disease among Caucasian118, 120-122 and East Asian populations.123 Like many of the associations identified to date, the function of the non-coding 9p21.3 chromosomal region remains unclear, but may relate to adjacent tumor suppressor genes CDKN2A and CDKN2B encoding p16INK4a and p16INKb respectively, or the overlapping non-coding RNA, ANRIL, which is expressed in atherosclerotic tissue.124
Table 4.
Single nucleotide polymorphisms associated with an increased risk of myocardial infarction and coronary artery disease that are not associated with traditional risk factors.
| SNP | Chromosome | Gene region | OR* |
|---|---|---|---|
| rs17465637116, 118 | 1q41 | MIA3 | 1.14-1.2 |
| rs6725887116 | 2q33 | WDR12 | 1.17 |
| rs9818870115 | 3q22 | MRAS | 1.15 |
| rs12526453116 | 6p24 | PHACTR1 | 1.12 |
| rs4977574116, 117, 119, 120 | 9p21 | CDKN2A–CDKN2B | 1.28-1.47 |
| rs1746048116, 118, 128 | 10q11 | CXCL12 | 1.17-1.33 |
| rs9982601116 | 21q22 | SLC5A3–MRPS6–KCNE2 | 1.2 |
OR: odds ratio for coronary artery disease and myocardial infarction
An appealing strategy to improve CV risk prediction incorporates the newly validated genetic information obtained from GWAS. An early effort in the Atherosclerosis Risk in Communities cohort added a SNP in the 9p21.3 locus to risk assessment and observed a clinical net reclassification index of 6.8% as well as improved discrimination, with AUC increasing from 0.782 to 0.786 (95% CI +0.001 to +0.007).125 A subsequent “genotype score” incorporated information from not just a single SNP, but a panel of 9 SNPs in genes related to lipid metabolism. Higher genotype scores were associated with higher LDL-cholesterol levels, lower HDL-cholesterol levels, and an increased risk of CVD. There was a significant improve-ment in categorization with a net reclassification index of 6.1%; discrimination, however, remained unchanged.93 A second multilocus model incorporated 13 previously validated SNPs to estimate the association of a genetic risk score with incident coronary heart disease in a prospective cohort. Even after adjusting for family history and traditional RFs, individuals in the top quintile of genetic risk score were 1.66 times at increased risk for coronary events compared to the lowest quintile (95% CI 1.35-2.04).126 While this limited SNP panel did not improve discrimination, the multimarker approach may nonetheless prove useful, particularly as additional risk variants are identified.
Despite the unprecedented success of GWAS to identify susceptibility variants for coronary heart disease, the vast majority of heritable risk remains unknown. The basis for this “heritability gap” remains unclear and is the focus of intense investigation. Massive meta-analyses of GWAS, like those proposed by the CARDIoGRAM Study Consortium127 will likely yield further susceptibility variants as has been the case for large, international consortia examining other traits such as lipids.96 While copy number variants have not been shown to be associated with myocardial infarction,128 undiscovered epigenetic or epistatic interactions may also play a significant role.78 Finally, rare variants may account for a substantial portion of inherited risk. High-throughput whole genome or whole exome sequencing efforts will permit examination of rare variants occurring with a frequency of < 5%, undoubtedly expanding the current catalogue of genetic determinants of both common and Mendelian forms of CVD.129-132
A recently published work described the first use of whole genome sequencing data in a clinical setting,133 providing at least proof of principle that clinically meaningful information can be derived regarding disease risk and response to therapy. By the end of 2011, it is estimated that over 30,000 individuals will have had whole genome sequencing134 as technological advances continue to reduce costs, which are anticipated to fall below several hundred dollars within a few years. The primary obstacle to genetic testing will not be the acquisition of patient data, but rather rigorous analysis of incremental risk prediction and translation of genetic data into digestible information for physicians and patients.
From Chronological Age to Vascular Age
Actual, or chronological age, is the dominant determinant of near- to intermediate-term risk in all validated clinical risk scoring systems.135 Models of CV events with age alone as a predictor yield an AUC of approximately 0.70.136 With clinical risk classification systems offering a net AUC of 0.75-0.80, age clearly accounts for most of the discriminatory capacity.135 In the Women's Health Study, adding traditional RFs to age minimally improved discrimination from an AUC of 0.731, with incorporation of LDL-C or self-reported systolic BP increasing AUC by 0.005 or 0.037, respectively.136
While useful in assessing populations, chronological age is limited when evaluating a particular individual, as CV risk varies dramatically in subjects of the same age. For example, among a cohort of similarly-aged elderly subjects in the Leiden 85 Plus study, the Framingham function showed very poor discrimination, with an AUC not significantly different from that of a coin toss.137 Moreover, chronological age is not a true RF per se.135, 138, 139 Actual age reflects atherosclerotic burden resulting from the slow accumulation of plaque over time, and it is this plaque burden that engenders atherothrombotic events.138
Updating chronological age relies on a concept first proposed by the British physician Syndeham circa 1650, that “a man is as old as his arteries,” and later articulated by Grundy in 1999 for the modern era, leveraging non-invasive imaging techniques.138, 140, 141 Vascular age captures the underlying process crudely estimated by chronological age, describing arterial, more specifically coronary or carotid arterial, health as assessed by coronary calcium scanning or carotid ultrasonography.
Deriving vascular age from imaging findings generally employs one of two approaches. First, vascular age may be interpreted as the chronological age at which the observed coronary artery calcium score (CACS)142-144 or carotid intima-media thickness (CIMT)145 equals the median value using data from a reference population. Applying this method, a 45-year-old black woman with a composite CIMT of 0.68 mm would have a vascular age of 55 years using the Atherosclerosis Risk in Communities (ARIC) database.145 In other words, she shares the same CIMT as a 55-year-old black woman at the 50th percentile in the ARIC study. One exploratory analysis substituting vascular age for chronological age in the Framingham 10-year hard coronary heart disease risk estimation, reclassified 1 in 2 subjects initially at intermediate-risk.145 Thirty six percent of patients were restratified to a higher-risk and 14% to a lower-risk category. Significant changes in risk calculation were thus observed using vascular age; however, the accuracy of modified estimates could not be determined in the small, cross-sectional study.
In the second approach, vascular age represents the chronological age that captures the CV risk associated with a given imaging score.146 For example, using the transformation derived from the Multi-Ethnic Study of Atherosclerosis (MESA),146 available as an online tool,147 a 56-year-old man with a CACS of 150 Agatston units would have a vascular age of 75 years. That is to say, the degree of coronary calcification present confers a risk of adverse CV events equivalent to that of being 75 years of age. Arterial age derived from CACS using this method proved superior to actual age in predicting incident coronary heart disease events in the MESA cohort.146 Only arterial age was significant for evaluating risk when both were included in a model for coronary heart disease. Moreover, vascular age improved discrimination in the Framingham risk calculations, with the AUC increasing from 0.75 to 0.79 (p=0.006).
Comparison of the prognostic accuracy of these two approaches to vascular age has not yet been performed. Some suggest that assigning an arterial age based on risk equivalence as opposed to population median values more accurately translates atherosclerotic burden into “arterial age units.”146 One analysis from the MESA study demonstrated that absolute CACS was more predictive of future CV events than relative age-, gender-, and ethnic-based percentiles.148 Of note, for most CACS values, the former method generates a higher vascular age than the latter technique (Table 5).142-144, 147
Table 5.
Vascular age derived from median values of coronary artery calcium score (CACS), a relative description, and risk equivalence, an absolute definition.142-144
| CACS (Agatston Units) | Vascular Age (years): Based on Median Values | Vascular Age (years): Based on Risk Equivalence |
|---|---|---|
| 5 | 55 | 52 |
| 10 | 56 | 56 |
| 25 | 59 | 63 |
| 50 | 63 | 68 |
| 100 | 67 | 73 |
| 200 | 73 | 78 |
| 400 | 80 | 83 |
Conclusion
Office BP, LDL-cholesterol, family history, and chronological age are important traditional RFs that revolutionized our understanding of CVD and paved the way for effective preventive strategies. Management of office BP and LDL-cholesterol alone contributed nearly half of the 50% decrease in coronary heart disease mortality observed in the US over two decades, corresponding to 341,745 fewer deaths in the year 2000.149 As first approximations of causative biological processes, however, these current standards of risk assessment suffer from suboptimal accuracy. Equipped with more reliable measures, including ambulatory BP, LDL particle concentration, genetic testing, and vascular age, when will it be time to move on?
A statistical maxim admonishes us to remember that “all models are wrong; the practical question is how wrong do they have to be to not be useful.”150 All biomarkers are similarly imperfect windows into underlying pathophysiology – what matters is the effect on downstream clinical decision-making. As the lens by which we “see” risk, current standards of measurement – and their inaccuracies – have far-reaching, often insidious implications. Evidence raises the possibility of misclassification, misdiagnosis, or misleading clinical trial results, suggesting a compelling need for updated measures of traditional RFs. The definitive answer awaits comparative outcomes studies and comprehensive cost-effectiveness analyses. For now, consensus statements provide guidance on the clinical use of ambulatory 24-hour blood pressure monitoring, LDL-particle number assessed by ApoB or nuclear magnetic resonance, and subclinical atherosclerosis imaging with CACS or CIMT (Table 6).10, 12, 59, 151-155 Importantly, costs associated with these tests continue to decline (Table 7).156-158
Table 6.
Consensus statements published in the past five years providing guidance for the clinical use of ambulatory 24-hour blood pressure monitoring, LDL-particle number assessed by apoB or NMR, and subclinical atherosclerosis imaging with CACS or CIMT.
| Measure | Consensus Statement |
|---|---|
| 24-hour ABPM |
American Society of Hypertension 200812 ABPM has particular utility in detection of masked hypertension, white-coat hypertension, and assessment of antihypertensive therapy responses in patients receiving complex antihypertensive treatment regimens. As noted previously, ABPM is also the most effective means to determine BP values during sleep when nocturnal hypertension or nondipping profiles are suspected. European Society of Cardiology and European Society of Hypertension 200710 Although OBPM should be used as reference, ABPM may improve prediction of cardiovascular risk in untreated and treated patients. 24-h ABPM should be considered, in particular, when: - considerable variability of OBPM is found over the same or different visits - high OBP is measured in subjects otherwise at low total cardiovascular risk - there is a marked discrepancy between BP values measured in the office and at home - resistance to drug treatment is suspected - hypotensive episodes are suspected, particularly in elderly and diabetic patients - OBPM is elevated in pregnant women and pre-eclampsia is suspected |
| LDL-particle number (ApoB or NMR) |
American Diabetes Association and American College of Cardiology 2008151 Because ApoB appears to be a more sensitive index of residual cardiovascular disease risk when LDL cholesterol or non- HDL cholesterol are <130 mg/dl or <160 mg/dl, respectively, measurement of ApoB, using a standardized assay, is warranted in patients with cardiometabolic risk on pharmacologic treatment. In particular, apoB levels should be used to guide adjustments of therapy. While LDL particle number as measured by NMR appears equally informative as ApoB, the concerns expressed above with regard to this assay limit its widespread adoption at this time. Thirty-person/Ten-country Panel 200659 We believe that all guideline groups should recommend that target levels of Apo B be adopted as alternatives to LDL or non-HDL cholesterol. |
| CACS |
American Heart Association and American College of Cardiology 2010153 Measurement of CAC is reasonable for cardiovascular risk assessment in asymptomatic adults at intermediate risk (10% to 20% 10-year risk) (Class IIa indication, Level of Evidence B). Measurement of CAC may be reasonable for cardiovascular risk assessment in persons at low to intermediate risk (6% to 10% 10-year risk) (Class IIb, Level of Evidence B). American Heart Association and American College of Cardiology 2007154 It may be reasonable to consider use of CACS in intermediate risk patients based on available evidence that demonstrates incremental risk prediction information in this selected patient group. This conclusion is based on the possibility that such patients might be reclassified to a higher risk status based on high CAC score, and subsequent patient management may be modified. American Heart Association 2006152 With a prior probability of a coronary event in the intermediate range, a calcium score >100 would yield a post-test probability of >2% per year in the majority of patients, within the range of a coronary heart disease risk equivalent population and within a level requiring secondary prevention strategies. |
| CIMT |
American Heart Association and American College of Cardiology 2010153 Measurement of CIMT is reasonable for cardiovascular risk assessment in asymptomatic adults at intermediate risk. Published recommendations on required equipment, technical approach, and operator training and experience for performance of the test must be carefully followed to achieve high-quality results (Class IIa indication, Level of Evidence: B) American Society of Echocardiography 2008155 Measuring CIMT and identifying carotid plaque can be useful for refining cardiovascular risk assessment in patients at intermediate risk |
BP: blood pressure; ABPM: ambulatory blood pressure monitoring; OBPM: office blood pressure monitoring; LDL: low-density lipoprotein; HDL: high-density lipoprotein; ApoB: apolipoprotein B; NMR: nuclear magnetic resonance; CACS: coronary artery calcium scan; CIMT: carotid artery intima-media thickness
Table 7.
Approximate costs of various improved measures of established risk factors.
| Traditional Risk Factor | Measure | Cost |
|---|---|---|
| Blood pressure | Office-based blood pressure | N/A |
| Ambulatory 24-hour blood pressure monitoring157 | $60-120 | |
| Low-density lipoprotein | Lipid panel158 | $60 |
| Apolipoprotein B158 | $80 | |
| Nuclear magnetic resonance LDL-particle number | $140 | |
| Heritable traits | Family history | N/A |
| deCODE MI | $710 | |
| Age | Chronologic age | N/A |
| Coronary artery calcium scan156 | $100-300 | |
| Carotid ultrasound156 | $100-200 |
As further studies continue to be deliberated, it is worth discussing whether the same thresholds for acceptance should be imposed on more accurate measures of accepted risk factors as on novel biomarkers, such as high-sensitivity C-reactive protein. For the echocardiographic measurement of systolic function, no formal outcomes study or cost-effective analysis supports the recommended use of Simpson's method of discs over fractional shortening, yet few would dispute the increased accuracy and attendant clinical utility of two-dimensional compared to linear assessment.159 Using more accurate metrics of established pathogenic processes may better address the detection gap and ensure thorough evaluation of novel therapies. The evolution and refinement of traditional risk factors offers a promising solution to current limitations in cardiovascular risk assessment.
Footnotes
Disclosures
Emil M. deGoma declares no competing interests. Joshua W. Knowles declares no competing interests. Fabio Angeli declares no competing interests. Matthew J. Budoff has received speaker honoraria from GE. Daniel J. Rader declares associations with the following companies: Abbott, AstraZeneca, Bristol-Myers Squibb, Eli Lilly, Johnson & Johnson, Merck, Novartis, and Resverlogix.
Publisher's Disclaimer: This is a PDF file of an unedited manuscript that has been accepted for publication. As a service to our customers we are providing this early version of the manuscript. The manuscript will undergo copyediting, typesetting, and review of the resulting proof before it is published in its final citable form. Please note that during the production process errors may be discovered which could affect the content, and all legal disclaimers that apply to the journal pertain.
Contributor Information
Emil M. deGoma, Division of Cardiovascular Medicine, University of Pennsylvania, Philadelphia, Pennsylvania.
Joshua W. Knowles, Division of Cardiovascular Medicine, Stanford University Medical Center, Palo Alto, California.
Fabio Angeli, Section of Cardiac Rehabilitation, Hospital Media Valle del Tevere, Perugia, Italy.
Matthew J. Budoff, Division of Cardiovascular Medicine, Los Angeles Biomedical Research Institute, Los Angeles, California.
Daniel J. Rader, Division of Translational Medicine and Human Genetics, University of Pennsylvania, Philadelphia, Pennsylvania.
References
- 1.Dawber TR, Kannel WB, Revotskie N, et al. Some factors associated with the development of coronary heart disease: six years’ follow-up experience in the Framingham study. Am J Public Health Nations Health. 1959;49:1349–56. doi: 10.2105/ajph.49.10.1349. [DOI] [PMC free article] [PubMed] [Google Scholar]
- 2.Dawber TR, Moore FE, Mann GV. Coronary heart disease in the Framingham study. Am J Public Health Nations Health. 1957;47:4–24. doi: 10.2105/ajph.47.4_pt_2.4. [DOI] [PMC free article] [PubMed] [Google Scholar]
- 3.Kannel WB, Dawber TR, Kagan A, et al. Factors of risk in the development of coronary heart disease--six year follow-up experience. The Framingham Study. Ann Intern Med. 1961;55:33–50. doi: 10.7326/0003-4819-55-1-33. [DOI] [PubMed] [Google Scholar]
- 4.Wang TJ. New cardiovascular risk factors exist, but are they clinically useful? Eur Heart J. 2008;29:441–4. doi: 10.1093/eurheartj/ehm644. [DOI] [PubMed] [Google Scholar]
- 5.Pasternak RC, Abrams J, Greenland P, et al. 34th Bethesda Conference: Task force #1--Identification of coronary heart disease risk: is there a detection gap? J Am Coll Cardiol. 2003;41:1863–74. doi: 10.1016/s0735-1097(03)00358-9. [DOI] [PubMed] [Google Scholar]
- 6.Global Health Risks. World Health Organization; 2009. [Google Scholar]
- 7.Kannel WB. Blood pressure as a cardiovascular risk factor: prevention and treatment. JAMA. 1996;275:1571–6. [PubMed] [Google Scholar]
- 8.Brunner H, Cockcroft JR, Deanfield J, et al. Endothelial function and dysfunction. Part II: Association with cardiovascular risk factors and diseases. A statement by the Working Group on Endothelins and Endothelial Factors of the European Society of Hypertension. J Hypertens. 2005;23:233–46. doi: 10.1097/00004872-200502000-00001. [DOI] [PubMed] [Google Scholar]
- 9.Chobanian AV, Alexander RW. Exacerbation of atherosclerosis by hypertension. Potential mechanisms and clinical implications. Arch Intern Med. 1996;156:1952–6. [PubMed] [Google Scholar]
- 10.Mancia G, De Backer G, Dominiczak A, et al. Guidelines for the management of arterial hypertension: The Task Force for the Management of Arterial Hypertension of the European Society of Hypertension (ESH) and of the European Society of Cardiology (ESC). Eur Heart J. 2007. 2007;28:1462–536. doi: 10.1093/eurheartj/ehm236. [DOI] [PubMed] [Google Scholar]
- 11.Schillaci G, Grassi G. Central blood pressure: getting to the heart of the matter. J Hypertens. 28:237–9. doi: 10.1097/HJH.0b013e3283359509. [DOI] [PubMed] [Google Scholar]
- 12.Pickering TG, White WB. ASH Position Paper: Home and ambulatory blood pressure monitoring. When and how to use self (home) and ambulatory blood pressure monitoring. J Clin Hypertens (Greenwich) 2008;10:850–5. doi: 10.1111/j.1751-7176.2008.00043.x. [DOI] [PMC free article] [PubMed] [Google Scholar]
- 13.Bjorklund K, Lind L, Zethelius B, et al. Isolated ambulatory hypertension predicts cardiovascular morbidity in elderly men. Circulation. 2003;107:1297–302. doi: 10.1161/01.cir.0000054622.45012.12. [DOI] [PubMed] [Google Scholar]
- 14.Clement DL, De Buyzere ML, De Bacquer DA, et al. Prognostic value of ambulatory blood-pressure recordings in patients with treated hypertension. N Engl J Med. 2003;348:2407–15. doi: 10.1056/NEJMoa022273. [DOI] [PubMed] [Google Scholar]
- 15.Dolan E, Stanton A, Thijs L, et al. Superiority of ambulatory over clinic blood pressure measurement in predicting mortality: the Dublin outcome study. Hypertension. 2005;46:156–61. doi: 10.1161/01.HYP.0000170138.56903.7a. [DOI] [PubMed] [Google Scholar]
- 16.Mancia G, Facchetti R, Bombelli M, et al. Long-term risk of mortality associated with selective and combined elevation in office, home, and ambulatory blood pressure. Hypertension. 2006;47:846–53. doi: 10.1161/01.HYP.0000215363.69793.bb. [DOI] [PubMed] [Google Scholar]
- 17.Perloff D, Sokolow M, Cowan R. The prognostic value of ambulatory blood pressures. JAMA. 1983;249:2792–8. [PubMed] [Google Scholar]
- 18.Verdecchia P, Angeli F, Cavallini C. Ambulatory blood pressure for cardiovascular risk stratification. Circulation. 2007;115:2091–3. doi: 10.1161/CIRCULATIONAHA.107.697086. [DOI] [PubMed] [Google Scholar]
- 19.Hansen TW, Jeppesen J, Rasmussen S,I, et al. Ambulatory blood pressure monitoring and risk of cardiovascular disease: a population based study. Am J Hypertens. 2006;19:243–50. doi: 10.1016/j.amjhyper.2005.09.018. [DOI] [PubMed] [Google Scholar]
- 20.Kikuya M, Hansen TW, Thijs L, et al. Diagnostic thresholds for ambulatory blood pressure monitoring based on 10-year cardiovascular risk. Circulation. 2007;115:2145–52. doi: 10.1161/CIRCULATIONAHA.106.662254. [DOI] [PubMed] [Google Scholar]
- 21.Dolan E, Stanton AV, Thom S, et al. Ambulatory blood pressure monitoring predicts cardiovascular events in treated hypertensive patients--an Anglo-Scandinavian cardiac outcomes trial substudy. J Hypertens. 2009;27:876–85. doi: 10.1097/HJH.0b013e328322cd62. [DOI] [PubMed] [Google Scholar]
- 22.Mesquita-Bastos J, Bertoquini S, Polonia J. Cardiovascular prognostic value of ambulatory blood pressure monitoring in a Portuguese hypertensive population followed up for 8.2 years. Blood Press Monit. 15:240–6. doi: 10.1097/MBP.0b013e32833c8b08. [DOI] [PubMed] [Google Scholar]
- 23.Ohkubo T, Kikuya M, Metoki H, et al. Prognosis of “masked” hypertension and “white-coat” hypertension detected by 24-h ambulatory blood pressure monitoring 10-year follow-up from the Ohasama study. J Am Coll Cardiol. 2005;46:508–15. doi: 10.1016/j.jacc.2005.03.070. [DOI] [PubMed] [Google Scholar]
- 24.Staessen JA, Thijs L, Fagard R, et al. Predicting cardiovascular risk using conventional vs ambulatory blood pressure in older patients with systolic hypertension. Systolic Hypertension in Europe Trial Investigators. JAMA. 1999;282:539–46. doi: 10.1001/jama.282.6.539. [DOI] [PubMed] [Google Scholar]
- 25.Ohkubo T, Imai Y, Tsuji I, et al. Prediction of mortality by ambulatory blood pressure monitoring versus screening blood pressure measurements: a pilot study in Ohasama. J Hypertens. 1997;15:357–64. doi: 10.1097/00004872-199715040-00006. [DOI] [PubMed] [Google Scholar]
- 26.Angeli F, Reboldi G, Verdecchia P. Masked Hypertension: Evaluation, Prognosis, and Treatment. Am J Hypertens. doi: 10.1038/ajh.2010.112. [DOI] [PubMed] [Google Scholar]
- 27.Chobanian AV, Bakris GL, Black HR, et al. Seventh Report of the Joint National Committee on Prevention, Detection, Evaluation, and Treatment of High Blood Pressure. Hypertension. 2003;42:1206–52. doi: 10.1161/01.HYP.0000107251.49515.c2. [DOI] [PubMed] [Google Scholar]
- 28.Pickering TG, Miller NH, Ogedegbe G, et al. Call to action on use and reimbursement for home blood pressure monitoring: a joint scientific statement from the American Heart Association, American Society Of Hypertension, and Preventive Cardiovascular Nurses Association. Hypertension. 2008;52:10–29. doi: 10.1161/HYPERTENSIONAHA.107.189010. [DOI] [PMC free article] [PubMed] [Google Scholar]
- 29.Agabiti-Rosei E, Mancia G, O'Rourke MF, et al. Central blood pressure measurements and antihypertensive therapy: a consensus document. Hypertension. 2007;50:154–60. doi: 10.1161/HYPERTENSIONAHA.107.090068. [DOI] [PubMed] [Google Scholar]
- 30.Williams B, Lacy PS. Central aortic pressure and clinical outcomes. J Hypertens. 2009;27:1123–5. doi: 10.1097/HJH.0b013e32832b6566. [DOI] [PubMed] [Google Scholar]
- 31.Chirinos JA, Zambrano JP, Chakko S, et al. Relation between ascending aortic pressures and outcomes in patients with angiographically demonstrated coronary artery disease. Am J Cardiol. 2005;96:645–8. doi: 10.1016/j.amjcard.2005.04.036. [DOI] [PubMed] [Google Scholar]
- 32.Dart AM, Gatzka CD, Kingwell BA, et al. Brachial blood pressure but not carotid arterial waveforms predict cardiovascular events in elderly female hypertensives. Hypertension. 2006;47:785–90. doi: 10.1161/01.HYP.0000209340.33592.50. [DOI] [PubMed] [Google Scholar]
- 33.Jankowski P, Kawecka-Jaszcz K, Czarnecka D, et al. Pulsatile but not steady component of blood pressure predicts cardiovascular events in coronary patients. Hypertension. 2008;51:848–55. doi: 10.1161/HYPERTENSIONAHA.107.101725. [DOI] [PubMed] [Google Scholar]
- 34.Pini R, Cavallini MC, Palmieri V, et al. Central but not brachial blood pressure predicts cardiovascular events in an unselected geriatric population: the ICARe Dicomano Study. J Am Coll Cardiol. 2008;51:2432–9. doi: 10.1016/j.jacc.2008.03.031. [DOI] [PubMed] [Google Scholar]
- 35.Roman MJ, Devereux RB, Kizer JR, et al. Central pressure more strongly relates to vascular disease and outcome than does brachial pressure: the Strong Heart Study. Hypertension. 2007;50:197–203. doi: 10.1161/HYPERTENSIONAHA.107.089078. [DOI] [PubMed] [Google Scholar]
- 36.Safar ME, Blacher J, Pannier B, et al. Central pulse pressure and mortality in end-stage renal disease. Hypertension. 2002;39:735–8. doi: 10.1161/hy0202.098325. [DOI] [PubMed] [Google Scholar]
- 37.Wang KL, Cheng HM, Chuang SY, et al. Central or peripheral systolic or pulse pressure: which best relates to target organs and future mortality? J Hypertens. 2009;27:461–7. doi: 10.1097/hjh.0b013e3283220ea4. [DOI] [PMC free article] [PubMed] [Google Scholar]
- 38.Williams B, Lacy PS, Thom SM, et al. Differential impact of blood pressure-lowering drugs on central aortic pressure and clinical outcomes: principal results of the Conduit Artery Function Evaluation (CAFE) study. Circulation. 2006;113:1213–25. doi: 10.1161/CIRCULATIONAHA.105.595496. [DOI] [PubMed] [Google Scholar]
- 39.McEniery CM, Yasmin, McDonnell B, et al. Central pressure: variability and impact of cardiovascular risk factors: the Anglo-Cardiff Collaborative Trial II. Hypertension. 2008;51:1476–82. doi: 10.1161/HYPERTENSIONAHA.107.105445. [DOI] [PubMed] [Google Scholar]
- 40.Pickering TG, Eguchi K, Kario K. Masked hypertension: a review. Hypertens Res. 2007;30:479–88. doi: 10.1291/hypres.30.479. [DOI] [PubMed] [Google Scholar]
- 41.Verdecchia P, Angeli F, Gattobigio R, et al. The clinical significance of white-coat and masked hypertension. Blood Press Monit. 2007;12:387–9. doi: 10.1097/MBP.0b013e32824958e5. [DOI] [PubMed] [Google Scholar]
- 42.Sega R, Trocino G, Lanzarotti A, et al. Alterations of cardiac structure in patients with isolated office, ambulatory, or home hypertension: Data from the general population (Pressione Arteriose Monitorate E Loro Associazioni [PAMELA] Study). Circulation. 2001;104:1385–92. doi: 10.1161/hc3701.096100. [DOI] [PubMed] [Google Scholar]
- 43.Banegas JR, Messerli FH, Waeber B, et al. Discrepancies between office and ambulatory blood pressure: clinical implications. Am J Med. 2009;122:1136–41. doi: 10.1016/j.amjmed.2009.05.020. [DOI] [PubMed] [Google Scholar]
- 44.Svensson P, de Faire U, Sleight P, et al. Comparative effects of ramipril on ambulatory and office blood pressures: a HOPE Substudy. Hypertension. 2001;38:E28–32. doi: 10.1161/hy1101.099502. [DOI] [PubMed] [Google Scholar]
- 45.Law MR, Morris JK, Wald NJ. Use of blood pressure lowering drugs in the prevention of cardiovascular disease: meta-analysis of 147 randomised trials in the context of expectations from prospective epidemiological studies. BMJ. 2009;338:b1665. doi: 10.1136/bmj.b1665. [DOI] [PMC free article] [PubMed] [Google Scholar]
- 46.Pitt B. Angiotensin-converting enzyme inhibitors in patients with vascular disease. Eur Heart J. 2009;30:1307–9. doi: 10.1093/eurheartj/ehp169. [DOI] [PubMed] [Google Scholar]
- 47.Turnbull F, Neal B, Pfeffer M, et al. Blood pressure-dependent and independent effects of agents that inhibit the renin-angiotensin system. J Hypertens. 2007;25:951–8. doi: 10.1097/HJH.0b013e3280bad9b4. [DOI] [PubMed] [Google Scholar]
- 48.Verdecchia P, Reboldi G, Angeli F, et al. Angiotensin-converting enzyme inhibitors and calcium channel blockers for coronary heart disease and stroke prevention. Hypertension. 2005;46:386–92. doi: 10.1161/01.HYP.0000174591.42889.a2. [DOI] [PubMed] [Google Scholar]
- 49.Brugts JJ, Ninomiya T, Boersma E, et al. The consistency of the treatment effect of an ACE-inhibitor based treatment regimen in patients with vascular disease or high risk of vascular disease: a combined analysis of individual data of ADVANCE, EUROPA, and PROGRESS trials. Eur Heart J. 2009;30:1385–94. doi: 10.1093/eurheartj/ehp103. [DOI] [PubMed] [Google Scholar]
- 50.Braunwald E, Domanski MJ, Fowler SE, et al. Angiotensin-converting-enzyme inhibition in stable coronary artery disease. N Engl J Med. 2004;351:2058–68. doi: 10.1056/NEJMoa042739. [DOI] [PMC free article] [PubMed] [Google Scholar]
- 51.Heeneman S, Sluimer JC, Daemen MJ. Angiotensin-converting enzyme and vascular remodeling. Circ Res. 2007;101:441–54. doi: 10.1161/CIRCRESAHA.107.148338. [DOI] [PubMed] [Google Scholar]
- 52.Nissen SE, Tuzcu EM, Libby P, et al. Effect of antihypertensive agents on cardiovascular events in patients with coronary disease and normal blood pressure: the CAMELOT study: a randomized controlled trial. JAMA. 2004;292:2217–25. doi: 10.1001/jama.292.18.2217. [DOI] [PubMed] [Google Scholar]
- 53.Bangalore S, Messerli FH, Kostis JB, Pepine CJ. Cardiovascular protection using beta-blockers: a critical review of the evidence. J Am Coll Cardiol. 2007;50:563–72. doi: 10.1016/j.jacc.2007.04.060. [DOI] [PubMed] [Google Scholar]
- 54.Dahlof B, Pennert K, Hansson L. Regression of left ventricular hypertrophy--a meta-analysis. Clin Exp Hypertens A. 1992;14:173–80. doi: 10.3109/10641969209036180. [DOI] [PubMed] [Google Scholar]
- 55.Safar ME, Jankowski P. Central blood pressure and hypertension: role in cardiovascular risk assessment. Clin Sci (Lond) 2009;116:273–82. doi: 10.1042/CS20080072. [DOI] [PubMed] [Google Scholar]
- 56.Cohen JC, Boerwinkle E, Mosley TH, Jr., Hobbs HH. Sequence variations in PCSK9, low LDL, and protection against coronary heart disease. N Engl J Med. 2006;354:1264–72. doi: 10.1056/NEJMoa054013. [DOI] [PubMed] [Google Scholar]
- 57.Grundy SM, Wilhelmsen L, Rose G, et al. Coronary heart disease in high-risk populations: lessons from Finland. Eur Heart J. 1990;11:462–71. doi: 10.1093/oxfordjournals.eurheartj.a059730. [DOI] [PubMed] [Google Scholar]
- 58.Friedewald WT, Levy RI, Fredrickson DS. Estimation of the concentration of low-density lipoprotein cholesterol in plasma, without use of the preparative ultracentrifuge. Clin Chem. 1972;18:499–502. [PubMed] [Google Scholar]
- 59.Barter PJ, Ballantyne CM, Carmena R, et al. Apo B versus cholesterol in estimating cardiovascular risk and in guiding therapy: report of the thirty-person/ten-country panel. J Intern Med. 2006;259:247–58. doi: 10.1111/j.1365-2796.2006.01616.x. [DOI] [PubMed] [Google Scholar]
- 60.Sniderman A, Williams K, Cobbaert C. ApoB versus non-HDL-C: what to do when they disagree. Curr Atheroscler Rep. 2009;11:358–63. doi: 10.1007/s11883-009-0054-2. [DOI] [PubMed] [Google Scholar]
- 61.Burnett JR, Watts GF. Estimating LDL ApoB: infomania or clinical advance? Clin Chem. 2008;54:782–4. doi: 10.1373/clinchem.2008.104505. [DOI] [PubMed] [Google Scholar]
- 62.Jeyarajah EJ, Cromwell WC, Otvos JD. Lipoprotein particle analysis by nuclear magnetic resonance spectroscopy. Clin Lab Med. 2006;26:847–70. doi: 10.1016/j.cll.2006.07.006. [DOI] [PubMed] [Google Scholar]
- 63.de Graaf J, Couture P, Sniderman A. A diagnostic algorithm for the atherogenic apolipoprotein B dyslipoproteinemias. Nat Clin Pract Endocrinol Metab. 2008;4:608–18. doi: 10.1038/ncpendmet0982. [DOI] [PubMed] [Google Scholar]
- 64.Walldius G, Jungner I, Holme I, et al. High apolipoprotein B, low apolipoprotein A-I, and improvement in the prediction of fatal myocardial infarction (AMORIS study): a prospective study. Lancet. 2001;358:2026–33. doi: 10.1016/S0140-6736(01)07098-2. [DOI] [PubMed] [Google Scholar]
- 65.Cromwell WC, Otvos JD, Keyes MJ, et al. LDL Particle number and risk of future cardiovascular disease in the Framingham Offspring Study - Implications for LDL Management. J Clin Lipidol. 2007;1:583–92. doi: 10.1016/j.jacl.2007.10.001. [DOI] [PMC free article] [PubMed] [Google Scholar]
- 66.Cromwell WC, Otvos JD. Heterogeneity of low-density lipoprotein particle number in patients with type 2 diabetes mellitus and low-density lipoprotein cholesterol <100 mg/dl. Am J Cardiol. 2006;98:1599–602. doi: 10.1016/j.amjcard.2006.07.036. [DOI] [PubMed] [Google Scholar]
- 67.Sniderman AD, St-Pierre AC, Cantin B, et al. Concordance/discordance between plasma apolipoprotein B levels and the cholesterol indexes of atherosclerotic risk. Am J Cardiol. 2003;91:1173–7. doi: 10.1016/s0002-9149(03)00262-5. [DOI] [PubMed] [Google Scholar]
- 68.Stein EA, Sniderman A, Laskarzewski P. Assessment of reaching goal in patients with combined hyperlipidemia: low-density lipoprotein cholesterol, non-high-density lipoprotein cholesterol, or apolipoprotein B. Am J Cardiol. 2005;96:36K–43K. doi: 10.1016/j.amjcard.2005.08.006. discussion 34K-5K. [DOI] [PubMed] [Google Scholar]
- 69.Ridker PM, Danielson E, Fonseca FA, et al. Rosuvastatin to prevent vascular events in men and women with elevated C-reactive protein. N Engl J Med. 2008;359:2195–207. doi: 10.1056/NEJMoa0807646. [DOI] [PubMed] [Google Scholar]
- 70.Sniderman A. Targets for LDL-lowering therapy. Curr Opin Lipidol. 2009;20:282–7. doi: 10.1097/MOL.0b013e32832ca1d6. [DOI] [PubMed] [Google Scholar]
- 71.Third Report of the National Cholesterol Education Program (NCEP) Expert Panel on Detection, Evaluation, and Treatment of High Blood Cholesterol in Adults (Adult Treatment Panel III) final report. Circulation. 2002;106:3143–421. [PubMed] [Google Scholar]
- 72.Ridker PM, Paynter NP, Rifai N, et al. C-reactive protein and parental history improve global cardiovascular risk prediction: the Reynolds Risk Score for men. Circulation. 2008;118:2243–51. doi: 10.1161/CIRCULATIONAHA.108.814251. [DOI] [PMC free article] [PubMed] [Google Scholar]
- 73.Seshadri S, Beiser A, Pikula A, et al. Parental occurrence of stroke and risk of stroke in their children: the Framingham study. Circulation. 121:1304–12. doi: 10.1161/CIRCULATIONAHA.109.854240. [DOI] [PMC free article] [PubMed] [Google Scholar]
- 74.Jerrard-Dunne P, Cloud G, Hassan A, Markus HS. Evaluating the genetic component of ischemic stroke subtypes: a family history study. Stroke. 2003;34:1364–9. doi: 10.1161/01.STR.0000069723.17984.FD. [DOI] [PubMed] [Google Scholar]
- 75.Assmann G, Cullen P, Schulte H. Simple scoring scheme for calculating the risk of acute coronary events based on the 10-year follow-up of the prospective cardiovascular Munster (PROCAM) study. Circulation. 2002;105:310–5. doi: 10.1161/hc0302.102575. [DOI] [PubMed] [Google Scholar]
- 76.Lloyd-Jones DM, Nam BH, D'Agostino RB, Sr., et al. Parental cardiovascular disease as a risk factor for cardiovascular disease in middle-aged adults: a prospective study of parents and offspring. JAMA. 2004;291:2204–11. doi: 10.1001/jama.291.18.2204. [DOI] [PubMed] [Google Scholar]
- 77.Murabito JM, Pencina MJ, Nam BH, et al. Sibling cardiovascular disease as a risk factor for cardiovascular disease in middle-aged adults. JAMA. 2005;294:3117–23. doi: 10.1001/jama.294.24.3117. [DOI] [PubMed] [Google Scholar]
- 78.Murabito JM, Nam BH, D'Agostino RB, Sr., et al. Accuracy of offspring reports of parental cardiovascular disease history: the Framingham Offspring Study. Ann Intern Med. 2004;140:434–40. doi: 10.7326/0003-4819-140-6-200403160-00010. [DOI] [PubMed] [Google Scholar]
- 79.Awareness of family health history as a risk factor for disease--United States, 2004. MMWR Morb Mortal Wkly Rep. 2004;53:1044–7. [PubMed] [Google Scholar]
- 80.Wilson BJ, Qureshi N, Santaguida P, et al. Systematic review: family history in risk assessment for common diseases. Ann Intern Med. 2009;151:878–85. doi: 10.7326/0003-4819-151-12-200912150-00177. [DOI] [PubMed] [Google Scholar]
- 81.Arnett DK. Summary of the American Heart Association's scientific statement on the relevance of genetics and genomics for prevention and treatment of cardiovascular disease. Arterioscler Thromb Vasc Biol. 2007;27:1682–6. doi: 10.1161/ATVBAHA.107.147207. [DOI] [PubMed] [Google Scholar]
- 82.Morgan TM, Krumholz HM, Lifton RP, Spertus JA. Nonvalidation of reported genetic risk factors for acute coronary syndrome in a large-scale replication study. JAMA. 2007;297:1551–61. doi: 10.1001/jama.297.14.1551. [DOI] [PubMed] [Google Scholar]
- 83.Siontis KC, Patsopoulos NA, Ioannidis JP. Replication of past candidate loci for common diseases and phenotypes in 100 genome-wide association studies. Eur J Hum Genet. 18:832–37. doi: 10.1038/ejhg.2010.26. [DOI] [PMC free article] [PubMed] [Google Scholar]
- 84.Altshuler D, Daly MJ, Lander ES. Genetic mapping in human disease. Science. 2008;322:881–88. doi: 10.1126/science.1156409. [DOI] [PMC free article] [PubMed] [Google Scholar]
- 85.Attia J, Ioannidis JP, Thakkinstian A, et al. How to use an article about genetic association: C: What are the results and will they help me in caring for my patients? JAMA. 2009;301:304–8. doi: 10.1001/jama.2008.993. [DOI] [PubMed] [Google Scholar]
- 86.Attia J, Ioannidis JP, Thakkinstian A, et al. How to use an article about genetic association: B: Are the results of the study valid? JAMA. 2009;301:191–7. doi: 10.1001/jama.2008.946. [DOI] [PubMed] [Google Scholar]
- 87.Hirschhorn JN, Daly MJ. Genome-wide association studies for common diseases and complex traits. Nat Rev Genet. 2005;6:95–108. doi: 10.1038/nrg1521. [DOI] [PubMed] [Google Scholar]
- 88.Kruglyak L. The road to genome-wide association studies. Nat Rev Genet. 2008;9:314–8. doi: 10.1038/nrg2316. [DOI] [PubMed] [Google Scholar]
- 89.McCarthy MI, Abecasis GR, Cardon LR, et al. Genome-wide association studies for complex traits: consensus, uncertainty and challenges. Nat Rev Genet. 2008;9:356–69. doi: 10.1038/nrg2344. [DOI] [PubMed] [Google Scholar]
- 90.Shiffman D, Chasman DI, Zee RY, et al. A kinesin family member 6 variant is associated with coronary heart disease in the Women's Health Study. J Am Coll Cardiol. 2008;51:444–8. doi: 10.1016/j.jacc.2007.09.044. [DOI] [PubMed] [Google Scholar]
- 91.Assimes TL, Holm H, Kathiresan S, et al. Lack of association between the Trp719Arg polymorphism in kinesin-like protein-6 and coronary artery disease in 19 case-control studies. J Am Coll Cardiol. 56:1552–63. doi: 10.1016/j.jacc.2010.06.022. [DOI] [PMC free article] [PubMed] [Google Scholar]
- 92.Aulchenko YS, Ripatti S, Lindqvist I, et al. Loci influencing lipid levels and coronary heart disease risk in 16 European population cohorts. Nat Genet. 2009;41:47–55. doi: 10.1038/ng.269. [DOI] [PMC free article] [PubMed] [Google Scholar]
- 93.Kathiresan S, Melander O, Anevski D, et al. Polymorphisms associated with cholesterol and risk of cardiovascular events. N Engl J Med. 2008;358:1240–9. doi: 10.1056/NEJMoa0706728. [DOI] [PubMed] [Google Scholar]
- 94.Kathiresan S, Melander O, Guiducci C, et al. Six new loci associated with blood low-density lipoprotein cholesterol, high-density lipoprotein cholesterol or triglycerides in humans. Nat Genet. 2008;40:189–97. doi: 10.1038/ng.75. [DOI] [PMC free article] [PubMed] [Google Scholar]
- 95.Sabatti C, Service SK, Hartikainen AL, et al. Genome-wide association analysis of metabolic traits in a birth cohort from a founder population. Nat Genet. 2009;41:35–46. doi: 10.1038/ng.271. [DOI] [PMC free article] [PubMed] [Google Scholar]
- 96.Teslovich TM, Musunuru K, Smith AV, et al. Biological, clinical and population relevance of 95 loci for blood lipids. Nature. 466:707–13. doi: 10.1038/nature09270. [DOI] [PMC free article] [PubMed] [Google Scholar]
- 97.Willer CJ, Sanna S, Jackson AU, et al. Newly identified loci that influence lipid concentrations and risk of coronary artery disease. Nat Genet. 2008;40:161–9. doi: 10.1038/ng.76. [DOI] [PMC free article] [PubMed] [Google Scholar]
- 98.Levy D, Ehret GB, Rice K, et al. Genome-wide association study of blood pressure and hypertension. Nat Genet. 2009;41:677–87. doi: 10.1038/ng.384. [DOI] [PMC free article] [PubMed] [Google Scholar]
- 99.Newton-Cheh C, Johnson T, Gateva V, et al. Genome-wide association study identifies eight loci associated with blood pressure. Nat Genet. 2009;41:666–76. doi: 10.1038/ng.361. [DOI] [PMC free article] [PubMed] [Google Scholar]
- 100.Frayling TM, Timpson NJ, Weedon MN, et al. A common variant in the FTO gene is associated with body mass index and predisposes to childhood and adult obesity. Science. 2007;316:889–94. doi: 10.1126/science.1141634. [DOI] [PMC free article] [PubMed] [Google Scholar]
- 101.Lindgren CM, Heid IM, Randall JC, et al. Genome-wide association scan meta-analysis identifies three Loci influencing adiposity and fat distribution. PLoS Genet. 2009;5:e1000508. doi: 10.1371/journal.pgen.1000508. [DOI] [PMC free article] [PubMed] [Google Scholar]
- 102.Speliotes EK, Willer CJ, Berndt SI, et al. Association analyses of 249,796 individuals reveal 18 new loci associated with body mass index. Nat Genet. 42:937–48. doi: 10.1038/ng.686. [DOI] [PMC free article] [PubMed] [Google Scholar]
- 103.Thorleifsson G, Walters GB, Gudbjartsson DF, et al. Genome-wide association yields new sequence variants at seven loci that associate with measures of obesity. Nat Genet. 2009;41:18–24. doi: 10.1038/ng.274. [DOI] [PubMed] [Google Scholar]
- 104.Willer CJ, Speliotes EK, Loos RJ, et al. Six new loci associated with body mass index highlight a neuronal influence on body weight regulation. Nat Genet. 2009;41:25–34. doi: 10.1038/ng.287. [DOI] [PMC free article] [PubMed] [Google Scholar]
- 105.Liu JZ, Tozzi F, Waterworth DM, et al. Meta-analysis and imputation refines the association of 15q25 with smoking quantity. Nat Genet. 42:436–40. doi: 10.1038/ng.572. [DOI] [PMC free article] [PubMed] [Google Scholar]
- 106.Thorgeirsson TE, Gudbjartsson DF, Surakka I, et al. Sequence variants at CHRNB3-CHRNA6 and CYP2A6 affect smoking behavior. Nat Genet. 42:448–53. doi: 10.1038/ng.573. [DOI] [PMC free article] [PubMed] [Google Scholar]
- 107.Rung J, Cauchi S, Albrechtsen A, et al. Genetic variant near IRS1 is associated with type 2 diabetes, insulin resistance and hyperinsulinemia. Nat Genet. 2009;41:1110–5. doi: 10.1038/ng.443. [DOI] [PubMed] [Google Scholar]
- 108.Saxena R, Voight BF, Lyssenko V, et al. Genome-wide association analysis identifies loci for type 2 diabetes and triglyceride levels. Science. 2007;316:1331–6. doi: 10.1126/science.1142358. [DOI] [PubMed] [Google Scholar]
- 109.Scott LJ, Mohlke KL, Bonnycastle LL, et al. A genome-wide association study of type 2 diabetes in Finns detects multiple susceptibility variants. Science. 2007;316:1341–5. doi: 10.1126/science.1142382. [DOI] [PMC free article] [PubMed] [Google Scholar]
- 110.Sladek R, Rocheleau G, Rung J, et al. A genome-wide association study identifies novel risk loci for type 2 diabetes. Nature. 2007;445:881–5. doi: 10.1038/nature05616. [DOI] [PubMed] [Google Scholar]
- 111.Steinthorsdottir V, Thorleifsson G, Reynisdottir I, et al. A variant in CDKAL1 influences insulin response and risk of type 2 diabetes. Nat Genet. 2007;39:770–5. doi: 10.1038/ng2043. [DOI] [PubMed] [Google Scholar]
- 112.Voight BF, Scott LJ, Steinthorsdottir V, et al. Twelve type 2 diabetes susceptibility loci identified through large-scale association analysis. Nat Genet. 42:579–89. doi: 10.1038/ng.609. [DOI] [PMC free article] [PubMed] [Google Scholar]
- 113.Zeggini E, Scott LJ, Saxena R, et al. Meta-analysis of genome-wide association data and large-scale replication identifies additional susceptibility loci for type 2 diabetes. Nat Genet. 2008;40:638–45. doi: 10.1038/ng.120. [DOI] [PMC free article] [PubMed] [Google Scholar]
- 114.Zeggini E, Weedon MN, Lindgren CM, et al. Replication of genome-wide association signals in UK samples reveals risk loci for type 2 diabetes. Science. 2007;316:1336–41. doi: 10.1126/science.1142364. [DOI] [PMC free article] [PubMed] [Google Scholar]
- 115.Erdmann J, Grosshennig A, Braund PS, et al. New susceptibility locus for coronary artery disease on chromosome 3q22.3. Nat Genet. 2009;41:280–2. doi: 10.1038/ng.307. [DOI] [PMC free article] [PubMed] [Google Scholar]
- 116.Kathiresan S, Voight BF, Purcell S, et al. Genome-wide association of early-onset myocardial infarction with single nucleotide polymorphisms and copy number variants. Nat Genet. 2009;41:334–41. doi: 10.1038/ng.327. [DOI] [PMC free article] [PubMed] [Google Scholar]
- 117.Genome-wide meta-analyses identify multiple loci associated with smoking behavior. Nat Genet. 42:441–7. doi: 10.1038/ng.571. [DOI] [PMC free article] [PubMed] [Google Scholar]
- 118.Samani NJ, Erdmann J, Hall AS, et al. Genomewide association analysis of coronary artery disease. N Engl J Med. 2007;357:443–53. doi: 10.1056/NEJMoa072366. [DOI] [PMC free article] [PubMed] [Google Scholar]
- 119.Helgadottir A, Gretarsdottir S, St Clair D, et al. Association between the gene encoding 5-lipoxygenase-activating protein and stroke replicated in a Scottish population. Am J Hum Genet. 2005;76:505–9. doi: 10.1086/428066. [DOI] [PMC free article] [PubMed] [Google Scholar]
- 120.McPherson R, Pertsemlidis A, Kavaslar N, et al. A common allele on chromosome 9 associated with coronary heart disease. Science. 2007;316:1488–91. doi: 10.1126/science.1142447. [DOI] [PMC free article] [PubMed] [Google Scholar]
- 121.Helgadottir A, Thorleifsson G, Manolescu A, et al. A common variant on chromosome 9p21 affects the risk of myocardial infarction. Science. 2007;316:1491–3. doi: 10.1126/science.1142842. [DOI] [PubMed] [Google Scholar]
- 122.Genome-wide association study of 14,000 cases of seven common diseases and 3,000 shared controls. Nature. 2007;447:661–78. doi: 10.1038/nature05911. [DOI] [PMC free article] [PubMed] [Google Scholar]
- 123.Hinohara K, Nakajima T, Takahashi M, et al. Replication of the association between a chromosome 9p21 polymorphism and coronary artery disease in Japanese and Korean populations. J Hum Genet. 2008;53:357–9. doi: 10.1007/s10038-008-0248-4. [DOI] [PubMed] [Google Scholar]
- 124.Jarinova O, Stewart AF, Roberts R, et al. Functional analysis of the chromosome 9p21.3 coronary artery disease risk locus. Arterioscler Thromb Vasc Biol. 2009;29:1671–7. doi: 10.1161/ATVBAHA.109.189522. [DOI] [PubMed] [Google Scholar]
- 125.Brautbar A, Ballantyne CM, Lawson K, et al. Impact of adding a single allele in the 9p21 locus to traditional risk factors on reclassification of coronary heart disease risk and implications for lipid-modifying therapy in the Atherosclerosis Risk in Communities study. Circ Cardiovasc Genet. 2009;2:279–85. doi: 10.1161/CIRCGENETICS.108.817338. [DOI] [PMC free article] [PubMed] [Google Scholar]
- 126.Ripatti S, Tikkanen E, Orho-Melander M, et al. A multilocus genetic risk score for coronary heart disease: case-control and prospective cohort analyses. Lancet. 2010;376:1393–400. doi: 10.1016/S0140-6736(10)61267-6. [DOI] [PMC free article] [PubMed] [Google Scholar]
- 127.Preuss M, Konig IR, Thompson JR, et al. Design of the Coronary ARtery DIsease Genome-Wide Replication And Meta-Analysis (CARDIoGRAM) Study: A Genome-wide association meta-analysis involving more than 22 000 cases and 60 000 controls. Circ Cardiovasc Genet. 2010;3:475–83. doi: 10.1161/CIRCGENETICS.109.899443. [DOI] [PMC free article] [PubMed] [Google Scholar]
- 128.Kathiresan S, Voight BF, Purcell S, et al. Genome-wide association of early-onset myocardial infarction with single nucleotide polymorphisms and copy number variants. Nat Genet. 2009;41:334–41. doi: 10.1038/ng.327. [DOI] [PMC free article] [PubMed] [Google Scholar]
- 129.Li Y, Vinckenbosch N, Tian G, et al. Resequencing of 200 human exomes identifies an excess of low-frequency non-synonymous coding variants. Nat Genet. 2010;42:969–72. doi: 10.1038/ng.680. [DOI] [PubMed] [Google Scholar]
- 130.Musunuru K, Pirruccello JP, Do R, et al. Exome Sequencing, ANGPTL3 Mutations, and Familial Combined Hypolipidemia. N Engl J Med. 2010;363:2220–7. doi: 10.1056/NEJMoa1002926. [DOI] [PMC free article] [PubMed] [Google Scholar]
- 131.Pelak K, Shianna KV, Ge D, et al. The characterization of twenty sequenced human genomes. PLoS Genet. :6. doi: 10.1371/journal.pgen.1001111. [DOI] [PMC free article] [PubMed] [Google Scholar]
- 132.Roach JC, Glusman G, Smit AF, et al. Analysis of genetic inheritance in a family quartet by whole-genome sequencing. Science. 2010;328:636–9. doi: 10.1126/science.1186802. [DOI] [PMC free article] [PubMed] [Google Scholar]
- 133.Ashley EA, Butte AJ, Wheeler MT, et al. Clinical assessment incorporating a personal genome. Lancet. 2010;375:1525–35. doi: 10.1016/S0140-6736(10)60452-7. [DOI] [PMC free article] [PubMed] [Google Scholar]
- 134.Human genome: Genomes by the thousand. Nature. 2010;467:1026–7. doi: 10.1038/4671026a. [DOI] [PubMed] [Google Scholar]
- 135.Cooney MT, Dudina AL, Graham IM. Value and limitations of existing scores for the assessment of cardiovascular risk: a review for clinicians. J Am Coll Cardiol. 2009;54:1209–27. doi: 10.1016/j.jacc.2009.07.020. [DOI] [PubMed] [Google Scholar]
- 136.Cook NR. Use and misuse of the receiver operating characteristic curve in risk prediction. Circulation. 2007;115:928–35. doi: 10.1161/CIRCULATIONAHA.106.672402. [DOI] [PubMed] [Google Scholar]
- 137.de Ruijter W, Westendorp RG, Assendelft WJ, et al. Use of Framingham risk score and new biomarkers to predict cardiovascular mortality in older people: population based observational cohort study. BMJ. 2009;338:a3083. doi: 10.1136/bmj.a3083. [DOI] [PMC free article] [PubMed] [Google Scholar]
- 138.Grundy SM. Age as a risk factor: you are as old as your arteries. Am J Cardiol. 1999;83:1455–7. A7. doi: 10.1016/s0002-9149(99)00125-3. [DOI] [PubMed] [Google Scholar]
- 139.Sniderman AD, Furberg CD. Age as a modifiable risk factor for cardiovascular disease. Lancet. 2008;371:1547–9. doi: 10.1016/S0140-6736(08)60313-X. [DOI] [PubMed] [Google Scholar]
- 140.Grundy SM. Coronary plaque as a replacement for age as a risk factor in global risk assessment. Am J Cardiol. 2001;88:8E–11E. doi: 10.1016/s0002-9149(01)01712-x. [DOI] [PubMed] [Google Scholar]
- 141.Grundy SM. Promise of low-density lipoprotein-lowering therapy for primary and secondary prevention. Circulation. 2008;117:569–73. doi: 10.1161/CIRCULATIONAHA.107.720300. [DOI] [PubMed] [Google Scholar]
- 142.Nasir K, Vasamreddy C, Blumenthal RS, Rumberger JA. Comprehensive coronary risk determination in primary prevention: an imaging and clinical based definition combining computed tomographic coronary artery calcium score and national cholesterol education program risk score. Int J Cardiol. 2006;110:129–36. doi: 10.1016/j.ijcard.2005.09.009. [DOI] [PubMed] [Google Scholar]
- 143.Schisterman EF, Whitcomb BW. Coronary age as a risk factor in the modified Framingham risk score. BMC Med Imaging. 2004;4:1. doi: 10.1186/1471-2342-4-1. [DOI] [PMC free article] [PubMed] [Google Scholar]
- 144.Sirineni GK, Raggi P, Shaw LJ, Stillman AE. Calculation of coronary age using calcium scores in multiple ethnicities. Int J Cardiovasc Imaging. 2008;24:107–11. doi: 10.1007/s10554-007-9233-9. [DOI] [PubMed] [Google Scholar]
- 145.Stein JH, Fraizer MC, Aeschlimann SE, et al. Vascular age: integrating carotid intima-media thickness measurements with global coronary risk assessment. Clin Cardiol. 2004;27:388–92. doi: 10.1002/clc.4960270704. [DOI] [PMC free article] [PubMed] [Google Scholar]
- 146.McClelland RL, Nasir K, Budoff M, et al. Arterial age as a function of coronary artery calcium (from the Multi-Ethnic Study of Atherosclerosis [MESA]). Am J Cardiol. 2009;103:59–63. doi: 10.1016/j.amjcard.2008.08.031. [DOI] [PMC free article] [PubMed] [Google Scholar]
- 147.Multi-Ethnic Study of Atherosclerosis Coronary Artery Calcium Tools. [July 1, 2011]; Available at: http://www.mesa-nhlbi.org/CACReference.aspx.
- 148.Budoff MJ, Nasir K, McClelland RL, et al. Coronary calcium predicts events better with absolute calcium scores than age-sex-race/ethnicity percentiles: MESA (Multi-Ethnic Study of Atherosclerosis). J Am Coll Cardiol. 2009;53:345–52. doi: 10.1016/j.jacc.2008.07.072. [DOI] [PMC free article] [PubMed] [Google Scholar]
- 149.Ford ES, Ajani UA, Croft JB, et al. Explaining the decrease in U.S. deaths from coronary disease, 1980-2000. N Engl J Med. 2007;356:2388–98. doi: 10.1056/NEJMsa053935. [DOI] [PubMed] [Google Scholar]
- 150.Box G, Draper N. Empirical Model-Building and Response Surfaces. Wiley; New York: 1987. [Google Scholar]
- 151.Brunzell JD, Davidson M, Furberg CD, et al. Lipoprotein management in patients with cardiometabolic risk: consensus conference report from the American Diabetes Association and the American College of Cardiology Foundation. J Am Coll Cardiol. 2008;51:1512–24. doi: 10.1016/j.jacc.2008.02.034. [DOI] [PubMed] [Google Scholar]
- 152.Budoff M. Aged garlic extract retards progression of coronary artery calcification. J Nutr. 2006;136:741S–4S. doi: 10.1093/jn/136.3.741S. [DOI] [PubMed] [Google Scholar]
- 153.Greenland P, Alpert JS, Beller GA, et al. ACCF/AHA guideline for assessment of cardiovascular risk in asymptomatic adults: a report of the American College of Cardiology Foundation/American Heart Association Task Force on Practice Guidelines. J Am Coll Cardiol. 2010;56:e50–103. doi: 10.1016/j.jacc.2010.09.001. [DOI] [PubMed] [Google Scholar]
- 154.Greenland P, Bonow RO, Brundage BH, et al. ACCF/AHA 2007 clinical expert consensus document on coronary artery calcium scoring by computed tomography in global cardiovascular risk assessment and in evaluation of patients with chest pain: a report of the American College of Cardiology Foundation Clinical Expert Consensus Task Force (ACCF/AHA Writing Committee to Update the 2000 Expert Consensus Document on Electron Beam Computed Tomography). Circulation. 2007;115:402–26. doi: 10.1161/CIRCULATIONAHA..107.181425. [DOI] [PubMed] [Google Scholar]
- 155.Stein JH, Korcarz CE, Hurst RT, et al. Use of carotid ultrasound to identify subclinical vascular disease and evaluate cardiovascular disease risk: a consensus statement from the American Society of Echocardiography Carotid Intima-Media Thickness Task Force. Endorsed by the Society for Vascular Medicine. J Am Soc Echocardiogr. 2008;21:93–111. doi: 10.1016/j.echo.2007.11.011. quiz 89-90. [DOI] [PubMed] [Google Scholar]
- 156.deGoma EM, Karlsberg RP, Judelson DR, Budoff MJ. The underappreciated impact of heart disease. Womens Health Issues. 2010;20:299–303. doi: 10.1016/j.whi.2010.05.001. [DOI] [PubMed] [Google Scholar]
- 157.SunTechMedical. 2010 [Google Scholar]
- 158.Ramjee V, Sperling LS, Jacobson TA. Non-high-density lipoprotein cholesterol versus apolipoprotein B in cardiovascular risk stratification do the math. J Am Coll Cardiol. 58:457–63. doi: 10.1016/j.jacc.2011.05.009. [DOI] [PubMed] [Google Scholar]