Abstract
BACKGROUND
This study was conducted to prospectively evaluate dynamic contrast-enhanced MRI (DCE-MRI) as an early imaging indicator of tumor histologic response to preoperative chemotherapy and as a possible prognostic factor for event-free survival (EFS) and overall survival in pediatric patients with newly diagnosed nonmetastatic osteosarcoma (OS) treated on a single multi-institutional phase II trial.
METHODS
Three serial DCE-MRI examinations at week 0 (prior to treatment), week 9, and week 12 (tumor resection) were performed in 69 patients with nonmetastatic osteosarcoma to monitor the response to preoperative chemotherapy. DCE-MRI kinetic parameters (Ktrans, kep, ve, and vp) and corresponding differences (ΔKtrans, Δkep, Δve, and Δvp) of averaged kinetic parameters between outer and inner half tumor were calculated to assess their associations with tumor histologic response, EFS, and overall survival.
RESULTS
Ktrans, ve, vp, and kep significantly decreased from week 0 to week 9 and week 12. Ktrans, vp, and Δkep at week 9 were significantly different between responders and nonresponders, P=0.046, 0.021, and 0.008, respectively. These three parameters were indicative of histologic response. Δve at week 0 was a significant prognostic factor for both EFS (P=0.02) and overall survival (P=0.03).
CONCLUSIONS
DCE-MRI was a prognostic factor for EFS and overall survival before treatment on this trial and indicative of histologic response to neoadjuvant therapy. Further studies are needed to verify these findings with other treatment regimens and establish the potential role of DCE-MRI in the development of risk-adapted therapy for osteosarcoma.
Keywords: Osteosarcoma, Tumor microcirculation, Dynamic contrast-enhanced MRI, Prognostic factors, Tumor response, Outcome
INTRODUCTION
Osteosarcoma (OS) is the most common malignant bone tumors in children in the United States1. The current treatment for nonmetastatic OS is based on neoadjuvant chemotherapy to induce tumor necrosis and reduce primary tumor volume to facilitate subsequent tumor resection2. This strategy of preoperative and postoperative chemotherapy in combination with aggressive surgery has improved long-term survival from 20% to 60~70% compared with surgery alone3–7. However, there is no robust prognostic factor to stratify the OS patients for risk-adapted therapy. Even though histologic response, the degree of necrosis induced by chemotherapy before surgery, is the most important prognostic factor for event-free survival (EFS) of OS patients8–10, it does not represent a true early prognostic factor because histologic response cannot be evaluated for patient stratification at presentation before any therapy.
Dynamic contrast-enhanced MRI (DCE-MRI) is an imaging technique that can be used to measure properties of tissue microvasculature, such as tissue perfusion, capillary permeability, and interstitial volume11, 12. DCE-MRI images are acquired to monitor the whole process of signal changes before, during, and after intravenous injection of a low-molecular-weight chelated gadolinium contrast agent. Regions of necrosis, muscle, vessel, and viable tumor display distinct signal enhancement in dynamic images. DCE-MRI has been used for a range of clinical applications including cancer detection13, 14, diagnosis15, 16, staging13, 17, and assessment of treatment response18, 19.
DCE-MRI has been shown to be a potential biomarker for histologic response to preoperative chemotherapy in a small group of OS patients18. DCE-MRI in combination with tumor size could provide a possible prognostic factor for pediatric OS patients 20. However, these parameters were measured after preoperative chemotherapy instead of at presentation, and DCE-MRI parameters alone were not shown to be prognostic of clinical outcome 20. Several other imaging modalities, such as Diffusion-weighted MRI 21–25, 18FDG-PET 26–28 and 201TI scintigraphy 29, also play an important role in assessment of treatment response in solid tumor including osteosarcoma. However, no parameter has been reported as a prognostic factor of patient outcome in osteosarcoma. Recently, central tumor photopenia on 201TI scintigraphy of primary OS has been reported to be negatively associated with survival in older pediatric patients30. Since central tumor photopenia may be due to central necrosis30, it was hypothesized that the differences in averaged DCE-MRI parameters between outer and inner tumor would be possible indicators of response or prognostic factors for patient outcome.
In this study, DCE-MRI data from pediatric OS patients treated on a multi-institutional trial were analyzed to generate quantitative measures: the influx volume transfer constant (Ktrans), the efflux rate constant (kep), the relative extravascular extracellular space (ve), and the relative vascular plasma space (vp) from a two-compartment pharmacokinetic model11, and the corresponding differences (ΔKtrans, Δkep, Δve, and Δvp) between outer and inner tumor. We investigated the hypotheses that: 1) quantitative DCE-MRI measures will be indicative of preoperative treatment response to neoadjuvant therapy and 2) early measures before any therapy will be prognostic of EFS and overall survival.
MATERIALS AND METHODS
Patients and Treatment
A total of 77 patients with high-grade nonmetastatic and potentially resectable OS were enrolled on a phase II therapeutic trial at three centers in United States and Chile between May 1999 and May 2006 (NCT00145639 in Clinicaltrials.gov). All patients younger than 25 years old and previously untreated were enrolled. Five patients were deemed to be ineligible after enrollment due to presence of metastatic disease at diagnosis and were excluded. Of the remaining 72 eligible patients, one was determined to have malignant fibrous histiocytoma at resection and was excluded resulting in a total of 71 patients (median age = 13.5 years at diagnosis). Protocol treatment was comprised of 12 cycles of chemotherapy administered every 3 weeks over 35 weeks: three cycles of carboplatin and ifosfamide and one cycle of doxorubicin before surgical resection at Week 12, followed by two additional cycles of carboplatin and ifosfamide, three cycles of ifosfamide and doxorubicin, and three cycles of carboplatin and doxorubicin31.
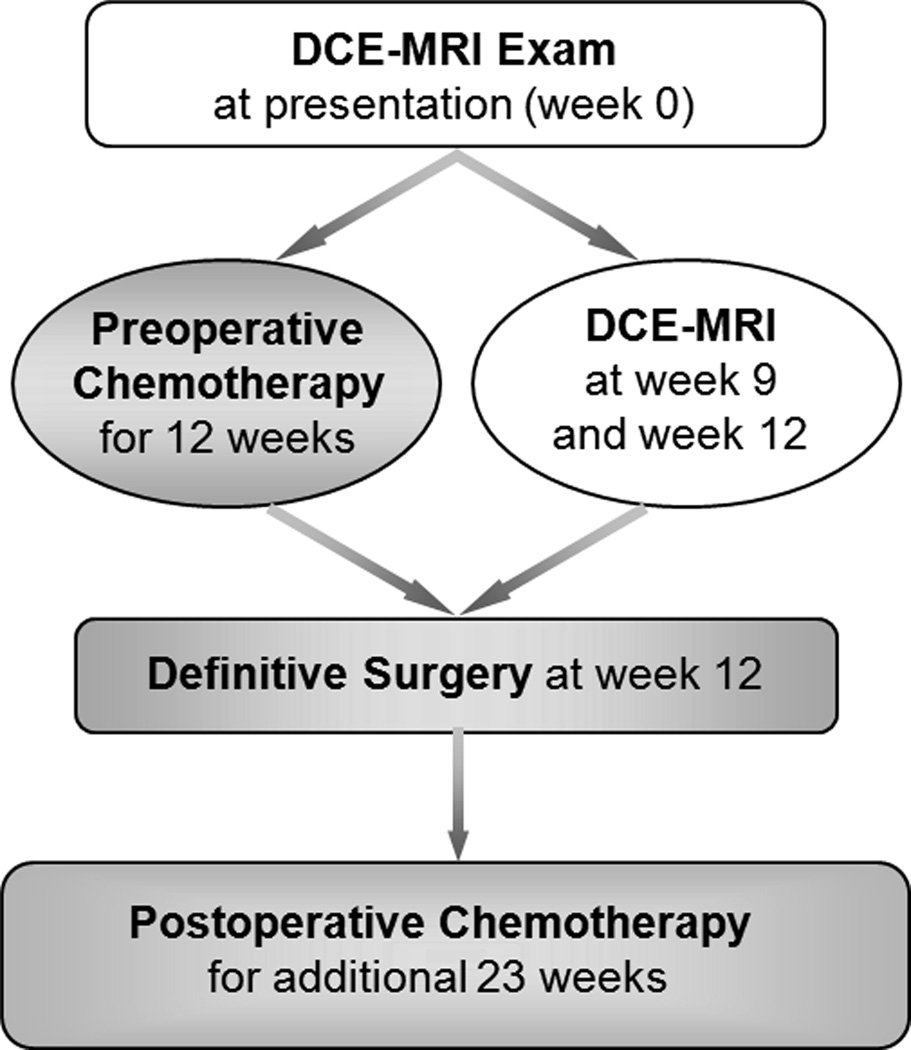
Patients were eligible for the DCE-MRI imaging study if they completed at least one of three serial DCE-MRI examinations before surgical resection. Two patients did not meet this criterion resulting in a total of 69 patients in the study (femur=45; tibia=17; humerus=3; fibula=2; ulna=1; and maxilla=1). Adequate renal function defined as serum creatinine < 2x of normal was an eligibility requirement for enrollment on the trial. No renal function requirements for the DCE-MRI were specified in the protocol; contrast was administered according to the policies and procedures of the individual participating institutions. The schedule diagram of treatment and imaging are shown in Figure 1. Treatment and imaging protocols were approved by the institutional review board of the participating institutions, and written informed consent was obtained from the patient, parent, or guardian, as appropriate.
Figure 1.
Schedule diagram of serial DCE-MRI examinations (white background) and tumor treatment (gray background).
Evaluation of Response
Histologic response was assessed at week 12 after definitive surgery using the four-grade system of Huvos3, 5. Responders are defined by the percentage of chemotherapy-induced necrosis no less than 90% (Grade III 90–99% and Grade IV 100%) and nonresponders less than 90% (Grade I 0–49% and Grade II 50–89%) 32. In addition, patients with early progressive disease prior to surgery were considered to be nonresponders for statistical analysis.
DCE-MRI Imaging
Three serial DCE-MRI examinations at week 0 before any treatment (N=62), week 9 (N=60), and week 12 (N=51) as shown in Figure 1 were performed to measure properties of the tumor microvasculature before definitive surgery. DCE-MRI images were acquired on a 1.5-T Siemens Symphony scanner (Siemens Medical Solutions, Erlangen, Germany) with the standard quadrature body coil as transmitter and receiver. After selection of the single slice that best showed the tumor, images were acquired before, during, and after bolus injection into a central venous access of a 0.1 mmol/kg dose of Gd-DTPA, followed by a saline flush. Thirty sequential FLASH images (TR/TE=23/10 ms, 40° flip angle, Nx/Ny = 256/256, 10-mm thickness, 40–50 cm FOV, 2 acquisitions) were collected over a 6-minute period, providing a temporal resolution of approximately 12 seconds per image.
DCE-MRI Analysis
After DCE-MRI images were transferred to an offline workstation, a pediatric radiologist (FAH) used an interactive display to select the region of interest (ROI) that encompassed the tumor area identified on routine clinical imaging studies and ensured tumor boundary selection was consistent across all time points.
DCE-MRI data were analyzed using a two-compartment pharmacokinetic model11, which required an arterial input function (AIF) and the baseline spin-lattice relaxation time (T10) mapping. A measured AIF was not available for these patients, and so an assumed AIF, bi-exponential decay curve33, was used. Since T10 mapping was not acquired for all osteosarcoma patients, DCE-MRI kinetic parameters were calculated for all the patients using an average T10 of 1100 ms. We computed this average from tumor regions in measured T10 maps of twenty osteosarcoma patients which were obtained using an inversion recovery method with six different inversion times (TI): 100, 300, 900, 1500, 2200 and 3300 ms and a three parameter fitting algorithm 34. It has been demonstrated previously that pharmacokinetic modeling using a population based averaged constant T10 may generate comparable results as those using a measured T10 map when the DCE-MRI parameters are averaged for the tumor 35–37.
For each pixel inside the tumor ROI, the four quantitative measures, Ktrans, kep, ve, and vp, were computed using the two-compartment pharmacokinetic model, and the average values for the whole ROI were calculated from parametric maps. The reproducibility of DCE-MRI measures has been previously demonstrated in adults who underwent MR scans daily for 3 consecutive days38. The 95% confidence interval for change as a % of group mean pretreatment value was (−10.8%, 12.1%) for Ktrans, (−9.5%,10.5%) for kep, and ±5.1% for ve, respectively. The corresponding differences (ΔKtrans = Ktrans(outer) – Ktrans(inner), Δkep, Δve, or Δvp) of each averaged kinetic parameter between outer and inner half of tumor ROI were also computed for further statistical analysis. All eight DCE-MRI parameters were used for assessing treatment response, EFS, and overall survival.
Statistical Analysis
The average values of each of eight DCE-MRI parameters (Ktrans, kep, ve, vp, ΔKtrans, Δkep, Δve, and Δvp) in the ROI were determined for each patient at each time point of examination (week 0, week 9, and week 12). EFS was defined as the time interval from the date of study enrollment to the date of the first event (relapsed or progressive disease, second malignancy, or death from any cause) or to the date of last follow-up for patients without events. Overall survival was defined as the time from the date of study enrollment to the date of death from any cause or to the last follow-up date.
Exact Wilcoxon signed rank tests39 were used to examine the association of each of the DCE-MRI parameters between two time points. Logistic regression40 was used to examine the association of each of the eight DCE-MRI parameters at each time point between responders and nonresponders. Cox proportional hazards models41, 42 were used to explore associations between outcome (EFS and overall survival) and each of the eight DCE-MRI parameters. All the statistical analyses were performed using SAS software (version 9.1).
Patients were categorized into two groups using the median DCE-MRI parameter value as a cut-point. EFS distributions were estimated using the method of Kaplan and Meier43, and differences in EFS distributions were examined using the exact log-rank test44. Reported P-values were considered statistically significant when P≤0.05 and as marginally significant or trending towards significance when 0.05<P≤0.10. No adjustments were made for multiple comparisons.
RESULTS
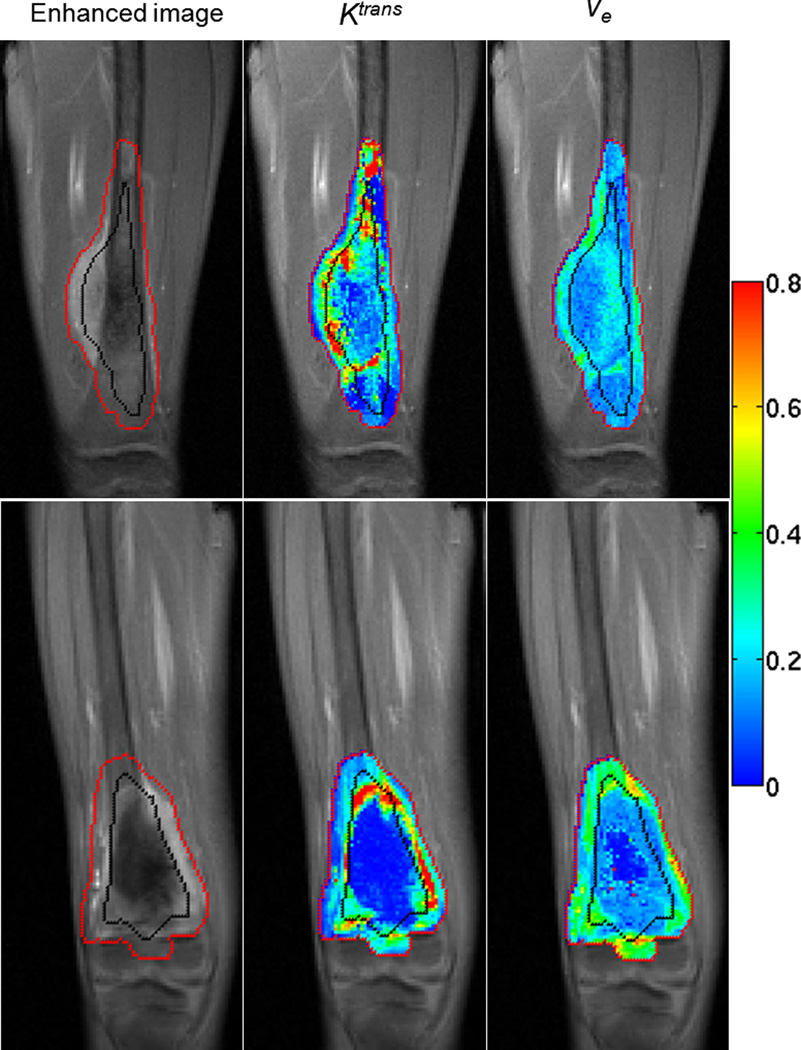
Tumor ROIs drawn by the radiologist were divided by computer software into inner and outer halves, as shown by the black line in Figure 2. Parametric maps (Ktrans and ve) of two pediatric patients with OS of the distal femur at the baseline examination (week 0) are displayed as examples. The first patient in the upper row is a responder who was event-free, and the second patient in the lower row is a nonresponder who died after disease relapse. For the first and second patient, the average Ktrans values for the whole ROI were 0.251 min−1 and 0.215 min−1, respectively; the average ve values were 0.178 and 0.231. The Ktrans differences (ΔKtrans) between outer and inner half were −0.005 min−1 and 0.124 min−1; the ve differences (Δve) were 0.018 and 0.138, respectively, for the two patients. According to Ktrans and ve maps shown in Figure 2, the first patient had a more highly perfused central tumor region than the second patient, which means presumably enhanced drug delivery for the central tumor for the first patient. On the contrary, the second patient had a large semi-necrotic and necrotic region in the central tumor, and drug delivery to the central tumor would be more challenging.
Figure 2.
The contrast-enhanced image, Ktrans map, and ve map in baseline examination are displayed from left to right. The red line is the boundary of tumor ROI drawn by a radiologist, and the black line was automatically generated to divide each tumor ROI into inner and outer halves. Images in the upper row are for a patient who was a responder and was alive without event at the time of analysis; images in the lower row are for a nonresponder who died after disease relapse. All the grayscale images are in the same gray scale. All the color maps are in the same color scale, and the color bar is displayed on the right.
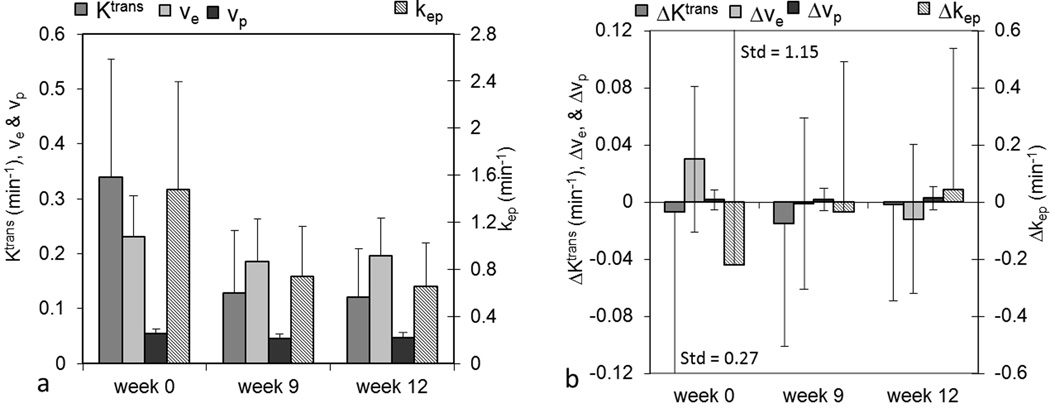
All eight DCE-MRI parameters were evaluated for all patients at each time point, and average values within the ROI were assessed and are shown in Figure 3. Bar plots of average values of Ktrans, ve, vp, and kep are shown in Figure 3a, and bar plots of average values of ΔKtrans, Δkep, Δve, and Δvp are shown in Figure 3b. Standard deviations are not shown in this and subsequent figures for the purpose of display. In Figure 3, Ktrans, kep, ve, vp, and Δkep between week 0 and week 9 and between week 0 and week 12 were significantly different (all P values were less than 0.0001, except for P=0.015 (ve), and P=0.0004 (vp) for week 0 vs. week 12). In Figure 3a, the significant decreases of Ktrans, ve, vp, and kep from week 0 to week 9 and week 12 can be observed. Changes in ΔKtrans, Δve, and Δvp were not significantly different for week 0 vs. week 9 or for week 0 vs. week 12. In addition, no significant differences of all parameters were observed between week 9 and week 12 (P≥0.19).
Figure 3.
Bar plots of average values of DCE-MRI parameters of interest for all patients. (a) Ktrans, ve, and vp are measured on the left axis and kep on the right axis; (b) ΔKtrans (outer-inner), Δve, and Δvp on the left axis and Δkep on the right axis. Std represents standard deviation.
Tumor Histologic Response
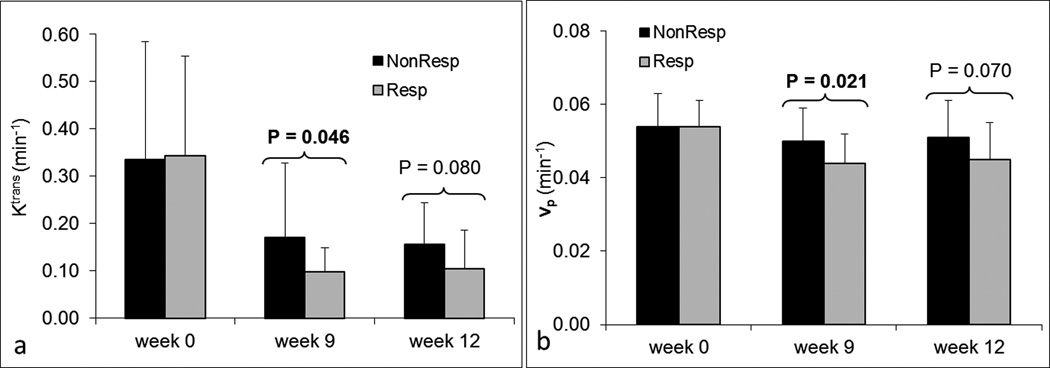
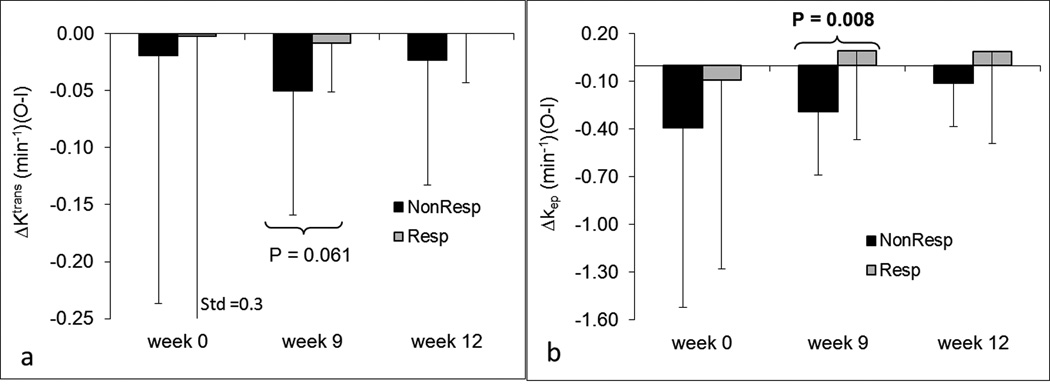
Patients were categorized into two groups, responders and nonresponders, according to histologic tumor response. The association of each of the eight parameters between two groups was examined using the logistic regression method40. Figure 4 shows bar plots of Ktrans and vp for responders and nonresponders at each time point. Ktrans and vp at week 9 were significantly different between the two groups with P=0.046 and P=0.021, respectively. Ktrans and vp at week 12 with P=0.08 and P=0.07 were marginally significant. No differences in Ktrans and vp at week 0 were observed between the two groups (P>0.89). No statistically significant differences in kep and ve between responders and nonresponders were found at any time point. Figure 5 shows bar plots of ΔKtrans and Δkep for responders and nonresponders at three time points. Δkep at week 9 was significantly different between the two groups (P=0.008). ΔKtrans at week 9 was marginally significant (P=0.061). No other significant differences were observed for ΔKtrans and Δkep. In addition, no significant differences of Δve and Δvp between responders and nonresponders were observed at any time point. Ktrans, vp, and Δkep at week 9 provided early indicators of histologic response.
Figure 4.
Bar plots of DCE-MRI parameters Ktrans (a) and vp (b) for responders and nonresponders at three time points. P-values less than 0.1 are displayed at the corresponding time points. Dark bars represent nonresponders; lighter gray bars represent responders.
Figure 5.
Bar plots of DCE-MRI parameters ΔKtrans (a) and Δkep (b) for responders and nonresponders at three time points. P-values less than 0.1 are displayed at the corresponding time points. Dark bars represent nonresponders; lighter gray bars represent responders. Std represents standard deviation.
Event-free and Overall Survival
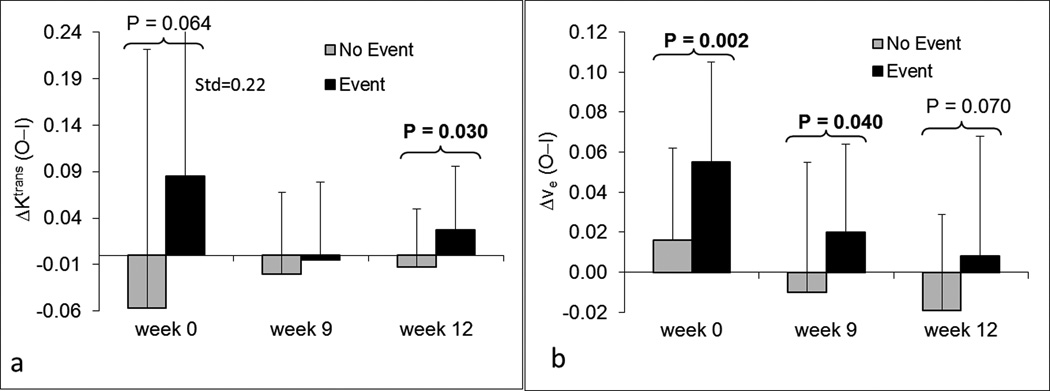
Associations between EFS and each of the eight parameters were examined using Cox proportional hazards models41, 42. ΔKtrans and Δve were two parameters with possible prognostic significance in univariate analyses (Figures 6a and 6b). ΔKtrans at week 12 was a significant predictor of EFS (P=0.030), and ΔKtrans at week 0 trended towards significance (P=0.064). Δve at weeks 0 and 9 were significant predictors of EFS (P=0.002 and P=0.040, respectively), while Δve at week 12 was marginally significant (P=0.070). None of the other six parameters were significant predictors of EFS.
Figure 6.
Bar plots of DCE-MRI parameters ΔKtrans (a) and Δve (b) at three time points for patients with and without events. P-values less than 0.1 are displayed at the corresponding time points. Lighter gray bars represent patients without events; Dark bars represent patients with events. Std represents standard deviation.
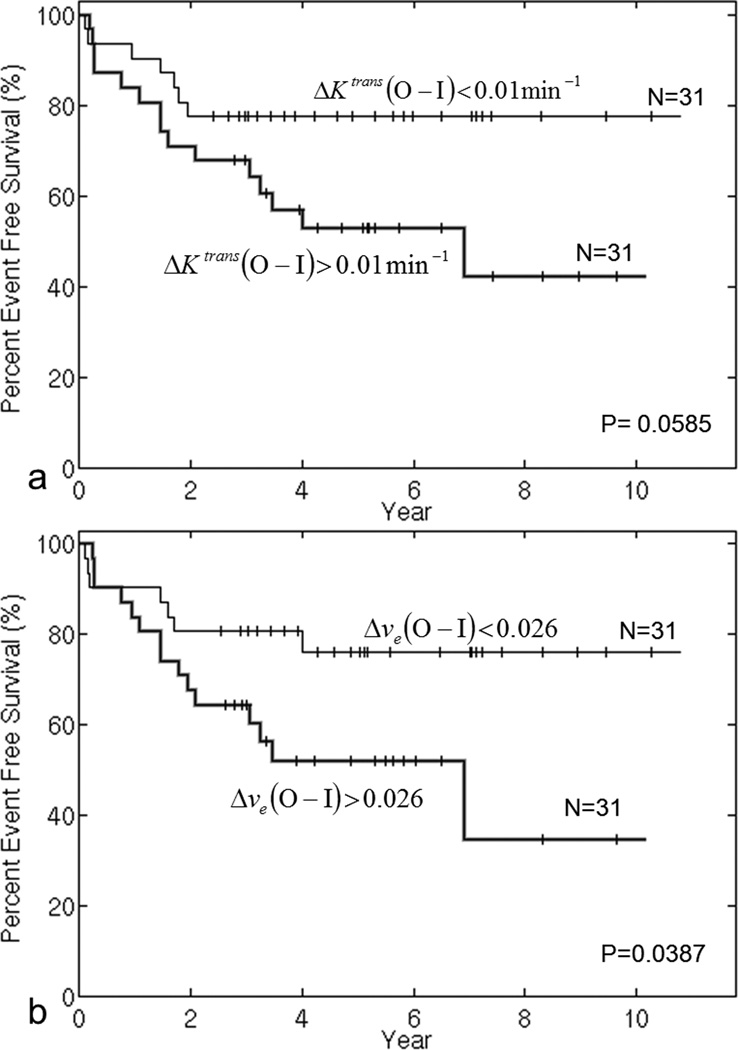
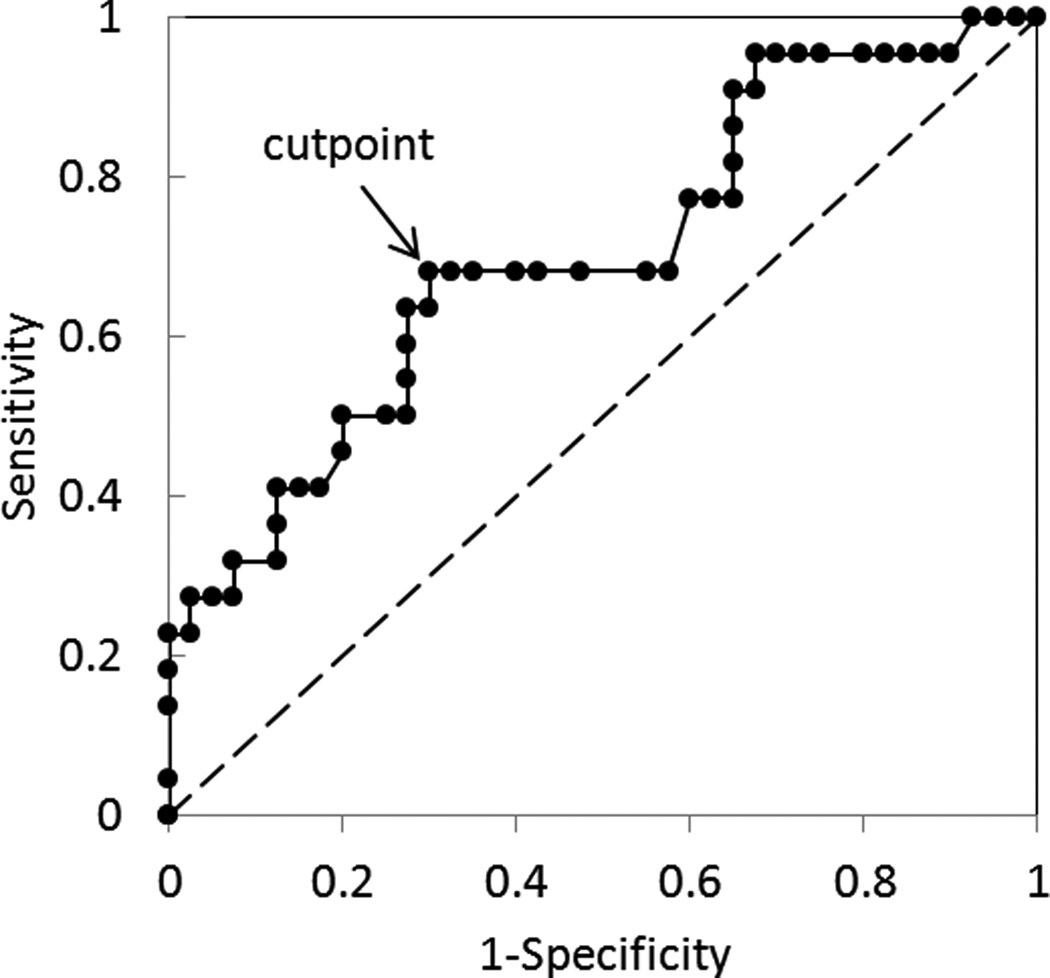
To explore the prognostic effect of ΔKtrans and Δve, we plotted EFS curves in Figure 7 for patients with parameter values above and below the median. Seven patients who did not have DCE-MRI parameter values at week 0 were excluded from this analysis. Figure 7a shows EFS curves for the two groups stratified by the median of ΔKtrans. EFS was better for patients with lower values of ΔKtrans at week 0, and this difference was marginally significant (P=0.059). Figure 7b shows EFS curves for the two groups stratified by the median of Δve; patients with smaller Δve at week 0 had significantly better EFS (P=0.039). ΔKtrans and Δve at week 0 could be potential prognostic factors for EFS before any treatment. To further test the performance of Δve at baseline as a predictor of EFS, a receiver operating characteristics (ROC) curve was evaluated and shown in Figure 8. The area under the curve (AUC) was 0.701, and the optimal cutpoint for best sensitivity and specificity is Δve equal to 0.032, which corresponds to sensitivity 0.68 and specificity 0.70.
Figure 7.
Event-free survival curves for subgroups stratified by the median value of ΔKtrans (a) and Δve (b) at week 0. P-values were obtained from exact log-rank tests.
Figure 8.
ROC curve of Δve at baseline examination in discriminating between EFS and non-EFS patients. Area under curve is equal to 0.70 with a sensitivity (True Positive Rate) of 0.68 and a specificity (1- False Postive Rate) of 0.7 at the optimal cutpoint of Δve=0.032. Similarly, the median value of Δve=0.026 in Figure 7b corresponds to a sensitivity of 0.68 and a specificity of 0.65.
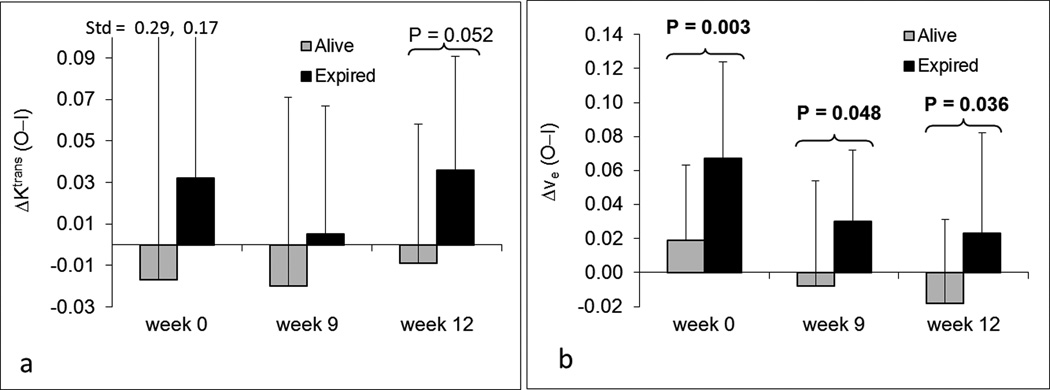
Associations between overall survival and each of the DCE-MRI parameters were also explored. We found that ΔKtrans and Δve were two parameters with possible prognostic significance (Figures 9a and 9b). ΔKtrans at week 12 was marginally prognostic of survival (P=0.052), although no differences at weeks 0 and 9 were observed (P>0.37). Δve at weeks 0, 9, and 12 were significant predictors of survival (P=0.003, P=0.048, and P=0.036, respectively). Patients who were alive at the time of analysis had smaller average Δve values (Figure 9b). None of the other six parameters were significant predictors of overall survival.
Figure 9.
Bar plots of DCE-MRI parameters ΔKtrans (a) and Δve (b) at three time points for patient survival status. P-values less than 0.1 are displayed at the corresponding time points. Lighter gray bars represent patients alive at the time of analysis; Dark bars represent dead patients. Std represents standard deviation.
DISCUSSION
This study examined the relationship between DCE-MRI parameters and treatment outcomes (histologic response, EFS and overall survival), and showed that Ktrans, vp, and Δkep at week 9 were significantly correlated with histologic response. However, the vp values in this study were very small, using the two-compartment model, and could have been possibly affected by the larger noise. No other parameters showed statistically significant associations with histologic response. Δve at week 0 was significantly associated with both EFS and overall survival and was the only statistically significant prognostic factor for these clinical outcomes prior to any treatment. ΔKtrans at week 0 trended towards significance for association with EFS. ΔKtrans and Δve at later time points were also prognostic factors for EFS. All DCE-MRI parameters with significance in the univariate test were summarized in Table 1.
Table 1.
Summary of statistically significant associations between DCE-MRI parameters and response or outcomes.
| P value/time | Histologic Response |
EFS | Overall Survival |
|---|---|---|---|
| Ktrans | 0.046/wk9 | — | — |
| vp | 0.021/wk9 | — | — |
| ΔKtrans | — | 0.030/wk12 | — |
| Δkep | 0.008/wk9 | — | — |
| Δve | — |
0.002/wk0 0.040/wk9 |
0.003/wk0 0.048/wk9 0.036/wk12 |
EFS, event-free survival; wk, week.
An observation from Table 1 was that the DCE-MRI parameters significantly correlated with histologic response and EFS (or overall survival) were different, and there was no overlap between the two groups. For example, Ktrans at week 9 was significantly correlated with histologic response, but it was not a significant predictor of EFS or overall survival. The group of patients with events in the analysis of EFS did not necessarily equate to the group of patients who were nonresponders. In analyses investigating whether tumor response was prognostic of EFS and survival, we found that histologic response was not a statistically significant predictor of survival (P=0.19) or EFS (P=0.09) at the traditional P≤0.05 level. In this analysis, response was treated as a time-dependent covariate; all patients began in the nonresponse state and patients moved to the response state at the time of their response. Associations between DCE-MRI parameters and histologic response, therefore, may not be equated with associations between the same DCE-MRI parameters and EFS (or overall survival). Each indicator of response or prognostic factor of survival must be validated independently45.
A true prognostic factor for EFS at the time of presentation is most desirable to stratify OS patients for designing individual treatment strategies. ΔKtrans and Δve (differences in parameters between outer and inner tumor) at presentation had the potential to be useful prognostic factors for EFS as shown in Figure 7. Both ΔKtrans and Δve in patients with events were larger than those of patients without events as shown in Figure 6, which indicates that patients with events had a larger drop of perfusion from the outer half of the tumor to the inner half of the tumor than patients without events. Possible reasons for lower perfusion in the tumor central region are central tumor necrosis or high perfusion pressure in the central tumor. Either reason would decrease the drug delivery to the central tumor region and diminish effects of chemotherapy, which could lead to less effective treatment and subsequent tumor relapse. Patients with events usually had much lower perfusion in the central region than at the edge of tumor in comparison with patients without events as shown in Figures 2 and 6, which could be a major reason for the different clinical outcome.
DCE-MRI parameters can be used potentially to incorporate early changes in therapy and in some cases where surgery cannot be performed to assess histologic response. However, the list of active agents in osteosarcoma is short, and the question whether altering therapy for poor responders improves patient outcome is not yet resolved. Currently, the presence or absence of metastasis at diagnosis is the prognostic factor most widely used to design treatment protocols for osteosarcoma, and there is a pressing need to identify prognostic factors especially for the majority of patients (those with localized disease). If confirmed in a larger trial, the prognostic significance of the DCE-MRI parameters will be useful to stratify patients in future clinical trials, and to identify the group of patients in whom testing of novel therapies is warranted and avoid exposing patients with favorable prognosis to potentially toxic or ineffective therapies.
An advantage of ΔKtrans and Δve as prognostic factors for EFS is that these two parameters are stable because they are calculated from a single measurement, avoiding effects from slice position change and motion between measurements. Another advantage is that these parameters can be acquired prior to any treatment and serve as true early prognostic factors for EFS. However, there are some limitations to this study. While acquisition of accurate T10 is preferable for kinetic modeling, these T10 maps were not available for all osteosarcoma patients in this study and a measured average T10 from a limited sample of patients was used in data processing. This approach has been shown by others to yield average kinetic parameters that are not significantly different from those using a measured T10 map in whole tumor analyses36, but the impact of using an average T10 on differences of kinetic parameters between outer and inner half of tumor has not been assessed. While results using a measured T10 map may differ from those reported in this study, DCE-MRI examinations processed under the same assumptions should yield comparable results. Another limitation of the study was that all DCE-MRI parameters were acquired from a single 2D slice through the tumor for each patient. While slice positioning was carefully selected based on the previous examinations, differences in slice orientation and position could cause increased variation of results between examinations but should not impact observed relationships between single examinations and response or survival. A new 3D DCE-MRI imaging protocol with 3D T10 mapping been designed and implemented into an ongoing new clinical trial (NCT00667342 in clinicaltrials.gov) to prospectively validate these prognostic factors.
In conclusion, we found that DCE-MRI parameters Ktrans, vp, and Δkep at week 9 could serve as indicators of histologic response. DCE-MRI parameter Δve at week 0 and possibly ΔKtrans at week 0 may be true early prognostic factors for EFS and overall survival, which eventually could contribute to the development of risk-adapted therapy. Further studies with larger numbers of patients are needed to verify our findings and to establish the role of DCE-MRI in stratifying patients for individualized treatment and monitoring the response to chemotherapy.
ACKNOWLEDGMENTS
We acknowledge the valuable contributions of Rhonda Simmons, Gaston K. Rivera, MD, and Dana Hawkins, RN, BSN, CCRC. We thank David Galloway for editorial assistance.
This work was supported in part by Cancer Center Support grant P30 CA21765 and Solid Tumor Program Project grant P01 CA23099 from the National Cancer Institute, Bethesda, MD, and by the American Lebanese Syrian Associated Charities (ALSAC), Memphis, TN.
Footnotes
No financial disclosures from any authors
REFERENCES
- 1.Malawer MM, Link MP, Donaldson SS, DeVita DT, Jr, Rosenberg SA, Hellman S. Cancer: principles and practice of oncology. Philadelphia, PA: Lippincott Williams and Wilkins; 2001. Sarcomas of bone; pp. 1891–1935. [Google Scholar]
- 2.Bacci G, Ferrari S, Longhi A, et al. Pattern of relapse in patients with osteosarcoma of the extremities treated with neoadjuvant chemotherapy. Eur.J.Cancer. 2001;37(1):32–38. doi: 10.1016/s0959-8049(00)00361-0. [DOI] [PubMed] [Google Scholar]
- 3.Huvos AG, Rosen G, Marcove RC. Primary osteogenic sarcoma: pathologic aspects in 20 patients after treatment with chemotherapy, en bloc resection, and prosthetic bone replacement. Arch.Pathol.Lab.Med. 1977;101:14–18. [PubMed] [Google Scholar]
- 4.Raymond AK, Chawla SP, Carrasco CH, et al. Osteosarcoma chemotherapy effect: a prognostic factor. Semin.Diagn.Pathol. 1987;4:212–236. [PubMed] [Google Scholar]
- 5.Rosen G, Caparros B, Huvos AG, et al. Preoperative chemotherapy for osteogenic sarcoma: selection of postoperative adjuvant chemotherapy based on the response of the primary tumor to preoperative chemotherapy. Cancer. 1982;49:1221–1230. doi: 10.1002/1097-0142(19820315)49:6<1221::aid-cncr2820490625>3.0.co;2-e. [DOI] [PubMed] [Google Scholar]
- 6.Meyers PA, Schwartz CL, Krailo M, et al. Osteosarcoma: a randomized, prospective trial of the addition of ifosfamide and/or muramyl tripeptide to cisplatin, doxorubicin, and high-dose methotrexate. J Clin Oncol. 2005;23(9):2004–2011. doi: 10.1200/JCO.2005.06.031. [DOI] [PubMed] [Google Scholar]
- 7.Goorin AM, Schwartzentruber DJ, Devidas M, et al. Presurgical chemotherapy compared with immediate surgery and adjuvant chemotherapy for nonmetastatic osteosarcoma: Pediatric Oncology Group Study POG-8651. J Clin Oncol. 2003;21(8):1574–1580. doi: 10.1200/JCO.2003.08.165. [DOI] [PubMed] [Google Scholar]
- 8.Davis AM, Bell RS, Goodwin PJ. Prognostic factors in osteosarcoma: a critical review. J Clin Oncol. 1994;12(2):423–431. doi: 10.1200/JCO.1994.12.2.423. [DOI] [PubMed] [Google Scholar]
- 9.Meyers PA, Gorlick R, Heller G, et al. Intensification of preoperative chemotherapy for osteogenic sarcoma: results of the Memorial Sloan-Kettering (T12) protocol. Journal of Clinical Oncology. 1998;16(7):2452–2458. doi: 10.1200/JCO.1998.16.7.2452. [DOI] [PubMed] [Google Scholar]
- 10.Bielack SS, Kempf-Bielack B, Delling G, et al. Prognostic factors in high-grade osteosarcoma of the extremities or trunk: an analysis of 1,702 patients treated on neoadjuvant cooperative osteosarcoma study group protocols. J Clin Oncol. 2002;20(3):776–790. doi: 10.1200/JCO.2002.20.3.776. [DOI] [PubMed] [Google Scholar]
- 11.Tofts PS, Brix G, Buckley DL, et al. Estimating kinetic parameters from dynamic contrast-enhanced T1-weighted MRI of a diffusible tracer: standardized quantities and symbols. Journal of Magnetic Resonance Imaging. 1999;10(3):223–232. doi: 10.1002/(sici)1522-2586(199909)10:3<223::aid-jmri2>3.0.co;2-s. [DOI] [PubMed] [Google Scholar]
- 12.Verstraete KL, Lang P. Bone and soft tissue tumors: the role of contrast agents for MR imaging. European Radiology. 2000;34:229–246. doi: 10.1016/s0720-048x(00)00202-3. [DOI] [PubMed] [Google Scholar]
- 13.Hara N, Okuizumi M, Koike H, Kawaguchi M, Bilim V. Dynamic contrast-enhanced magnetic resonance imaging (DCE-MRI) is a useful modality for the precise detection and staging of early prostate cancer. Prostate. 2005;62(2):140–147. doi: 10.1002/pros.20124. [DOI] [PubMed] [Google Scholar]
- 14.Kim JK, Hong SS, Choi YJ, et al. Wash-in rate on the basis of dynamic contrast-enhanced MRI: usefulness for prostate cancer detection and localization. J Magn Reson Imaging. 2005;22(5):639–646. doi: 10.1002/jmri.20431. [DOI] [PubMed] [Google Scholar]
- 15.Yoshizako T, Wada A, Hayashi T, et al. Usefulness of diffusion-weighted imaging and dynamic contrast-enhanced magnetic resonance imaging in the diagnosis of prostate transition-zone cancer. Acta Radiol. 2008;49(10):1207–1213. doi: 10.1080/02841850802508959. [DOI] [PubMed] [Google Scholar]
- 16.Turnbull LW. Dynamic contrast-enhanced MRI in the diagnosis and management of breast cancer. NMR Biomed. 2009;22(1):28–39. doi: 10.1002/nbm.1273. [DOI] [PubMed] [Google Scholar]
- 17.Sala E, Crawford R, Senior E, et al. Added value of dynamic contrast-enhanced magnetic resonance imaging in predicting advanced stage disease in patients with endometrial carcinoma. Int J Gynecol Cancer. 2009;19(1):141–146. doi: 10.1111/IGC.0b013e3181995fd9. [DOI] [PubMed] [Google Scholar]
- 18.Reddick WE, Taylor JS, Fletcher BD. Dynamic MR imaging (DEMRI) of microcirculation in bone sarcoma. Journal of Magnetic Resonance Imaging. 1999;10(3):277–285. doi: 10.1002/(sici)1522-2586(199909)10:3<277::aid-jmri8>3.0.co;2-s. [DOI] [PubMed] [Google Scholar]
- 19.Chen JH, Feig B, Agrawal G, et al. MRI evaluation of pathologically complete response and residual tumors in breast cancer after neoadjuvant chemotherapy. Cancer. 2008;112(1):17–26. doi: 10.1002/cncr.23130. [DOI] [PubMed] [Google Scholar]
- 20.Reddick WE, Wang SC, Xiong X, et al. Dynamic magnetic resonance imaging of regional contrast access as an additional prognostic factor in pediatric osteosarcoma. Cancer. 2001;91(12):2230–2237. [PubMed] [Google Scholar]
- 21.Sugahara T, Korogi Y, Kochi M, et al. Usefulness of diffusion-weighted MRI with echo-planar technique in the evaluation of cellularity in gliomas. J Magn Reson Imaging. 1999;9(1):53–60. doi: 10.1002/(sici)1522-2586(199901)9:1<53::aid-jmri7>3.0.co;2-2. [DOI] [PubMed] [Google Scholar]
- 22.Chenevert TL, Stegman LD, Taylor JM, et al. Diffusion magnetic resonance imaging: an early surrogate marker of therapeutic efficacy in brain tumors. J Natl Cancer Inst. 2000;92(24):2029–2036. doi: 10.1093/jnci/92.24.2029. [DOI] [PubMed] [Google Scholar]
- 23.Kono K, Inoue Y, Nakayama K, et al. The role of diffusion-weighted imaging in patients with brain tumors. AJNR Am J Neuroradiol. 2001;22(6):1081–1088. [PMC free article] [PubMed] [Google Scholar]
- 24.Guo AC, Cummings TJ, Dash RC, Provenzale JM. Lymphomas and high-grade astrocytomas: comparison of water diffusibility and histologic characteristics. Radiology. 2002;224(1):177–183. doi: 10.1148/radiol.2241010637. [DOI] [PubMed] [Google Scholar]
- 25.Uhl M, Saueressig U, Koehler G, et al. Evaluation of tumour necrosis during chemotherapy with diffusion-weighted MR imaging: preliminary results in osteosarcomas. Pediatr Radiol. 2006;36(12):1306–1311. doi: 10.1007/s00247-006-0324-x. [DOI] [PubMed] [Google Scholar]
- 26.Ye Z, Zhu J, Tian M, et al. Response of osteogenic sarcoma to neoadjuvant therapy: evaluated by 18F-FDG-PET. Ann Nucl Med. 2008;22(6):475–480. doi: 10.1007/s12149-008-0147-y. [DOI] [PubMed] [Google Scholar]
- 27.Cheon GJ, Kim MS, Lee JA, et al. Prediction model of chemotherapy response in osteosarcoma by 18F-FDG PET and MRI. J Nucl Med. 2009;50(9):1435–1440. doi: 10.2967/jnumed.109.063602. [DOI] [PubMed] [Google Scholar]
- 28.Hawkins DS, Conrad EU, 3rd, Butrynski JE, Schuetze SM, Eary JF. [F-18]-fluorodeoxy-D-glucose-positron emission tomography response is associated with outcome for extremity osteosarcoma in children and young adults. Cancer. 2009;115(15):3519–3525. doi: 10.1002/cncr.24421. [DOI] [PMC free article] [PubMed] [Google Scholar]
- 29.Magnan H, Chou AJ, Chou JF, Yeung HW, Healey JH, Meyers PA. Noninvasive imaging with thallium-201 scintigraphy may not correlate with survival in patients with osteosarcoma. Cancer. 2010;116(17):4147–4151. doi: 10.1002/cncr.25375. [DOI] [PubMed] [Google Scholar]
- 30.McCarville MB, Barton EH, Cameron JR, et al. The cause and clinical significance of central tumor photopenia on thallium scintigraphy of pediatric osteosarcoma of the extremity. AJR Am J Roentgenol. 2007;188(2):572–578. doi: 10.2214/AJR.06.0292. [DOI] [PubMed] [Google Scholar]
- 31.Daw NC, Neel MD, Rao BN, et al. Frontline treatment of localized osteosarcoma without methotrexate: results of the St. Jude Children's Research Hospital OS99 Trial. Cancer. 2011;117(12):2770–2778. doi: 10.1002/cncr.25715. [DOI] [PMC free article] [PubMed] [Google Scholar]
- 32.Wunder JS, Paulian G, Huvos AG, Heller G, Meyers PA, Healey JH. The histological response to chemotherapy as a predictor of the oncological outcome of operative treatment of Ewing sarcoma. J.Bone Joint Surg.Am. 1998;80(7):1020–1033. doi: 10.2106/00004623-199807000-00011. [DOI] [PubMed] [Google Scholar]
- 33.Weinmann H-J, Laniado M, Mutzel W. Pharmacokinetics of GdDTPA / dimeglumine after intravenous injection into healthy volunteers. Physiological Chemistry and Physics and Medical NMR. 1984;16(3):167–172. [PubMed] [Google Scholar]
- 34.Kingsley PB, Ogg RJ, Reddick WE, Steen RG. Correction of errors caused by imperfect inversion pulses in MR imaging measurement of T1 relaxation times. Magn Reson Imaging. 1998;16(9):1049–1055. doi: 10.1016/s0730-725x(98)00112-x. [DOI] [PubMed] [Google Scholar]
- 35.Guo JY, Reddick WE, Rosen MA, Song HK. Dynamic contrast-enhanced magnetic resonance imaging parameters independent of baseline T10 values. Magn Reson Imaging. 2009;27(9):1208–1215. doi: 10.1016/j.mri.2009.05.015. [DOI] [PMC free article] [PubMed] [Google Scholar]
- 36.Haacke EM, Filleti CL, Gattu R, et al. New algorithm for quantifying vascular changes in dynamic contrast-enhanced MRI independent of absolute T1 values. Magn Reson Med. 2007;58(3):463–472. doi: 10.1002/mrm.21358. [DOI] [PubMed] [Google Scholar]
- 37.Huang W, Wang Y, Panicek DM, Schwartz LH, Koutcher JA. Feasibility of using limited-population-based average R10 for pharmacokinetic modeling of osteosarcoma dynamic contrast-enhanced magnetic resonance imaging data. Magn Reson Imaging. 2009;27(6):852–858. doi: 10.1016/j.mri.2009.01.020. [DOI] [PMC free article] [PubMed] [Google Scholar]
- 38.Lankester KJ, Taylor JN, Stirling JJ, et al. Dynamic MRI for imaging tumor microvasculature: comparison of susceptibility and relaxivity techniques in pelvic tumors. J Magn Reson Imaging. 2007;25(4):796–805. doi: 10.1002/jmri.20881. [DOI] [PubMed] [Google Scholar]
- 39.Wilcoxon F. Individual comparisons by ranking methods. Biometrics. 1945;1(6):80–83. [Google Scholar]
- 40.Hosmer DW, Lemeshow S. Applied Logistic Regression. 2nd ed. New York: Chichester, Wiley; 2000. [Google Scholar]
- 41.Cox DR. Regression models and life-tables. Journal of Royal Statistical Society, Series B. 1972;34:187–220. [Google Scholar]
- 42.Cox DR. Partial likelihood. Biometrika. 1975;62:269–276. [Google Scholar]
- 43.Kaplan EL, Meier P. Nonparametric estimation from incomplete observations. J. Amer. Statist. Assn. 1958;53:457–481. [Google Scholar]
- 44.Bland JM, Altman DG. The logrank test. Bmj. 2004;328(7447):1073. doi: 10.1136/bmj.328.7447.1073. [DOI] [PMC free article] [PubMed] [Google Scholar]
- 45.Hawkins DS, Rajendran JG, Conrad EU, 3rd, Bruckner JD, Eary JF. Evaluation of chemotherapy response in pediatric bone sarcomas by [F-18]-fluorodeoxy-D-glucose positron emission tomography. Cancer. 2002;94(12):3277–3284. doi: 10.1002/cncr.10599. [DOI] [PubMed] [Google Scholar]


