

Abstract
Recent scientific discoveries fuelled by the application of next-generation DNA and RNA sequencing technologies highlight the striking impact of these platforms in characterizing multiple aspects in genomics research. This technology has been used in the study of the B-cell and T-cell receptor repertoire. The novelty of immunosequencing comes from the recent rapid development of techniques and the exponential reduction in cost of sequencing. Here, we describe some of the technologies, which we collectively refer to as Rep-Seq (repertoire sequencing), to portray achievements in the field and to present the essential and inseparable role of next-generation sequencing to the understanding of entities in immune response. The large Rep-Seq data sets that should be available in the near future call for new computational algorithms to segue the transition from ‘classic’ molecular-based analysis to system-wide analysis. The combination of new algorithms with high-throughput data will form the basis for possible new clinical implications in personalized medicine and deeper understanding of immune behaviour and immune response.
Keywords: B cell, immunological repertoire, next-generation sequencing, T cell
Introduction
Next-generation sequencing (NGS) has established itself as a highly useful platform in characterizing multiple aspects of genomics research. It has been used to re-sequence the genome of previously sequenced organisms (re-sequencing);1 sequence the genomes of organisms with unknown sequences (de novo sequencing, e.g. application2 and algorithm3); determine RNA abundance levels (RNA-seq);4 determine protein–DNA binding regions (ChIP-seq);5 determine protein–RNA binding sequences (CLIP-seq)6; and more.7–9 This technology has been used in the study of the immunoglobulin repertoire. Described here, through the collection of presented works, is how a systematic, accurate, unbiased analysis of the immunological repertoire is within reach.
The immunological repertoire is the collection of trans-membrane antigen-receptor proteins located on the surface of T and B cells. The combinatorial mechanism that is responsible for encoding the receptors, does so by reshuffling the genetic code, with a potential to generate more than 1018 different T-cell receptors (TCRs) in humans,10 and a much more diverse B-cell repertoire. These sequences, in turn, will be transcribed and then translated into protein, to be presented on the cell surface. The recombination process that rearranges the gene segments for the construction of the receptors is key to the development of the immune response, and the correct formation of the rearranged receptors is critical to their future binding affinity to antigen. The power of NGS can only be used on DNA and RNA molecules, which necessitates the proper collection of significant numbers of T/B cells and their isolation from test samples (the meaning of ‘significant’ will be further discussed). DNA or RNA are produced from sorted cells, and sequenced via different technologies (454, Illumina, Solid – see below).
Sequencing methods have been part of mainstream biology since the 1980s. The novelty of immunosequencing comes from the recent rapid development of techniques and the exponential reduction in cost of sequencing. The number of sequences that can be produced within a single run is currently around 400 billion bases and improves regularly. This leads, for example, to the possibility of sequencing all the T or B cells of small organisms, such as the zebrafish (which is discussed later). At the rate at which sequencing technologies progress, larger organisms such as the mouse will follow. In humans the rationale is different, and the hope is to obtain a sufficient amount of sequences to provide biomarkers for disease risk, diagnosis or prognosis. The following text details some of the technologies and some of the recent achievements in this field.
High throughput sequencing – technology
In this review we focus on two technologies: Illumina (Solexa; San Diego, CA)11 and Roche 454 (San Francisco, CA).11,12 The underlying technology for both machines is ‘sequencing by synthesis’, which involves the sequencing of the complementary strand of a given sequence with an enzymatic reaction. Each machine uses a different approach; we briefly detail them here.
Illumina uses reversible deoxy-nucleoside triphosphate (dNTP) terminators. DNA segments are attached to primers on a slide and amplified with four types of dideoxy-NTPs (ddNTPs). These ddNTPs are labelled with a fluorescent dye and blocked at the 3′-OH, ensuring that only one nucleotide is added at each step. After incorporation, the remaining nucleotides are washed away. A scan detects the last nucleotide added and the fluorescent blocking label is chemically removed, enabling the next sequencing cycle to start.11,13
The 454 sequencing uses a pyrosequencing method, which consists of two steps. First the DNA is cut and attached at both ends to oligonucleotide adaptors. These fragments are then individually attached to a bead, and each bead is amplified by PCR in droplets of an oil–water micelle, generating multiple copies of the same DNA sequence. These micelles also contain enzymes for the sequencing step. Each nucleotide type is added separately; one or more identical nucleotides may be added at the same time. When each nucleotide is incorporated, it releases a pyrophosphate which will eventually produce light through the luciferase enzyme. The light strength is proportional to the number of added nucleotides.12,13
Different machines provide different advantages and disadvantages. Compared with 454-based sequencing, Illumina sequencing presents a better yield. A single Illumina run (which would take roughly 4–5 days) may produce up to 400 giga-bases of sequence. The 454 yields less – ∼ 1 giga-base. On the other hand, 454 sequencing is distinguished by a longer and greater read-length range – ∼ 400 bp, whereas the Illumina platform provides read lengths no longer than 200 nucleotides. In a recent study, Warren et al.14 sequenced the TCR repertoire, and successfully obtained more than one billion raw reads from a single blood sample, which is the deepest immune receptor sequencing to date, with a yield of about 200 million TCR-β nucleotide sequences.
There are other sequencing machines available, each with its own advantages and disadvantages. We concentrate on the two machines mentioned above, as they are the only machines used so far in sequencing the immunological repertoire. Other machines include the SOLiD sequencer (Life Technologies, Grand Island, NY), Helicos (Cambridge, MA), PacBio (Menlo Park, CA), and IonTorrent (Life Technologies, Grand Island, NY).11,15,16
The task at hand, for unbiased Rep-Seq protocols, is to isolate the relevant sequences, from the source B and T cells. These sequences are then sequenced by an NGS machine. To determine relative abundance of different sequences within the repertoire, a proper account for each of the source sequences is made. Any biased amplification of some of the sequences will leave us with a skewed view of the repertoire. If, for example, one of the sequences in the process is favoured for amplification in one of the stages of the protocol, then we are left unable to discriminate such amplification from actual dominance of the clone in the repertoire. Causes for amplification are therefore an extremely sensitive issue in Rep-Seq and different groups provide different solutions (see below).
Upon isolation of the appropriate genetic material (RNA/DNA, B cells/T cells), Rep-Seq requires the ‘lifting’ of the relevant immunoglobulin coding region. This is mostly done through a PCR-based amplification step. This amplification involves DNA primers with complementarities to the target regions. The standard technique uses multiple sets of primers, which are usually compatible with germline V and J segments17–22 (Fig. 2a). It is impossible to design primers for all the numerous gene segments; for this reason primers are designed for families of genes or consensus sequences so that most gene segments are detected.23 A common primer should be designed to recognize the highest consensus region, whereas unique or family primers should recognize the least consensus region within a segment. In addition, specific tags can be added to the primers; for example, to identify from which sample a sequence was amplified.21 However, using a multiplex PCR amplification system, a strong bias is expected towards specific V and J segments, and so observed sequence relative abundances may not accurately reflect real amounts. To deal with these issues, 5′ rapid amplification of cDNA ends (5′-RACE) has been used (see refs 14,24,25; Fig. 1b). The group of Daniel Douek at the National Institutes of Health (Bethesda, MD) have recently established their own 5′ RACE protocol.26 The advantage of this technique is that only one primer has to be designed to a known region within the mRNA sequence to amplify it. Other primers, such as the second ‘general primer’, complementary to a homopolymeric tail, and synthetically added to the mRNA at the 3′ end, or the sequencing primers themselves, are already limited to a single isolated strand, ‘lifted’ by the initial 5′ RACE approach. In the case of TCRs and B-cell receptors, the known region is the constant region of the receptor located just after the J segment in the mRNA transcript. This method induces less bias, compared with primers directed at the V and J segments, which are diverse across the genome.
Figure 2.
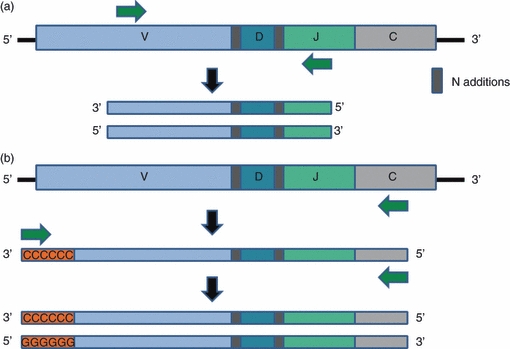
Different PCR amplification techniques. (a) Multiple primers – two primers are designed to complement regions within the V and J segments. (b) 5′ RACE – only one primer is designed to complement the constant region of the cDNA. After the first amplification round, a homopolymer is synthetically added to the 3′. The cDNA is again amplified with the first specific primer and another primer targeting the homopolymer.
Figure 1.
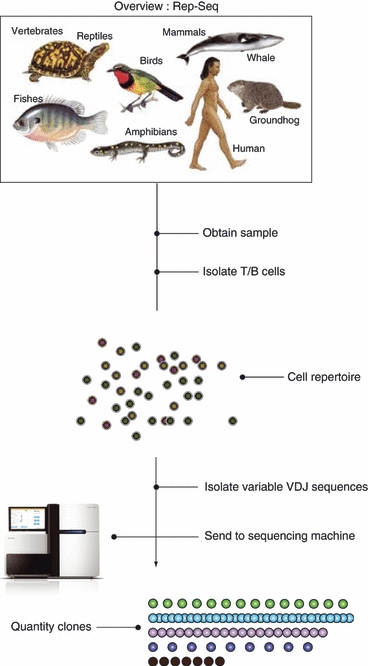
An overview of the process of obtaining the immunological repertoire. Starting with the relevant biological sample, T or B cells are isolated. According to the specific method used, recombined sequence regions are isolated and sequenced on a massive parallel sequencing machine. According to output sequences, clones are quantified.
The use of RNA (and not DNA – more below) is another source of bias: there are different quantities of mRNA in different cells. For example, active B cells and plasma cells produce vastly increased amounts of mRNA compared with resting B cells. Given that we aim to derive the structure of the repertoire, as it is defined per cell in the immune system, these different quantities of RNA may introduces a major bias toward sequences expressed by cells that are more actively producing RNA. Sorting for the removal of plasma cells may help to prevent such bias. In T cells, the problem may be more subtle, as activated cells may or may not produce more TCRs, depending on the stage of cell activation.
Diversity in the immune receptor repertoire
Large-scale repertoire analysis of immune receptors can provide powerful results. First, it may provide an insight to better understanding, or a temporal snapshot of the adaptive immune repertoire. Second, it may provide improved understanding of the way by which the immune system disposes of unwanted infections. Further, this knowledge could be used in therapeutic contexts, most obviously in vaccine development, but in principle in every aspect of maintaining organism homeostasis.
The B and T cells, key players in the adaptive immune system, are typically activated by antigen contact via their receptors. The receptors are diversified through a sequence of mechanisms that maximize this diversity to enable a potential response to every presented peptide. Heavy–light chain and β–α chain genes, generating the B-cell and T-cell heterodimer receptor, respectively, undergo non-precise V(D)J segment rearrangements, templated and non-templated nucleotide additions and deletions.27,28 Immunoglobulin chains further diversify through somatic hypermutations – a process of stepwise incorporation of single nucleotide substitutions into the V gene, underpinning much of the antibody diversity and affinity maturation.29,30
This immense theoretical combinatorial diversity challenges immunology. As recent as 2006, it was practically impossible to sequence enough DNA or RNA to obtain a statistically sound sample of the repertoire. The rapid advance in sequencing technologies provides improvements in read length, throughput and cost. These advances enable the current data sets of the immunological repertoire.
Sequencing is a numbers game. When we try and reach the best coverage of the immunological repertoire, we actually aim to sequence as many immunoglobulin sequences as possible, out of the whole repertoire. That is, we aim to maximize the ratio between sequenced immunoglobulins (SI) to the total number of immunoglobulins (TI) in the organism. We aim to reach an SI : TI ratio of 1. When this SI : TI ratio has been reached, an account for the entire repertoire can be obtained.
Smaller model organisms, therefore, provide a better starting point from which to reach this ratio. Smaller organisms contain significantly fewer cells in total and, obviously, fewer immune cells. Much smaller organisms (e.g. the round worm) are sufficient for some aspects of immunology (see refs 31,32) but not for studying the lymphocyte repertoire. Zebrafish, Danio rario, are an ideal model system for studying the adaptive immune system for two reasons: first, they have the earliest recognizable adaptive immune system whose features match the essential human elements, and second, the zebrafish immune system has only ∼ 300 000 antibody-producing B cells, making it three orders of magnitude simpler than mouse and five orders of magnitude simpler than human. Recent works study the zebrafish B-cell repertoire via high throughput analysis.33
An important issue in the immune receptor diversity analysis is clone identification, e.g. classification of the obtained reads into clusters, under the assumption that relatively close sequences originate from the same clonally expanded cell. V(D)J segment identification is usually carried out by performing local alignment to germline sequences [available on the International ImMunoGeneTics (IMGT) database34]. However, D segment classification is more complex because of the short length of the sequence, as opposed to V and J genes. Furthermore, nucleotide deletions and P/N additions occur frequently during somatic recombination processes at the V–D and D–J junctions.
Much immunological interest is focused on the complementarity determining region 3 (CDR3) of the chains,14,18–20,22,25,33 the most variable locus of the three CDR regions, and especially the β chain of the TCR.14,18–20,22,25 A recent study focused only on a small portion of the TCR-β repertoire by capturing only sequences generated by a specific gene recombination.22 Read length is a critical parameter in this case, as the entire V(D)J region is ∼ 300 nucleotides in length, including its V and J segments. This has been solved by either using the 454 method (with longer reads), the Douek approach (see above) or special methods of read assembly as in refs 14,25.
Once sequences are available, different perspectives portray the repertoire: the size of the repertoire; similarities between repertoires; V(D)J segment use; nucleotide insertions and deletions; CDR lengths; and amino acid distributions along the CDRs. Analysis may be performed at the individual level or at the multi-level scale, such as naive versus memory cells,19,20,22 different B-cell isotypes (IgM, IgG),17,21,33 CD4 and CD8 T cells20,25 or lymphocytes at different stages of development20 (Table 1).
Table 1.
Summary of immune receptor repertoire studies using next-generation sequencing.
| Paper | Model | Cell type | Receptor chain | Sequencing technology | PCR amplification | Main conclusions |
|---|---|---|---|---|---|---|
| Robins et al.19 | Human | T cells, CD4+/CD8+, naive and antigen-experienced | β chain/CDR3 | Illumina | Multiple primers | Nucleotide insertion bias towards G and C. High-frequency sequences have fewer nucleotide insertions and so are closer to germline sequences. Estimate of naive repertoire size is threefold to fourfold greater than previously estimated (106) and the antigen-experienced repertoire is 10-fold higher than ∼ 105. |
| Weinstein et al.33 | Zebrafish | B cells, IgM | Heavy chain, CDR3 | 454 | Multiple primers | Analysed V–D–J usage. Zebrafish use 50–86% of possible VDJ combinations, individuals shared similar frequency distribution, evidences of convergence – same antibody in many fish. Repertoire size estimate – 5000–6000 unique antibodies (IgM and heavy chain only). |
| Freeman et al.25 | Human | T cells, CD4+ CD8+ | β chain, CDR3 | Illumina | 5′-RACE | An evidence of convergence – the same amino acid was translated from multiple nucleotide sequences. V gene usage ranged between 0·01 and 24·6% and J usage between 1·6 and 17·2%. CDR3 lengths ranged from 21 to 81 nucleotides. |
| Boyd et al.21 | Human | B cells | Heavy chain | 454 | Multiple primers | Characterize IgH repertoire in healthy patients and in malignancies. V and J usage in healthy populations showed a diverse use, whereas samples that contained clonal IgH populations corresponding to lymphomas or chronic lymphocytic leukaemia specimens were readily identified. Showed that post-transplant lymphoproliferative disorder can develop multiple independent malignant clones. |
| Glanville et al.17 | Human | B cells, IgM | Heavy/light chains, CDR1, CDR2, CDR3 | 454 | Multiple primers | All germline gene families were represented within the sequences. In addition to CDR3, CDR1 and CDR3 also substantially contribute to the sequence variability caused by somatic hypermutations. They determined lower bounds of 2·2 × 105 unique heavy chain sequences and 1·6 × 105 unique light chains. |
| Robins et al.18 | Human | T cells, CD8+, naive and memory | β chain | Illumina | Multiple primers | CDR3 repertoire strongly biased towards specific V–J usage, most have few nucleotide insertions, only 0·1% of total estimated number of sequences. Overlap between two individuals is ∼ 7000 higher than expected. |
| Wang et al.20 | Human | T cells, CD4+ CD8+, naive and memory | β/α chains, CDR3 | 454 | Multiple primers | Observed 84% of possible Vα–Jα and Vβ–Jβ combinations in data. No significant difference was observed among T-cell subsets (V, J usage, CDR3 length, nucleotide additions, amino acid frequency). Estimated 0·47 × 106 and 0·35 × 106 unique TCR-α and TCR-β nucleotide sequences. Among the clonally expanded T cells, the majority of regulatory T cells and T helper type 1 and type 2 cells are related to memory T cells, whereas the majority of cytotoxic T cells are related to naive T cells. |
| Ben-Hamo and Efroni41 | Zebrafish | B cells, IgM | Heavy chain | 454 | Multiple primers | Constructed sequences and mutations networks out of zebrafish IgM heavy chains. Fish population was divided into two groups based on V–J usage. The first group showed uniform usage, whereas the other revealed distinct subsets of sequences, suggesting that the latter had undergone a major antigen challenge. |
| Venturi et al.10 | Human | T cells, naive and memory | β chain, CDR3 | 454 | Multiple primers | Analysed TRBV12-4/TRBJ1-2 gene recombination only. High frequency clonotypes are shared among individuals. Convergent recombination shapes the TCR repertoire of the memory and naive T-cell pools, and also between individuals. |
| Warren et al.14 | Human | T cells, naive and memory | β chain | Illumina | 5′-RACE | Determined the sequencing error rate empirically and filtered the data. Multiple individuals share highly similar V and J gene usage frequencies, but only 1·1% of nucleotide sequences are shared. At the amino acid level, more sequences were shared. Shared amino acid sequences were encoded by a large diversity of nucleotide sequences. |
One important implementation of Rep-Seq is in estimating the number of unique receptors, i.e. the size of the expressed repertoire in an individual at any given moment.14,17,19,20,33 Estimates of the number of non-sampled receptors are key for an accurate quantification of the total diversity. A solution for an analogous problem was identified > 60 years ago by the legendary statistician Fisher. The problem, termed the ‘unseen species problem’, refers to the attempt to estimate the total number of species in a given large population, based on random samples of species.35–37 Fisher et al.37 developed an analytic solution, assuming a Poisson distribution, which was later extended by Efron and Thisted.35 This analytical solution is mainly a capture–recapture method, associated with statistical analysis of these repeatedly sampled collections of sequences.
Various estimation attempts were made, by estimating the number of unique V(D)J combinations. Since receptor diversity is also created by nucleotide insertions and deletions (indels) and somatic hypermutations in B cells, these estimations are only lower boundaries to the actual number of possible combinations. Most studies focused on a single chain of the immune receptor and therefore resulted in describing only a portion of the total diversity obtained by the combination of the two chains constructing the heterodimer. For example, Wang et al.20 estimated 0·47 × 106 TCR-α unique nucleotide sequences and 0·35 × 106 TCR-β sequences. Robins et al.19 suggested that CD8+ T cells express < 0·1% of the combinatorial landscape of the β chain (5 × 10¹¹). Weinstein et al. showed a lower limit of 5000–6000 unique antibodies in the zebrafish.33 Although these are only lower limits to the actual size of the repertoire, it is clear that any individual expresses only a small fraction of the potential diversity (Figs 2 and 3).
Figure 3.
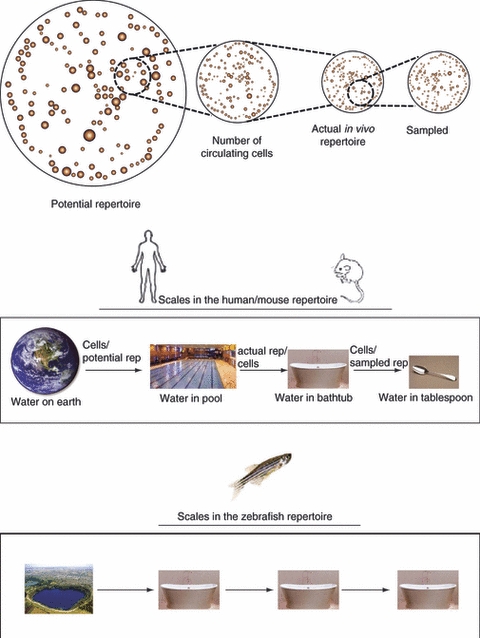
An account of the scales in the immunological repertoire, depicted through scales of water bodies. For example, sampling of the repertoire in human, is like samples a swimming pool using a single tablespoon. In zebrafish, the equivalent would be a 1:1 sampling. That is, current machinery enables the sampling of all the cells in the fish, or, in its scale parallel, sampling all of the water in a bathtub, utilizing all the water in the bathtub.
In spite of substantial advances in repertoire size estimates, there remain three important issues with the capture–recapture approach that require further attention: First, the common assumption is that the number of unique clones is distributed according to a Poisson distribution. However, recent studies show evidence of a power law distribution.33 Moreover, Fisher et al. demonstrated that several estimation approaches conflict; in terms of receptor sequences, they determined a ratio of the number of new and unique sequences discovered in a new sample divided by the total size of the data (i.e. the whole repertoire expressed in an individual). When this ratio is < 1, i.e. only a portion of the sample contains new sequences, all estimations agree. However, when the ratio is > 1, some approaches converge and stabilize while others completely diverge.35 The latter is probably the case in immune receptor sequencing; one should therefore consider the possibility of using other estimation approaches. Second, clone classification is still under controversy, i.e. how sequences are clustered together and defined as the same clone class sequence. This definition can range from a strict definition that does not allow any mutations to a liberal definition that allows a small number of mutations. The third issue is sample size. Some approaches consider only unique sequences, but instil a strong bias towards small clones. A different approach uses the entire sample, taking into account the relative abundances of each unique sequence, but disregards a bias that may occur as the result of PCR amplification during sequencing; there is no certainty that the amplification process is consistent across all DNA molecules and therefore different abundances of sequences may not necessarily reflect a biological difference.
The use of large-scale analysis methods in studying stages in the development of immune receptor populations, during immune development, pathological infections, autoimmunity or cancer, is undoubtedly essential to a better understanding of selection events in the immune system. Indeed, recent work demonstrates that populations of clones are dominated by the abundance of specific clones, indicating that this is not a random mechanism.19,20,25 For example, Vβ–Jβ combination frequencies in T cells vary greatly within the naive and memory repertoires of an individual, but show consistent behaviour among individuals,19 suggesting a biased repertoire selection. In addition, Vβ–Dβ–Jβ utilization analysis indicates that Vβ–Dβ recombination is random, as opposed to Dβ–Jβ combinations. These results suggest that this might be a result of physical restrictions of the gene locus configurations.19
Frequency analysis on the CDR3 sequences in T cells performed by Robins et al. revealed a strong negative correlation between the CDR3 sequence frequency and the amount of insertions in the Vβ–Dβ and Dβ–Jβ junctions; that is, a high frequency CDR3 generally contains a smaller number of insertions in those junctions. This means that high-frequency CDR3 cells have closer similarity to their germline sequence.18,19 Moreover, sequences with fewer insertions are more likely to be shared among individuals.19 This places at centre stage theories of immunological central mechanisms such as Cohen’s Immunological Homunculus.38
Additional analyses of correlations between multiple repertoires of different individuals14,19,20,22,33 reveal much higher similarity than expected at random. For example, a study of the naive CD8+ T-cell population demonstrated that in any two donors the overlap is ∼ 7000-fold larger than with a random repertoire built with uniform distribution.19 Furthermore, evidence shows a potential influence of HLA serotype on T-cell repertoire.14,39
These findings show a non-random sequence selection during repertoire formation of the heavy/β, suggesting a convergent recombination mechanism.19,22,33 According to this model, the same nucleotide sequences can be generated by multiple recombination events, and multiple nucleotide sequences are translated to the same amino acid sequence. This may explain why high-frequency clones are shared between individuals, and might be a plausible explanation for ‘public’ T-cell clones.10,22,39 This phenomenon describes a situation in which the same TCR sequence is produced in different individuals, as a response to identical antigen presentation. Findings also show that public TCRs can sometimes be found within individuals sharing a common MHC allele, for example, in response to infectious diseases.10,39 This aspect of the repertoire may have serious implications for our understanding of the initial ability of an individual to fight incoming threats. Biases in TCRs have also been observed in cancer, autoimmune diseases and in responses to allergens.39 Although these public T-cell responses against specific pathogens may provide a first line of defence, they may have a weakness in the rapid response to RNA viruses, which mutate rapidly, such as HIV and its simian counterpart.40
A completely different and novel approach to characterize the receptor repertoire is by network analysis. Many structural features can be studied from the aspect of network architecture, and so might help to better understand the dynamics of the immune response. Extended analysis of the zebrafish B-cell repertoire was performed by the construction of sequence and mutation networks.41 This analysis revealed that the fish sequence population self-organizes into two distinct groups, based on their network structure and their V–J combinations usage. The first group shows a uniform V–J combination utilization with a uniformly connected network, whereas the other group revealed distinct subsets of immunoglobulin sequences, in the form of a much highly connected sub-network and higher V–J combination frequencies. A plausible hypothesis is that this second group underwent a more complex immune response whereas the first one might only have responded to a minor challenge.
The enormous quantity of reads generated by NGS technologies necessitates cautious interpretation. Potential errors during the sequencing process may skew interpretation. Therefore, repertoire analysis reliability depends on sequencing depth and coverage, but also on sequencing accuracy. Nguyen et al.42 recently tried to directly assess these error rates and proposed new approaches to reduce the number of erroneous sequences within the repertoire by profiling these errors and implementing quality filters. For this, they analysed specific transgenic TCRs obtained from RAG-deficient mice, allowing them to express a single germline rearranged TCR and therefore to compare the sequenced receptor with the original DNA. Their findings showed a total rate of 1–6% erroneous sequences, which are greatly, but not totally, reduced after the filtering process. Error rate assessment can also be performed by aligning the obtained sequences to TCR J segment germline sequences and by filtering the erroneous reads, based on sequence redundancy.14 Finally, filtering and error rate assessment should be performed with extreme caution because the rare receptor sequences that are presented at very low levels in an individual might be mistaken for error-containing sequences and ignored.
Other uses
Construction of synthetic antibody libraries is important for therapeutic antibody development. Recent studies have presented novel methods for library design combining NGS. These libraries are generated by introducing diversity in the variable region of the antibody43,44 and high throughput sequencing was used to characterize the coverage and diversity of VH and Vκ sequences.
High throughput sequencing analysis can also be used for the production of mono-clonal antibodies. Massive production of antigen-specific antibodies is essential for both research and clinical aspects, mainly for diagnostic and therapeutic treatments (cancer, autoimmune diseases etc.). Reddy et al. used massively parallel sequencing technology for antibody isolation to overcome the extremely time-consuming step of screening for recombinant antibodies that was used previously.45 Recombinant genes are synthesized from paired VH and VL segments, based on the understanding that VH and VL have relatively similar expression frequencies and originate from the same B cell, and therefore constitute the complete antibody dimer.
Large-scale sequencing of rearranged immune receptor genes can also be of use in the detection and tracking of clonally expanded B-cell and T-cell populations in different physiological and pathological conditions. Lymphocyte malignancies usually originate from a single dominant immunoglobulin or TCR. Therefore, obtaining information about the relative abundance of these receptors using high throughput sequencing methods might be key for better understanding their nature. Large-scale sequencing of the immune receptors repertoire offers distinct and highly detailed molecular characterization that may reform our perception of the immune system while supporting diagnosis, prognosis and monitoring of disease.
Rep-Seq: facing the future
Ever since its introduction as a well-established method only a few years ago, NGS has emerged as a major player in molecular biology, genomics, systems biology and other fields.46 Next-generation sequencing promises to make a similar impact in immunity, and presents, for the first time, an opportunity for a comprehensive view of the T-cell and B-cell repertoires. As much as this technology presents an opportunity, it brings with it major challenges in data storage and data analysis. We need to consider human ability to store these data, to view these data and to produce meaning from the data. The community’s interest in sequencing and its applications promises some of the solutions as already available. For example, whole genome sequencing produces hundreds of giga-bases per sample, with tens of thousands of whole genomes expected within the next few years, storage for these sequencing projects is to be allocated. Rep-Seq produces orders of magnitude less data. The issue of allocating storage for Rep-Seq experimentation is therefore easily absorbed into the public storage space currently allocated for sequencing projects. Furthermore, cloud computing is being actively used by different groups worldwide for NGS.47 There are multiple cloud providers, both commercial and open source, such as Amazon, Rackspace, GoGrid, Nimbus and Eucalyptus, all provide central processing units, memory and storage devices.48 Cloud-based data storage and data processing not only provides dynamic and parallel storage services but also enables easy on-demand file sharing and easy access to these data worldwide. In immunology, the International ImMunoGeneTics database,49 has positioned itself as a highly useful tool. ImMunoGeneTics is a high-quality integrated database specializing in immunoglobulin, TCRs and MHC molecules of all vertebrate species. ImMunoGeneTics is the main and only database that curates all these data in one place and has actively gathered tools for sequence analysis and alignment. However, the rapid changes and development in the field of repertoire sequencing call for new databases and tools for the analysis of whole repertoires, and for the comparisons between species. Rep-Seq provides a segue to systems immunology approaches that, with the combination of new computational system-based tools, promise to enrich immunology. The complexity that characterizes the immune system and immune response can only be fully understood by a systems-approach to integrate processes, experimental data and high-level computational algorithms.
References
- 1.Kircher M, Kelso J. High-throughput DNA sequencing – concepts and limitations. Bioessays. 2010;32:524–36. doi: 10.1002/bies.200900181. [DOI] [PubMed] [Google Scholar]
- 2.Kuroda M, Katano H, Nakajima N, et al. Characterization of quasispecies of pandemic 2009 influenza A virus (A/H1N1/2009) by de novo sequencing using a next-generation DNA sequencer. PLoS ONE. 2010;5:e10256. doi: 10.1371/journal.pone.0010256. [DOI] [PMC free article] [PubMed] [Google Scholar]
- 3.Zerbino DR, Birney E. Velvet: algorithms for de novo short read assembly using de Bruijn graphs. Genome Res. 2008;18:821–9. doi: 10.1101/gr.074492.107. [DOI] [PMC free article] [PubMed] [Google Scholar]
- 4.Kassahn KS, Waddell N, Grimmond SM. Sequencing transcriptomes in toto. Integr Biol (Camb) 2011;3:522–8. doi: 10.1039/c0ib00062k. [DOI] [PubMed] [Google Scholar]
- 5.Lefrancois P, Zheng W, Snyder M. ChIP-Seq using high-throughput DNA sequencing for genome-wide identification of transcription factor binding sites. Methods Enzymol. 2010;470:77–104. doi: 10.1016/S0076-6879(10)70004-5. [DOI] [PubMed] [Google Scholar]
- 6.Wen J, Parker BJ, Jacobsen A, Krogh A. MicroRNA transfection and AGO-bound CLIP-seq data sets reveal distinct determinants of miRNA action. RNA. 2011;17:820–34. doi: 10.1261/rna.2387911. [DOI] [PMC free article] [PubMed] [Google Scholar]
- 7.Nielsen R, Paul JS, Albrechtsen A, Song YS. Genotype and SNP calling from next-generation sequencing data. Nat Rev Genet. 2011;12:443–51. doi: 10.1038/nrg2986. [DOI] [PMC free article] [PubMed] [Google Scholar]
- 8.Metzker ML. Sequencing technologies – the next generation. Nat Rev Genet. 2010;11:31–46. doi: 10.1038/nrg2626. [DOI] [PubMed] [Google Scholar]
- 9.Schweiger MR, Kerick M, Timmermann B, Isau M. The power of NGS technologies to delineate the genome organization in cancer: from mutations to structural variations and epigenetic alterations. Cancer Metastasis Rev. 2011;30:199–210. doi: 10.1007/s10555-011-9278-z. [DOI] [PubMed] [Google Scholar]
- 10.Venturi V, Price DA, Douek DC, Davenport MP. The molecular basis for public T-cell responses? Nat Rev Immunol. 2008;8:231–8. doi: 10.1038/nri2260. [DOI] [PubMed] [Google Scholar]
- 11.Shendure J, Ji H. Next-generation DNA sequencing. Nat Biotechnol. 2008;26:1135–45. doi: 10.1038/nbt1486. [DOI] [PubMed] [Google Scholar]
- 12.Margulies M, Egholm M, Altman WE, et al. Genome sequencing in microfabricated high-density picolitre reactors. Nature. 2005;437:376–80. doi: 10.1038/nature03959. [DOI] [PMC free article] [PubMed] [Google Scholar]
- 13.Mardis ER. Next-generation DNA sequencing methods. Annu Rev Genomics Hum Genet. 2008;9:387–402. doi: 10.1146/annurev.genom.9.081307.164359. [DOI] [PubMed] [Google Scholar]
- 14.Warren RL, Freeman JD, Zeng T, Choe G, Munro S, Moore R, Webb JR, Holt RA. Exhaustive T-cell repertoire sequencing of human peripheral blood samples reveals signatures of antigen selection and a directly measured repertoire size of at least 1 million clonotypes. Genome Res. 2011;21:790–7. doi: 10.1101/gr.115428.110. [DOI] [PMC free article] [PubMed] [Google Scholar]
- 15.Gupta PK. Single-molecule DNA sequencing technologies for future genomics research. Trends Biotechnol. 2008;26:602–11. doi: 10.1016/j.tibtech.2008.07.003. [DOI] [PubMed] [Google Scholar]
- 16.Voelkerding KV, Dames S, Durtschi JD. Next generation sequencing for clinical diagnostics-principles and application to targeted resequencing for hypertrophic cardiomyopathy: a paper from the 2009 William Beaumont Hospital Symposium on Molecular Pathology. J Mol Diagn. 2010;12:539–51. doi: 10.2353/jmoldx.2010.100043. [DOI] [PMC free article] [PubMed] [Google Scholar]
- 17.Glanville J, Zhai W, Berka J, et al. Precise determination of the diversity of a combinatorial antibody library gives insight into the human immunoglobulin repertoire. Proc Natl Acad Sci USA. 2009;106:20216–21. doi: 10.1073/pnas.0909775106. [DOI] [PMC free article] [PubMed] [Google Scholar]
- 18.Robins HS, Srivastava SK, Campregher PV, Turtle CJ, Andriesen J, Riddell SR, Carlson CS, Warren EH. Overlap and effective size of the human CD8+ T cell receptor repertoire. Sci Transl Med. 2010;2:47–64. doi: 10.1126/scitranslmed.3001442. [DOI] [PMC free article] [PubMed] [Google Scholar]
- 19.Robins HS, Campregher PV, Srivastava SK, et al. Comprehensive assessment of T-cell receptor β-chain diversity in αβ T cells. Blood. 2009;114:4099–107. doi: 10.1182/blood-2009-04-217604. [DOI] [PMC free article] [PubMed] [Google Scholar]
- 20.Wang C, Sanders CM, Yang Q, et al. High throughput sequencing reveals a complex pattern of dynamic interrelationships among human T cell subsets. Proc Natl Acad Sci U S A. 2010;107:1518–23. doi: 10.1073/pnas.0913939107. [DOI] [PMC free article] [PubMed] [Google Scholar]
- 21.Boyd SD, Marshall EL, Merker JD, et al. Measurement and clinical monitoring of human lymphocyte clonality by massively parallel VDJ pyrosequencing. Sci Transl Med. 2009;1:12–23. doi: 10.1126/scitranslmed.3000540. [DOI] [PMC free article] [PubMed] [Google Scholar]
- 22.Venturi V, Quigley MF, Greenaway HY, et al. A mechanism for TCR sharing between T cell subsets and individuals revealed by pyrosequencing. J Immunol. 2011;186:4285–94. doi: 10.4049/jimmunol.1003898. [DOI] [PubMed] [Google Scholar]
- 23.van Dongen JJ, Langerak AW, Brüggemann M, et al. Design and standardization of PCR primers and protocols for detection of clonal immunoglobulin and T-cell receptor gene recombinations in suspect lymphoproliferations: report of the BIOMED-2 Concerted Action BMH4-CT98-3936. Leukemia. 2003;17:2257–317. doi: 10.1038/sj.leu.2403202. [DOI] [PubMed] [Google Scholar]
- 24.Bertioli D. Rapid amplification of cDNA ends. Methods Mol Biol. 1997;67:233–8. doi: 10.1385/0-89603-483-6:233. [DOI] [PubMed] [Google Scholar]
- 25.Freeman JD, Warren RL, Webb JR, Nelson BH, Holt RA. Profiling the T-cell receptor β-chain repertoire by massively parallel sequencing. Genome Res. 2009;19:1817–24. doi: 10.1101/gr.092924.109. [DOI] [PMC free article] [PubMed] [Google Scholar]
- 26.Quigley MF, Almeida JR, Price DA, Douek DC. Unbiased molecular analysis of T cell receptor expression using template-switch anchored rt-PCR. Curr Protoc Immunol. 2011;10:33. doi: 10.1002/0471142735.im1033s94. [DOI] [PMC free article] [PubMed] [Google Scholar]
- 27.Tonegawa S. Somatic generation of antibody diversity. Nature. 1983;302:575–81. doi: 10.1038/302575a0. [DOI] [PubMed] [Google Scholar]
- 28.Bassing CH, Swat W, Alt FW. The mechanism and regulation of chromosomal V(D)J recombination. Cell. 2002;109(Suppl):S45–55. doi: 10.1016/s0092-8674(02)00675-x. [DOI] [PubMed] [Google Scholar]
- 29.Li Z, Woo CJ, Iglesias-Ussel MD, Ronai D, Scharff MD. The generation of antibody diversity through somatic hypermutation and class switch recombination. Genes Dev. 2004;18:1–11. doi: 10.1101/gad.1161904. [DOI] [PubMed] [Google Scholar]
- 30.Maizels N. Somatic hypermutation: how many mechanisms diversify V region sequences? Cell. 1995;83:9–12. doi: 10.1016/0092-8674(95)90227-9. [DOI] [PubMed] [Google Scholar]
- 31.Xiao C, Rajewsky K. MicroRNA control in the immune system: basic principles. Cell. 2009;136:26–36. doi: 10.1016/j.cell.2008.12.027. [DOI] [PubMed] [Google Scholar]
- 32.Meeker ND, Smith AC, Frazer JK, Bradley DF, Rudner LA, Love C, Trede NS. Characterization of the zebrafish T cell receptor β locus. Immunogenetics. 2010;62:23–9. doi: 10.1007/s00251-009-0407-6. [DOI] [PubMed] [Google Scholar]
- 33.Weinstein JA, Jiang N, White RA, 3rd, Fisher DS, Quake SR. High-throughput sequencing of the zebrafish antibody repertoire. Science. 2009;324:807–10. doi: 10.1126/science.1170020. [DOI] [PMC free article] [PubMed] [Google Scholar]
- 34.Lefranc MP, Giudicelli V, Ginestoux C, et al. IMGT, the international ImMunoGeneTics database. Nucleic Acids Res. 1999;27:209–12. doi: 10.1093/nar/27.1.209. [DOI] [PMC free article] [PubMed] [Google Scholar]
- 35.Efron B, Thisted R. Estimating the number of unseen species: how many words did Shakespeare know? Biometrika. 1976;63:435. [Google Scholar]
- 36.Bunge J, Fitzpatrick M. Estimating the number of species: a review. J Am Stat Assoc. 1993;88:364–73. [Google Scholar]
- 37.Fisher RA, Corbet AS, Williams C. The relation between the number of species and the number of individuals in a random sample of an animal population. J Anim Ecol. 1943;12:42–58. [Google Scholar]
- 38.Cohen IR. Biomarkers, self-antigens and the immunological homunculus. J Autoimmun. 2007;29:246–9. doi: 10.1016/j.jaut.2007.07.016. [DOI] [PubMed] [Google Scholar]
- 39.Miles JJ, Douek DC, Price DA. Bias in the αβ T-cell repertoire: implications for disease pathogenesis and vaccination. Immunol Cell Biol. 2011;89:375–87. doi: 10.1038/icb.2010.139. [DOI] [PubMed] [Google Scholar]
- 40.Price DA, West SM, Betts MR, et al. T cell receptor recognition motifs govern immune escape patterns in acute SIV infection. Immunity. 2004;21:793–803. doi: 10.1016/j.immuni.2004.10.010. [DOI] [PubMed] [Google Scholar]
- 41.Ben-Hamo R, Efroni S. The whole-organism heavy chain B cell repertoire from Zebrafish self-organizes into distinct network features. BMC Syst Biol. 2011;5:27. doi: 10.1186/1752-0509-5-27. [DOI] [PMC free article] [PubMed] [Google Scholar]
- 42.Nguyen P, Ma J, Pei D, Obert C, Cheng C, Geiger TL. Identification of errors introduced during high throughput sequencing of the T cell receptor repertoire. BMC Genomics. 2011;12:106. doi: 10.1186/1471-2164-12-106. [DOI] [PMC free article] [PubMed] [Google Scholar]
- 43.Ge X, Mazor Y, Hunicke-Smith SP, Ellington AD, Georgiou G. Rapid construction and characterization of synthetic antibody libraries without DNA amplification. Biotechnol Bioeng. 2010;106:347–57. doi: 10.1002/bit.22712. [DOI] [PubMed] [Google Scholar]
- 44.Zhai W, Glanville J, Fuhrmann M, et al. Synthetic antibodies designed on natural sequence landscapes. J Mol Biol. 2011;412:55–71. doi: 10.1016/j.jmb.2011.07.018. [DOI] [PubMed] [Google Scholar]
- 45.Reddy ST, Ge X, Miklos AE, Hughes RA, et al. Monoclonal antibodies isolated without screening by analyzing the variable-gene repertoire of plasma cells. Nat Biotechnol. 2010;28:965–9. doi: 10.1038/nbt.1673. [DOI] [PubMed] [Google Scholar]
- 46.Maher B. Human genetics: genomes on prescription. Nature. 2011;478:22–4. doi: 10.1038/478022a. [DOI] [PubMed] [Google Scholar]
- 47.Wall DP, Kudtarkar P, Fusaro VA, Pivovarov R, Patil P, Tonellato PJ. Cloud computing for comparative genomics. BMC Bioinformatics. 2010;11:259. doi: 10.1186/1471-2105-11-259. [DOI] [PMC free article] [PubMed] [Google Scholar]
- 48.Fusaro VA, Patil P, Gafni E, Wall DP, Tonellato PJ. Biomedical cloud computing with Amazon web services. PLoS Comput Biol. 2011;7:e1002147. doi: 10.1371/journal.pcbi.1002147. [DOI] [PMC free article] [PubMed] [Google Scholar]
- 49.Lefranc MP, Giudicelli V, Ginestoux C, et al. IMGT, the international ImMunoGeneTics information system. Nucleic Acids Res. 2009;37:D1006–12. doi: 10.1093/nar/gkn838. [DOI] [PMC free article] [PubMed] [Google Scholar]