

Abstract
During the transition from an initiation complex to an elongation complex (EC), T7 RNA polymerase undergoes major conformational changes that involve reorientation of a “core” subdomain as a rigid body and extensive refolding of other elements in the 266 residue N-terminal domain. The pathway and timing of these events is poorly understood. To examine this, we introduced proline residues into regions of the N-terminal domain that become α-helical during the reorganization and changed the charge of a key residue that interacts with the RNA:DNA hybrid 5 bp upstream of the active site in the EC but not in the initiation complex. These alterations resulted in a diminished ability to make products >5–7 nt and/or a slow transition through this point. The results indicate that the transition to an EC is a multistep process and that the movement of the core subdomain and reorganization of certain elements in the N-terminal domain commence prior to promoter release (at 8–9 nt).
During the initiation of transcription, RNA polymerases (RNAPs)4 must balance two opposing processes. One the one hand, the polymerase must associate tightly enough with the promoter to allow it to melt apart the two DNA strands and commence transcription. On the other, the polymerase must release the promoter and enter into a highly processive elongation phase. Competition between these two phases leads to the production of abortive transcripts in which the polymerase repeatedly tries to clear the promoter but is unable to surmount the transition barrier and releases short (abortive) RNA products (1–6). The instability of the transcription complex during this stage is often a key point for regulation of gene expression.
The process by which RNAPs make the transition from an initiation complex (IC) to an elongation complex (EC) is poorly understood. In the case of multisubunit RNAPs, this may be accompanied by release of one or more initiation factors (7). In single subunit RNAPs, such as T7 RNAP, the transition is accompanied by major conformational changes in the enzyme (8–10). The changes in T7 RNAP occur largely in the N-terminal domain (residues 1–266) and involve reorientation of a core subdomain (residues 72–151, 206–257) as a rigid body, as well as extensive refolding of other elements, including: the N-subdomain (helix C (residues 2–71)); a central flap-like subdomain (subdomain H (residues 152–205)); and the C-linker (residues 258–266) (see Fig. 1).
FIGURE 1. Reorganization of T7 RNAP during the transition to an EC.

The α-carbon backbones of the T7 RNAP in the IC and the EC are presented as ribbons (8 –10). The largely unchanged C-terminal domain is white; other elements that undergo rearrangement are color-coded as shown in the key at the bottom (amino acid residues are in parentheses). The T strand of the DNA is red, the NT strand is blue, and the nascent RNA is yellow. A, the structure of the IC and a model of the EC just prior to promoter release. The structures are aligned in the same orientation with regard to the unrearranged C-terminal domain. Note that in the EC, the core subdomain has rotated and translated as a rigid body and that other elements of the N-subdomain have become refolded. B, the organization of the N-terminal domain before and after the transition; elements are aligned with respect to the core subdomain. The core subdomain in the IC is shown in the same orientation as in panel A. Nucleic acids have been omitted for clarity. C, organization of the N-subdomain and the C-linker before and after the transition; the positions of mutagenized residues are depicted as spheres.
Although structural information reveals the configuration of the complexes before and after the transition, little is known about the pathway of the reorganization or the timing of these events. T7 RNAP maintains contacts with the upstream region of the promoter until the transcript achieves a length of 8–9 nt (5, 11–16). An important question is how the structure of the complex can accommodate the lengthening transcript while maintaining these interactions. In general, two types of models have been proposed. In the first, the transition to an EC is accompanied by a gradual reorganization of the RNAP that allows promoter contacts to be maintained as the RNA:DNA hybrid is extended from 3 bp (as observed in the IC) to 8–9 bp (as observed in the EC) (9, 10, 17) (here and throughout this report, the hybrid length assumes that the transcription complex is in the post-translocated state). An alternative type of model suggests that the length of the RNA:DNA hybrid remains fixed at ~3 bp and/or that local conformational changes in the RNAP and/or “scrunching” of the template allow extension of the transcript up to 8–9 nt without major refolding of the RNAP and that major changes in the organization of the complex occur during or after promoter release (9, 17, 18). Using limited proteolysis, it has recently been proposed that refolding of subdomain H into its final EC conformation occurs during or after promoter release (19).
To examine the transition pathway, we introduced a helix-destabilizing residue (proline) into regions of the N-terminal domain that become more α-helical during the reorganization or changed the charge of a key residue that interacts with the RNA:DNA hybrid in the EC, but not in the IC, and determined the effects of these substitutions on the early stages of transcription. A number of substitutions resulted in enhanced accumulation of products at 5–7 nt and/or a slow transition through this point (as determined by presteady state kinetic assays). The results support the idea that the transition to an EC is a sequential process in which movement of the core subdomain and refolding of certain elements in the N-terminal domain are likely to occur prior to promoter release.
EXPERIMENTAL PROCEDURES
T7 RNAP Mutants and DNA Templates
RNAP mutants were constructed by site-directed mutagenesis and purified as described previously (20). To assemble transcription templates, template (T) and non-template (NT) strand oligonucleotides (Integrated DNA Technologies, Coralville, IA; see below) were mixed at a concentration of 100 μM each in transcription buffer (20 mM Tris acetate (pH 7.9), 10 mM magnesium acetate, 0.1 mM EDTA, 0.05% Tween 20, 5 mM 2-mercaptoethanol), heated to 65 °C for 10 min, and cooled slowly to room temperature over 2 h.
Oligomer Sequences (5′–3′)
Oligomer sequences (5′–3′) are as follows: MJ6, TCGAAATTAATACGACTCACTATAGGGAGACCACAACCTCTCGT (NT); MJ7, ACGAGAGGTTGTGGTCTCCCTATAGTGAGTCGTATTAATTTCGA (T); SE51, TCGAAATTAATACGACTCACTATAGGATGACCACAACCTCTCGT (NT); SE52, ACGAGAGGTTGTGGTCATCCTATAGTGAGTCGTATTAATTTCGA (T); RB1, GCCGGGAATTTAATACGACTCACTATAGGGAGACCTCATCTTTGAA (NT); RB2, TTCAAAGATGAGGTCTCCCTATAGTGAGTCGTATTAAATTCCCGGC (T); RB3, AAATTAATACGACTCACTATAGGGAGACCACAACGGTTTC (NT); RB4, GAAACCGTTGTGGTCTCCCTATAGTGAGTCGTATTAATTT (T); RB5, CGTCAGGCAGACAGGACCC (NT); RB6, GGGTCCTGTCTGCCTGACGTATCGCCGC (T); and RB,: GCGGCGAU (RNA).
Steady State Transcription Assays
Transcription was carried out in a volume of 10 μl containing transcription buffer; 0.4 mM ATP, CTP, GTP, and UTP (GE Healthcare Ultrapure); 4 μCi of [γ-32P]GTP (specific activity 6000 Ci of mmol−1; PerkinElmer Life Sciences); 50 nM RNAP; and 250 nM transcription template. Reactions were incubated at 37 °C for 10 min and terminated by the addition of 10 μl of stop buffer (90% formamide, 50 mM EDTA, 0.20% (w/v) bromphenol blue, 0.02% (w/v) xylene cyanol) followed by heating to 98 °C for 2 min. The products were resolved by electrophoresis in 20% (w/v) polyacrylamide gels containing 7 M urea and analyzed by exposure to a PhosphorImager screen (GE Healthcare) using a Storm 860 scanner and ImageQuaNT Version 4.2a software (GE Healthcare).
To compare the stability of complexes halted at various positions downstream of the promoter, transcription assays were carried out with T7 RNAP (50 nM) on the SE51/SE52 DNA template (250 nM) with restricted mixtures of substrate and/or 3′-dNTPs, as indicated, in the presence of 2 μCi γ-P32 GTP. The reactions were quenched with EDTA (100 mM) after 3 min of incubation at 37 °C (control reactions with wild type (WT) RNAP indicated that such reactions were linear for at least 10 min), and the products were analyzed by 25% PAGE.
Presteady State Kinetics
Presteady state assays were carried out at 25 °C using a rapid chemical quench-flow instrument (KinTek Corp., Austin, TX) (21). T7 RNAP (15 μM final) and promoter DNA (10 μM final) (made from RB1 and RB2 oligomers) were mixed with NTPs (0.5 mM each final) and [γ-32P]GTP (from Amersham Biosciences), and the reaction was quenched with EDTA (150 mM) after the reaction times indicated. The quenched reaction mixtures were denatured at 95 °C for 5 min in sequencing gel loading buffer containing 50% formamide, and the products were separated in a sequencing gel containing 23% polyacrylamide, 3% bisacrylamide, and 4 M urea. The gel was exposed to a PhosphorImager screen (GE Healthcare), and the products were quantified using the Image-QuaNT™ program.
Trypsin Digestion
Limited proteolysis of T7 RNAP was performed as described previously (19). Briefly, T7 RNAP (3 μM) in the absence of template or in a complex with a promoter (made from oligomers RB3/RB4) (5 μM) was incubated with trypsin (2.5 μM) at 25 °C for 20 s with or without GTP (1 mM), ATP (0.5 mM), and CTP (0.5 mM). T7 RNAP EC were assembled on a nucleic-acid scaffold (5 μM) (oligomers RB5, RB6, and RB7) for 30 min before reaction with trypsin.
RESULTS
Design and Construction of Mutant RNAPs
The contacts made by T7 RNAP with the upstream region of the promoter in the IC largely involve three structural elements (22). Two of these are located in the core subdomain: the A+T rich recognition loop (residues 93–101) and a β-hairpin intercalating loop (residues 230–245). The third element (the specificity loop (residues 739–769)) projects into the DNA binding cleft from the C-terminal domain. Modeling of the RNA:DNA hybrid in the early IC indicated that as the hybrid is extended from 3 to 4 bp, it would clash with elements of the core subdomain, but suggested that limited movement of the core subdomain, together with movement of the specificity loop and the upstream element of the promoter, might allow the hybrid to extend to 5 bp without substantial refolding of other elements in the N-terminal domain (10). This scenario is supported by the observation that an IC-specific disulfide bond between the core domain and the C-terminal domain blocks transcription beyond 5–6 nt, presumably due to constrained mobility of the core (23).
The structure of the IC suggested that further movement of the core subdomain after this point would require refolding of elements in the N-terminal domain (in one or more stages) until the complex transitions completely to an EC. We therefore anticipated that perturbing the refolding events along the pathway might affect the pattern of abortive transcripts in a specific manner, resulting in an altered abundance of particular RNA products whose extension requires a critical refolding event at that stage. In this study, we focused upon two segments of the N-terminal domain: the N-subdomain (residues 2–71) and the C-linker.
During the transition to an EC, two segments in the N-subdomain (residues 45–49 and residues 54–55) undergo reorganization to allow the formation of a long, straight α-helix (helix C (9, 10)) (Fig. 1). Although the N-subdomain does not interact with nucleic acids in the IC, in the EC, the C-terminal portion of the extended helix (residues 50–60) interacts with phosphate groups 5–8 bp upstream from the 3′ end of the RNA:DNA hybrid (10). Proper refolding of the N-subdomain might therefore contribute to complex stability when the transcript achieves a length of 5–8 nt (10). Furthermore, the extended α-helix protrudes into the region formerly occupied by the core subdomain in the IC and includes residues that are contiguous with the core. It therefore seemed likely that refolding of the N-subdomain and reorientation of the core are linked and that the refolded N-subdomain might help to stabilize the core in its final position. The C-linker (residues 258–266), which connects the C-terminal portion of the core subdomain to the rest of T7 RNAP, also undergoes a refolding process in which a motif that is unfolded in the IC assumes an α-helical configuration that extends the C-terminal α-helix of the core subdomain toward the largely unrearranged C-terminal domain (Fig. 1, B and C).
To explore the effects of refolding of these elements, we substituted amino acids in these regions of the RNAP with proline, which is expected to disfavor the formation of an extended α-helix, and examined the consequences of these substitutions on the early stages of transcription. In addition, we also substituted a highly conserved positive residue in the N-subdomain that interacts with the phosphate group in the template DNA strand between −5 and −6 in the EC, but not in the IC, with a negatively charged residue (R50E; Table 1 and Fig. 1).
TABLE 1.
List of T7 RNAP mutants
| Subdomain | Mutant | Substitutions |
|---|---|---|
| N-subdomain | NMA11 | E45P, M46P |
| NMA12 | M54P, F55P | |
| NMA15 | E45P, M46P, G47P | |
| NMA17 | E48P, A49P | |
| SE4 | R50E | |
| C-linker | NMA18 | G259P, A260P, G263P |
| NMA19 | G259P, A260P, G263A | |
| Core | BH140 | E148A |
All substitution mutants in the N-subdomain were active, but as noted below, exhibited defects in the early stages of transcription. All C-linker mutants that we constructed were inactive in a promoter-dependent transcription assay (but retained activity in a promoter-independent assay, i.e. the ability to extend an RNA primer annealed to a DNA template strand (24)), indicating a critical role for the integrity of this subdomain during initiation.
Mutations in the N-subdomain Result in Enhanced Accumulation of Products of 5–7 nt
We examined transcription by WT and mutant RNAPs on a consensus promoter template (MJ6/MJ7) that encodes a 20-nt runoff transcript (Fig. 2A). A core subdomain mutant (E148A), which had previously been shown to make increased amounts of abortive products 5–6 nt in length (25), was included in the assays for comparison.
FIGURE 2. Mutations in the N-subdomain result in enhanced accumulation of products of 6–7 nt.

A, the transcription template was formed by annealing MJ6 and MJ7 NT and T strand oligomers; the start site is indicated by the arrow. Transcription products (10-min reaction), labeled by incorporation of [γ-32P]GTP, were resolved by gel electrophoresis. Lane 1, RNAs formed in the presence of GTP and ATP by WT T7 RNAP. Lane 2, G-ladder formed by WT RNAP in the presence of GTP. Lanes 3–9, RNAs formed in the presence of all NTPs for WT and mutant RNAPs, as indicated (see Table 1 for a list of mutant enzymes). The exposure shown in lane 7 was adjusted to compensate for a lower activity in this sample. B, the fraction of products that are not extended for each transcript of length N is calculated as the amount of RNA of length N divided by the amount of products ≥ N (32). Error bars indicate the standard error of deviation from 2 to 4 independent experiments; the significance of the variance of the means for WT versus each mutant RNAP (Student’s t test) is p < 0.002 for the 5– 6-nt products synthesized by BH140 and SE4, and p < 0.05 for the 6 –7-nt products synthesized by NMA11–17 (except for synthesis of the 6-nt product by NMA17).
T7 RNAP synthesizes only a G-ladder in the presence of the initiating nucleotide, GTP, due to transcript slippage (Fig. 2A, lane 2) (4). When the +4 NTP, i.e. ATP, is also present, WT RNAP synthesizes predominately a 6-nt transcript, GGGAGA (lane 1). In the presence of all four NTPs, WT RNAP makes a 20-nt runoff transcript, as well as abortive products ranging in lengths from 2 to 12 nt (4) (Fig. 2A, lane 3). As compared with WT RNAP, the N-subdomain proline substitution mutants all made greater amounts of abortive products of 6–7 nt (Fig. 2A, lanes 5–8, and 2B). Notably, the E148A and R50E mutants accumulated RNAs of 5–6 nt to a greater abundance during the reaction, indicating that these mutations affected initiation at an earlier stage than the proline substitution mutants (Fig. 2A, lanes 4 and 9, and 2B). Thus, the various mutant RNAPs tested here appear to have difficulty in elongating the RNA at different stages during the early stages of initiation.
Presteady State Assays Reveal a Delay in the Transition at 6–7 nt for the N-subdomain Mutant RNAPs
The transcription assays shown in Fig. 2 were carried out over a 10-min period, during which repeated transcript release and reinitiation events occur. Although these assays reveal points at which the transcription complex may become unstable (resulting in increased accumulation of products of a particular size) or points at which transcription may be blocked (resulting in decreased synthesis of products greater than this size), they do not reveal subtle changes in the kinetics of transcription that may occur during the early stages of initiation. To accomplish this, we used a presteady state assay to examine transcription in the millisecond–second time range. Fig. 3 shows the kinetics of RNA synthesis using WT, NMA11, NMA12, NMA15, and NMA17 mutant RNAPs.
FIGURE 3. N-subdomain mutants show defects during the transition at 6–7 nt in a presteady state transcription assay.

A, transcription was carried out in the presence of all four NTPs at 25 °C using a promoter template (RB1/RB2) that results in a 19-nt runoff product and WT or mutant T7 RNAPs, as indicated. Reactions were quenched with EDTA at various times, and the samples were analyzed by electrophoresis on a 23% polyacrylamide gel. For the time 0 sample, EDTA was added before the addition of NTPs. B, kinetics of extension of RNA to 5, 6, and 7 nt by WT and by mutant RNAPs. The fraction of RNA of length N unextended is calculated as in Fig. 2.
All mutants showed a significant delay in the synthesis of full-length runoff product and a lag in transition through 6–7 nt. The 5-nt RNA was made within 0.25 s and extended efficiently by both WT and the N-subdomain mutants, but the 6-and 7-nt RNA products were extended poorly to 8 nt and longer by the N-subdomain mutants as compared with the WT enzyme. The 8-nt product, for instance, was made in 2 s by the mutant enzymes as compared with 0.5 s by the WT enzyme. In addition, the 6–7-nt RNAs accumulated to a greater extent in the mutant enzyme reactions as compared with the WT enzyme (Fig. 3B). The mutants differ from one another in the relative production of 6- and 7-nt products. Although NMA12 and NMA17 abort transcription at 6–7 nt nearly 50% of the time, NMA11 and NMA15 accumulate these products to a level of ~25% at t > 10 s, and the rest are elongated to longer products. Thus, the NMA11 and NMA15 mutants exhibit a weaker defect relative to the NMA12 and NMA17 mutants.
As Compared with WT RNAP, N-subdomain Mutant RNAPs Exhibit Decreased Stability When Halted at 6–7 nt
The steady state transcription assays described above revealed a common defect in N-subdomain mutants (i.e. inefficient extension of transcripts beyond 6–7 nt). In addition to the slow passage through this stage (as revealed by presteady state experiments), another reason for the inefficient synthesis of transcripts beyond 6–7 nt could include a decreased stability of complexes at this stage.
To examine this, we compared the turnover rates of initiation complexes halted various distances downstream from the start site for both WT and mutant enzymes. The template shown in Fig. 4 (SE51/SE52) allows the synthesis of 2-, 3-, 4-, 6-, or 7-nt products in the presence of restricted mixtures of substrate NTPs and/or the addition of chain terminating 3′-dNTPs. The rates of accumulation of these products was determined for each enzyme and normalized to the rate of production of the 2-nt product (which should be independent of the transition to an IC and serves as an internal control). The normalized rates were then compared with that of the WT enzyme to give the turnover rate for mutant complexes halted at each position relative to that of the WT enzyme. The results (Fig. 4) show that NMA12 and NMA17 form less stable complexes than the WT enzyme when halted at 7 nt, having turnover rates that are 1.8–2.6-fold higher than WT RNAP. NMA17 also exhibited a significantly higher turnover rate when halted at 6 nt.
FIGURE 4. N-subdomain mutant RNAPs exhibit decreased stability when halted at 6–7 nt.

Transcription assays (10 min) were carried out on template SE51/SE52 in the presence of restricted mixtures of substrate NTPs and/or 3′-dNTPs, resulting in synthesis of transcripts of 2–7 nt in length. The reactions were quenched with EDTA, and the products were resolved by electrophoresis in 25% polyacrylamide gels and quantified by PhosphorImager analysis. The rates for the accumulation of each product were then compared with that of the WT enzyme (value = 1.0) to give the relative turnover rate for complexes halted at each position (see chart). Each bar represents the average of three independent determinations. Standard deviations are noted. The significance of the variance of this value (Student’s t test) for WT versus mutant RNAPs for product lengths of 7 nt is p < 0.01.
N-subdomain Mutants Are Defective in EC Formation
The conformational changes that occur during the transition to an EC are accompanied by changes in accessibility of particular regions of T7 RNAP to protease cleavage (24, 26, 27). Although limited trypsin digestion of free enzyme, a binary promoter complex, or the IC results in the appearance of a major band at 80 kDa (due to proteolysis near amino acid residues 170–180), the digestion of T7 RNAP in the EC conformation results in the appearance of a 90-kDa band due to proteolysis near residue 96 in the AT-rich recognition loop (24). These changes in the pattern of proteolysis have been used previously to characterize the transition from IC to EC (19).
To examine the effects of the N-subdomain mutations on refolding of the enzyme and the transition to an EC, complexes of WT and N-subdomain mutants were formed on a promoter template in the absence of substrate (to allow the formation of a binary complex), on a promoter template in the presence of a limiting mixture of NTPs that allows the formation of an EC halted at 15 nt, or on a nucleic acid scaffold that allows the direct formation of an EC, and the pattern of trypsin cleavage of these complexes was determined (Fig. 5). In the presence of promoter only, all RNAPs (lanes 4, 8, and 12) showed patterns characteristic of the unrearranged RNAP. In the presence of promoter and limiting NTPs or on the EC scaffold, WT RNAP exhibited the cleavage pattern that is characteristic of an EC (lanes 5 and 6), whereas the mutant RNAPs showed little or no change (lanes 9, 10, 13, and 14) (NMA11 showed marginal protection of the 80-kDa fragment in the presence of scaffold only but no appearance of the 90-kDa band (lane 10)). These results suggest that a defect in the N-subdomain refolding process hinders the mutant T7 RNAPs from assuming or maintaining the EC conformation.
FIGURE 5. N-subdomain mutants are defective in EC formation.

WT and mutant T7 RNAPs were incubated with a promoter template (RB3/RB4) in the presence of GTP, ATP, and CTP to form an EC halted at 15 nt or a nucleic acid scaffold (RB5/RB6/RB7) that gives rise to an EC. The complexes were subjected to limited digestion with trypsin, and the products were analyzed by 4 –20% Tris-glycine SDS-PAGE. The sizes of protein molecular weight (MW) markers are shown in the margin.
DISCUSSION
In this work, we examined the effects of substituting a helix-destabilizing residue (proline) into regions of T7 RNAP that become more α-helical during the transition from an IC to an EC. Such mutations in the N-subdomain (residues 45–49 and 54–55) resulted in enhanced accumulation of products of 6–7 nt, indicating an instability in the transcription complexes at this point. Using a presteady state kinetic assay, we found that the mutant enzymes exhibit a slow transition through the 6–7-nt stage. Taken together, we conclude that introducing proline residues into critical regions in the N-subdomain affects RNA synthesis at a stage when the RNA:DNA hybrid reaches a length of 6–7 bp (Fig. 6).
FIGURE 6. Refolding of the N-subdomain during the transition to an EC.
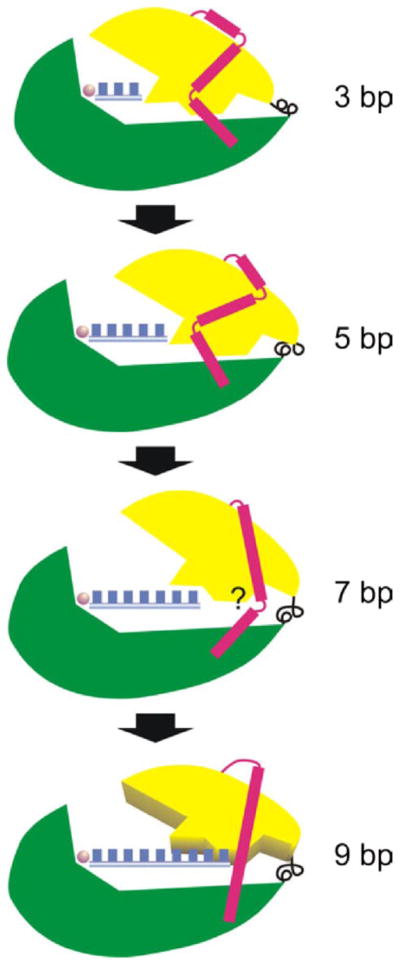
The schematic depicts the movement of the core subdomain (yellow) and refolding of the N-terminal subdomain (red) relative to the C-terminal domain (green) as the transcript length increases from 3 to 9 bp (blue boxes). The C-linker is black. Up to −5 bp movement of the core is apparently tolerated without a need to refold the N-subdomain. A transition at about 6 –7 bp appears to require refolding of at least some parts of the N-subdomain (e.g. the region associated with residues 45–55). Additional movement of the core is expected to occur up to promoter release (commencing at 9 bp) and the final transition to an EC.
The C-linker mutants that we constructed (for NMA18, G259P, A260P, and G263P; for NMA19, G259P, A260P, and G263A) were inactive in a promoter-dependent transcription assay. Recently, Guillerez et al. (28) reported the selection of a mutation in the C-linker (P266L) that decreased the synthesis of abortive products of 5–6 nt. This alteration, in which a helix-destabilizing proline in the WT enzyme is replaced by a non-helix destabilizing residue, represents a mirror image of our approach. The observation that the P266L mutation enhances efficient transition through the 5–6-nt stage is in accord with our results with the N-subdomain proline mutants (which inhibit the transition), as the P226L mutation is expected to decrease the barrier to refolding, whereas our mutations are expected to increase the barrier. The finding that the P266L mutation exerts its effect earlier than the effects of the N-subdomain mutants reported here (5–6 nt versus 6–7 nt) suggests that refolding of the C-linker may be more closely linked to movement of the core subdomain. This might be expected, as refolding of the C-linker extends the C-terminal α-helix of the core toward the unchanged C-terminal domain of T7 RNAP. Proper folding of the C-linker appears to be particularly sensitive to amino acid substitutions, as attempts to isolate additional mutations in this region by saturation mutagenesis were unsuccessful (28). This may explain why the mutations that we engineered into this region all resulted in enzymes that were inactive in a promoter-dependent assay.
Our findings that mutations in the N-subdomain affect transcription when the product length reaches 6–7 nt suggest that a key step in the refolding process occurs before promoter release. The emerging consensus concerning initiation by T7 RNAP indicates that the initial collapse of the upstream region of the transcription bubble and displacement of the RNA transcript commence at about 8–9 nt and are coupled with the early stages of promoter release (13, 14, 16, 18, 29, 30). However, promoter clearance and the formation of the final EC structure continue until ~12 nt of RNA have been synthesized (19), at which point the nascent transcript is expected to have emerged through the exit pore of the RNAP to the surface (31). Consistent with this interpretation, mutations in the RNA exit pore result in complex instability and enhanced accumulation of products of 12–13 nt (29).
Refolding of the N-subdomain and the formation of an extended helix allow interactions with the RNA:DNA hybrid that did not exist in the IC. One of these interactions involves a highly conserved Arg residue that forms a hydrogen bond with the phosphate backbone of the template DNA strand between positions −5 and −6 (10). If refolding of the N-subdomain occurs concurrently with extension of the RNA:DNA hybrid, as proposed here, these interactions would likely contribute to the stability of an intermediate complex in the transition to an EC at this point. It is therefore significant that substitution of this residue with a negatively charged amino acid (the R50E mutation) resulted in enhanced accumulation of transcripts of 5–6 nt (Fig. 2B). We note that a substitution of a residue in the “thumb” domain (R394A) that interacts with the RNA:DNA hybrid in the EC, but not in the IC, also resulted in enhanced accumulation of transcripts of 5–6 nt (32).
Earlier models suggested that T7 RNAP would be gradually reorganized to accommodate the RNA:DNA hybrid as it is extended from 3 to 8 bp (9, 10). Another early model suggested that the RNA:DNA hybrid remains fixed at 3 bp until the transcript reaches a length of 8 nt, at which point promoter release and reorganization of the complex are expected to occur (9). A more recent modeling study by Theis et al. (17, 33) suggested that movement of the entire N-terminal domain (including the core subdomain) might allow extension of the hybrid to at least 6 bp, without substantial reorganization, until promoter release allows reorientation of the core and major refolding of other elements in the N-terminal domain. Although similar in some regards to the model of Tahirov et al. 10 (in that extension of the RNA:DNA hybrid results in incremental movement of the core), certain aspects of the model by Theis et al. (17, 33) do not appear to be consistent with the observations reported here, as their model suggests that refolding of the N subdomain should occur after promoter release (at 8–9 nt). Lastly, work by Guo et al. (18), involving both disulfide cross-linking methods as well as a tethered chemical nuclease to probe the organization of the complex, suggested that no major reorganization of the complex occurred until promoter release and that the growing transcript was accommodated by local conformational changes and/or scrunching of the DNA template and/or the nascent transcript. However, the model of Guo et al. (18) is silent about whether the RNA:DNA hybrid is extended from 3 to 8 bp during the initiation process or how such an extended hybrid might be accommodated.
It is important to note that our results reflect only changes that involve the N-terminal subdomain and do not address issues as to when promoter contacts might be lost or when refolding of other elements in the N-terminal domain may occur. Clearly, more studies will be needed to address these topics, including the solution of crystal structures that capture intermediates during the transition to an EC.
Acknowledgments
We are grateful to Mr. Ray Castagna for expert technical assistance.
Footnotes
This work was supported by National Institutes of Health Grants GM38147, GM74252, and GM51966 (to W. T. M., D. G. V., and S. S. P., respectively).
The abbreviations used are: RNAP, RNA polymerase; IC, initiation complex; EC, elongation complex; nt, nucleotide; T, template; NT, non-template; WT, wild type.
References
- 1.Straney DC, Crothers DM. J Mol Biol. 1987;193:279–292. doi: 10.1016/0022-2836(87)90219-1. [DOI] [PubMed] [Google Scholar]
- 2.Carpousis AJ, Gralla JD. Biochemistry. 1980;19:3245–3253. doi: 10.1021/bi00555a023. [DOI] [PubMed] [Google Scholar]
- 3.Milligan JF, Groebe DR, Witherell GW, Uhlenbeck OC. Nucleic Acids Res. 1987;15:8783–8798. doi: 10.1093/nar/15.21.8783. [DOI] [PMC free article] [PubMed] [Google Scholar]
- 4.Martin CT, Muller DK, Coleman JE. Biochemistry. 1988;27:3966–3974. doi: 10.1021/bi00411a012. [DOI] [PubMed] [Google Scholar]
- 5.Guo Q, Sousa R. J Biol Chem. 2005;280:14956–14961. doi: 10.1074/jbc.M500518200. [DOI] [PubMed] [Google Scholar]
- 6.Gong P, Martin CT. J Biol Chem. 2006;281:23533–23544. doi: 10.1074/jbc.M604023200. [DOI] [PubMed] [Google Scholar]
- 7.Borukhov S, Nudler E. Curr Opin Microbiol. 2003;6:93–100. doi: 10.1016/s1369-5274(03)00036-5. [DOI] [PubMed] [Google Scholar]
- 8.Cheetham GM, Steitz TA. Science. 1999;286:2305–2309. doi: 10.1126/science.286.5448.2305. [DOI] [PubMed] [Google Scholar]
- 9.Yin YW, Steitz TA. Science. 2002;298:1387–1395. doi: 10.1126/science.1077464. [DOI] [PubMed] [Google Scholar]
- 10.Tahirov TH, Temiakov D, Anikin M, Patlan V, McAllister WT, Vassylyev DG, Yokoyama S. Nature. 2002;420:43–50. doi: 10.1038/nature01129. [DOI] [PubMed] [Google Scholar]
- 11.Ikeda RA, Richardson CC. Proc Natl Acad Sci U S A. 1986;83:3614–3618. doi: 10.1073/pnas.83.11.3614. [DOI] [PMC free article] [PubMed] [Google Scholar]
- 12.Place C, Oddos J, Buc H, McAllister WT, Buckle M. Biochemistry. 1999;38:4948–4957. doi: 10.1021/bi982689e. [DOI] [PubMed] [Google Scholar]
- 13.Liu C, Martin CT. J Biol Chem. 2002;277:2725–2731. doi: 10.1074/jbc.M108856200. [DOI] [PubMed] [Google Scholar]
- 14.Gong P, Esposito EA, III, Martin CT. J Biol Chem. 2004;279:4277–4285. doi: 10.1074/jbc.M409118200. [DOI] [PubMed] [Google Scholar]
- 15.Brieba LG, Sousa R. EMBO J. 2001;20:6826–6835. doi: 10.1093/emboj/20.23.6826. [DOI] [PMC free article] [PubMed] [Google Scholar]
- 16.Guo Q, Sousa R. J Biol Chem. 2005;280:3474–3482. doi: 10.1074/jbc.M412287200. [DOI] [PubMed] [Google Scholar]
- 17.Theis K, Gong P, Martin CT. Biochemistry. 2004;43:12709–12715. doi: 10.1021/bi0486987. [DOI] [PubMed] [Google Scholar]
- 18.Guo Q, Nayak D, Brieba LG, Sousa R. J Mol Biol. 2005;353:256–270. doi: 10.1016/j.jmb.2005.08.016. [DOI] [PubMed] [Google Scholar]
- 19.Bandwar RP, Tang GQ, Patel SS. J Mol Biol. 2006;360:466–483. doi: 10.1016/j.jmb.2006.05.029. [DOI] [PubMed] [Google Scholar]
- 20.He B, Rong M, Lyakhov D, Gartenstein H, Diaz G, Castagna R, McAllister WT, Durbin RK. Protein Expr Purif. 1997;9:142–151. doi: 10.1006/prep.1996.0663. [DOI] [PubMed] [Google Scholar]
- 21.Jia Y, Patel SS. Biochemistry. 1997;36:4223–4232. doi: 10.1021/bi9630467. [DOI] [PubMed] [Google Scholar]
- 22.Cheetham G, Jeruzalmi D, Steitz TA. Nature. 1999;399:80–83. doi: 10.1038/19999. [DOI] [PubMed] [Google Scholar]
- 23.Ma K, Temiakov D, Anikin M, McAllister WT. Proc Natl Acad Sci U S A. 2005;102:17612–17617. doi: 10.1073/pnas.0508865102. [DOI] [PMC free article] [PubMed] [Google Scholar]
- 24.Temiakov D, Anikin M, McAllister WT. J Biol Chem. 2002;277:47035–47043. doi: 10.1074/jbc.M208923200. [DOI] [PubMed] [Google Scholar]
- 25.He B, Rong M, Durbin RK, McAllister WT. J Mol Biol. 1997;265:275–288. doi: 10.1006/jmbi.1996.0741. [DOI] [PubMed] [Google Scholar]
- 26.Muller DK, Martin CT, Coleman JE. Biochemistry. 1988;27:5763–5771. doi: 10.1021/bi00415a055. [DOI] [PubMed] [Google Scholar]
- 27.Sousa R, Patra D, Lafer EM. J Mol Biol. 1992;224:319–334. doi: 10.1016/0022-2836(92)90997-x. [DOI] [PubMed] [Google Scholar]
- 28.Guillerez J, Lopez P, Proux F, Launay H, Dreyfus M. Proc Natl Acad Sci U S A. 2005;102:5958–5963. doi: 10.1073/pnas.0407141102. [DOI] [PMC free article] [PubMed] [Google Scholar]
- 29.Jiang M, Ma N, Vassylyev DG, McAllister WT. Mol Cell. 2004;15:777–778. doi: 10.1016/j.molcel.2004.07.019. [DOI] [PubMed] [Google Scholar]
- 30.Huang J, Sousa R. J Mol Biol. 2000;303:347–358. doi: 10.1006/jmbi.2000.4150. [DOI] [PubMed] [Google Scholar]
- 31.Ma K, Temiakov D, Jiang M, Anikin M, McAllister WT. J Biol Chem. 2002;277:43206–43215. doi: 10.1074/jbc.M206658200. [DOI] [PubMed] [Google Scholar]
- 32.Brieba LG, Gopal V, Sousa R. J Biol Chem. 2001;276:10306–10313. doi: 10.1074/jbc.M009866200. [DOI] [PubMed] [Google Scholar]
- 33.Turingan RS, Theis K, Martin CT. Biochemistry. 2007;46:6165–6168. doi: 10.1021/bi700058b. [DOI] [PMC free article] [PubMed] [Google Scholar]