

Abstract
Before vision, a transient network of recurrently connected cholinergic interneurons, called starburst amacrine cells (SACs), generates spontaneous retinal waves. Despite an absence of robust inhibition, cholinergic retinal waves initiate infrequently and propagate within finite boundaries. Here, we combine a variety of electrophysiological and imaging techniques and computational modeling to elucidate the mechanisms underlying these spatial and temporal properties of waves in developing mouse retina. Waves initiate via rare spontaneous depolarizations of SACs. Waves propagate through recurrent cholinergic connections between SACs and volume release of ACh as demonstrated using paired recordings and a cell-based ACh optical sensor. Perforated-patch recordings and two-photon calcium imaging reveal that individual SACs have slow afterhyperpolarizations that induce SACs to have variable depolarizations during sequential waves. Using a computational model in which the properties of SACs are based on these physiological measurements, we reproduce the slow frequency, speed, and finite size of recorded waves. This study represents a detailed description of the circuit that mediates cholinergic retinal waves and indicates that variability of the interneurons that generate this network activity may be critical for the robustness of waves across different species and stages of development.
Introduction
As neural circuits emerge during development, they exhibit transient features that give rise to periodic correlated activity. In the developing retina, before the development of light responses, a transient circuit gives rise to propagating waves of activity, termed retinal waves (Galli and Maffei, 1988; Meister et al., 1991) (for review, see Blankenship and Feller, 2010; Ford and Feller, 2011). Retinal waves initiate at random points in the retina, propagate ∼100 μm/s, and their spatial extent is defined by finite but shifting boundaries that are dependent upon a local refractory period (Feller et al., 1997). The precise initiation, propagation, and termination properties are proposed to be critical for driving refinement of retinal projections to the brain (Huberman et al., 2008; Xu et al., 2011).
Retinal waves persist for an extended period of development and as retinal circuits change with age, so does the wave generation mechanism. The most well understood wave-generating circuit is based upon cholinergic signaling. Cholinergic retinal waves are mediated by a network of cholinergic amacrine cells called starburst amacrine cells (SACs) (Feller et al., 1996; Zhou, 1998). SACs release both acetylcholine (ACh) and GABA onto neighboring SACs and retinal ganglion cells (RGCs), allowing depolarization to propagate across the retina (Zheng et al., 2004). How does this network comprised of recurrent excitatory connections generate waves with finite boundaries and periodicity of once per minute?
Although several studies have implicated a variety of mechanisms that are involved in the generation of cholinergic waves, a coherent model of wave initiation and propagation does not yet exist. Recent computational models (Godfrey and Swindale, 2007; Hennig et al., 2009; for review, see Godfrey and Eglen, 2009) have made specific predictions on how the properties of SACs underlie the generation of cholinergic waves: (1) waves are initiated by simultaneous spontaneous depolarization of neighboring SACs, (2) waves are propagated via cholinergic connections between SACs, (3) wave boundaries are determined by a slow afterhyperpolarization (sAHP) in SACs (Zheng et al., 2006), and (4) changing wave boundaries are determined by frequent spontaneous depolarizations in SACs. However, these assumptions have not been rigorously tested.
Our goal is to characterize the physiological properties of the SAC network in mouse retina and test the predictions of this model. We use targeted recordings and calcium imaging to characterize intrinsic properties of SACs, including their ability to initiate waves, spontaneous rate of depolarization, and sAHP. We use paired recordings and a cell-based optical assay for release of ACh to gain insights into the connectivity underlying wave propagation. We incorporate these properties into a computational model and compare the results of simulated waves to waves detected with calcium imaging. This combination of methods allows us to test specific and novel hypotheses regarding the relative importance of intrinsic properties, network connectivity, and noise in the generation of spatiotemporal features of retinal waves.
Materials and Methods
Animals.
All experiments were performed on acutely isolated mouse retinas. Male and female C57BL/6 mice obtained from Harlan were used for all WT recordings. Metabotropic glutamate receptor 2 (mGluR2)-GFP mice contain a transgene insertion of interleukin-2 receptor fused GFP under control of the mGluR2 promoter (Watanabe et al., 1998). Choline acetyltransferase (ChAT)-Cre/TdTom mice were generated by crossing a mouse in which an IRES-Cre recombinase is knocked in downstream of the endogenous choline acetyl transferase gene (Ivanova et al., 2010) with a separate tdTomato driver line [B6.129S6-ChATtm1(cre)lowl/J × B6.129S6-Gt(ROSA)26Sortm9(CAG-tdTomato)Hze/J; The Jackson Laboratory]. All animal procedures were approved by the University of California, Berkeley, and conformed to the National Institutes of Health Guide for the Care and Use of Laboratory Animals, the Public Health Service Policy, and the Society for Neuroscience Policy on the Use of Animals in Neuroscience Research.
Whole-mount retinal preparation.
P2–P6 mice were anesthetized with isoflurane and decapitated. Retinas were isolated in cold artificial CSF (ACSF) (in mm: 119 NaCl, 26.2 NaHCO3, 11 glucose, 2.5 KCl, 1 K2HPO4, 2.5 CaCl2, 1.3 MgCl2) and mounted RGC side-up on filter paper. Retinas were incubated at room temperature in oxygenated ACSF until transfer to the recording chamber, where they were continually superfused (1–2 ml/min) with oxygenated ACSF at 30–34°C.
Electrophysiology.
Perforated-patch and whole-cell recordings were made from whole-mount retinas from mice aged P4–P6. Perforated-patch recording were necessary because whole-cell recordings resulted in rundown of the sAHP (Zheng et al., 2006) (data not shown) and ability to initiate waves. The inner limiting membrane was removed using a glass recording pipette and SACs were identified using fluorescence and targeted using a Sutter micromanipulator. Voltage-clamp recordings were sampled at 2.5 kHz and filtered at 1 kHz. Current-clamp recordings were sampled at 5 kHz and filtered at 2 kHz. Analysis was performed using custom MATLAB (MathWorks) scripts. All reported voltages are corrected for liquid junction potential.
To stimulate SACs (see Fig. 2), perforated-patch current-clamp recordings were used. Recording pipettes were front-filled with a potassium chloride internal solution (in mm: 122 KCl, 20 HEPES, 0.5 EGTA, 2 NaCl, pH 7.2; liquid junction potential, 0 mV) and then backfilled with internal solution containing 750 μg/ml Amphotericin B made fresh hourly. Seals were formed, and then access resistance was monitored continuously. Recordings were performed when access resistance was stable and <5% of the input resistance of the cell (typically, Ra, 30–80 MΩ; Rin, 1–2 GΩ). One hundred picoamperes of current was injected for 1.5 s every 60 s for 10 min. Cells were excluded if no calcium transient was observed within the recorded cell or if spontaneous break-in occurred.
Figure 2.

Single SACs can initiate retinal waves. A, Fluorescence image of an mGlur2-GFP retina loaded with calcium indicator OGB-1 AM. Position of recording electrode indicated in red. Scale bar, 50 μm. B, Two examples of current injection experiments in configuration shown in A. Sequence of images are pseudocolored to represent the fractional change in fluorescence (ΔF/F) at each pixel following current injection. Interval between panels is 0.5 s. Int, The interval between current injection and the time of the previous wave. Top, Current injection did evoke a wave. Bottom, Current injection did not evoke a wave. C, Histogram distribution of the intervals between current injection and the time of the previous wave. The black bars are the distribution of all intervals between current injections and the preceding wave. The red bars indicate the subset of current injections that evoked a wave.
Whole-cell recordings from RGCs (see Fig. 4) and paired recordings of SACs were performed (see Fig. 3) using whole-cell voltage-clamp recordings. A cesium-based internal solution (in mm: 110 CsMeSO4, 2.8 NaCl, 4 EGTA, 5 TEA-Cl, 4 adenosine 5′-triphosphate disodium salt, 0.3 guanosine 5′-triphosphate trisodium salt, 20 HEPES and 10 phosphocreatine disodium salt, 0.025 Alexa 568, pH 7.2; liquid junction potential, 10 mV) was used to isolate synaptic conductances. Synaptic blockers used to isolate cholinergic currents are described in Results.
Figure 4.
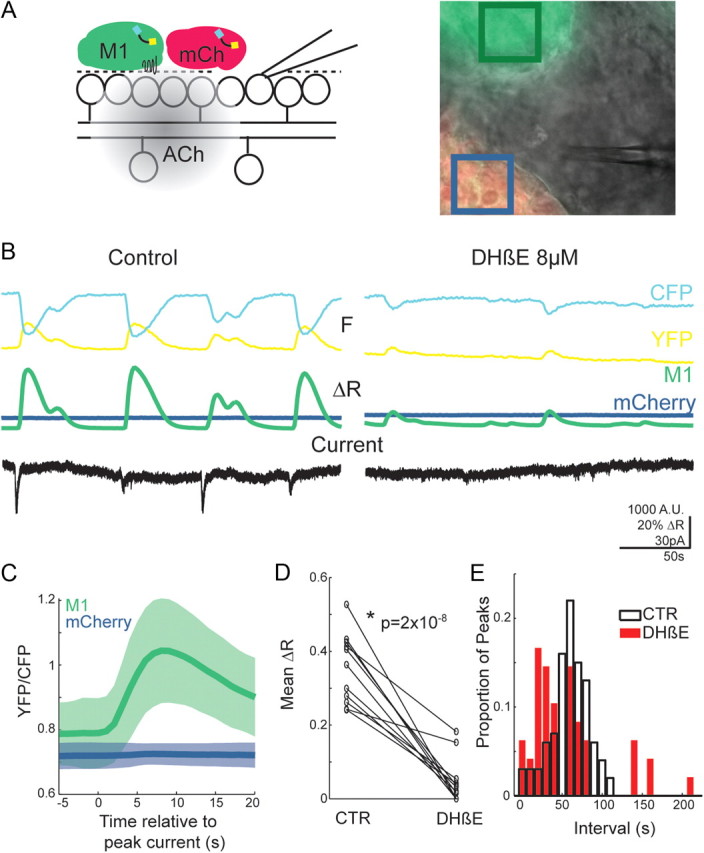
ACh is released diffusely by SACs. A, Inset, Schematic of experimental design. Differential interference contrast (DIC) image of whole-mount retina with fluorescent overlay of M1 and mCherry CNiFERs resting on top of the ILM of a P4 retina. The boxes indicate the region of interest around M1 (green) and mCherry (blue) CNiFERs for traces below. B, YFP and CFP channel fluorescence (M1 only) and YFP/CFP ratio of CNiFERs in control (left) and 8 μm DHβE (right). Voltage-clamp recording (VC = −70 mV) from a nearby RGC (see DIC image) are shown below. C, Wave-triggered average YFP/CFP ratio. FRET ratios for M1 (green) and mCherry (blue) CNiFERs are aligned to the peak inward current during waves as measured from simultaneous voltage-clamp recordings from nearby RGCs. N = 108 waves from 10 retinas (M1) and 46 waves from 5 retinas (mCherry). The shaded region represents mean ± SD. D, Average peak ΔR of CNiFERs FRET transients in control ACSF and during application of 8 μm DHβE. Data from retinas aged P0 to P6 are shown. E, Distribution of interpeak intervals of FRET transients in control (white) and 8 μm DhβE (red). Data from retinas aged P0 to P6 are shown.
Figure 3.

SACs make cholinergic connections with neighboring SACs. A, Live fluorescence image of a SAC–SAC pair filled with Alexa 568. B, Paired recording from two neighboring SACs. Top, Voltage-clamp recording from presynaptic SAC. Bottom, Postsynaptic currents recorded from postsynaptic SAC at five different holding potentials. Voltage command protocols for presynaptic and postsynaptic cells are shown below current traces. C, Current–voltage relationship of the peak current measured in the postsynaptic SAC following step depolarization of the presynaptic SAC. The line represents the average peak current ± SEM for five cell pairs. D, Paired recording showing reciprocal connections. Averaged presynaptic and postsynaptic currents from four repetitions are shown for cells in response to a 50 ms depolarization from −70 to −10 mV. Holding potential is −70 mV. E, Simultaneous voltage-clamp recordings of compound postsynaptic current from two neighboring SACs (Vh = −70 mV). Recording was performed in the presence of GABA receptor antagonists (gabazine, 5 μm; TPMPA, 50 μm; CGP 55845, 2 μm). F, Integrated current during waves recorded from pairs of SACs in control or GABA receptor antagonists. The integrated current during each wave was normalized to the mean integrated current from all waves in a cell (n = 6 pairs). Unity line is shown for clarity.
To characterize the sAHP in SACs (see Fig. 5), perforated-patch voltage- and current-clamp recordings were used. Current-clamp recordings of waves were performed as described above for stimulating SACs. To isolate the sAHP and IsAHP (current underlying sAHP), experiments were performed in the presence of DHβE (4 μm) and gabazine (5 μm), which block nicotinic acetylcholine receptor (nAChR) and GABAA receptor (GABAAR)-mediated synaptic conductances, and tolbutamide (100 μm), to block an ATP-sensitive potassium conductance that develops during prolonged recordings (data not shown). A gluconate-based perforated-patch internal solution was used for voltage-clamp experiments by replacing 116 mm KCl with equimolar K-gluconate (liquid junction potential, 14 mV). To ensure stable recording of IsAHP, access resistance was monitored and recordings were performed when access resistance was stable. Maximum amplitude and kinetics of the slow AHP were not correlated with access resistance.
Figure 5.

SACs exhibit a sAHP. A, Left, Live fluorescence image of an mGluR2-GFP retina. Right, Same retina with SAC targeted for whole-cell recording and filled with Alexa 568. Scale bar, 10 μm. B, Two example current-clamp perforated-patch recording from SACs exhibiting wave-induced depolarizations followed by sAHPs. Top, Each wave evokes spiking activity. Bottom, Waves occurring during sAHP fail to evoke spikes. Inset, Magnified view of calcium spikes during wave-induced depolarization. C, Left, Current-clamp perforated-patch recording showing sAHP following current injection (100 pA for 500 ms). Inset, Calcium spikes during current injection. Calibration: vertical, 10 mV; horizontal, 1 s. D, Voltage-clamp perforated-patch recording from SAC. Average current (black line) ± SD (gray region) measured following depolarization from −64 to −14 mV (n = 32 SACs).
Calcium imaging.
Retinas from mice aged P2–P6 were bulk loaded with the calcium indicator Oregon Green BAPTA-1 AM (OGB-1 AM) using the multicell bolus loading technique (Stosiek et al., 2003; Blankenship et al., 2009). Epifluorescence imaging and analysis were as described previously (Blankenship et al., 2009). Two-photon (see Fig. 6) calcium imaging of mGluR2-GFP retinas was performed using a custom-modified two-photon microscope (Fluoview 300; Olympus America). Focal planes consisting of cell bodies in the ganglion cell layer were used. Time series images were acquired at 1 Hz using a 60× objective (Olympus LUMPlanFl/IR 60×/0.90 W) with the excitation laser tuned to 790 nm. Following acquisition of the calcium signal, the laser was retuned to 920 nm to preferentially excite GFP or TdTomato to allow for identification of SACs in the ganglion cell layer. Images were corrected for motion artifacts and filtered to remove line-scan artifacts. Regions of interest were manually drawn around all cells in the field of view. Fluorescence signals were plotted and peaks were manually identified for all cells. To quantify within-cell variability of peak amplitudes, peak amplitudes from each cell were normalized to the mean peak amplitude for all waves in that cell.
Figure 6.

Two-photon imaging in SACs reveals variable participation in waves. A, Fluorescence images of mGluR2-GFP mice labeled with calcium indicator OGB-1AM. Single two-photon optical section through ganglion cell layer using 790 nm to excite OGB (top) or 920 nm to excite GFP (bottom). Regions of interest are shown around non-SACs (white) and SACs (blue). B, ΔF/F traces from non-SACs (top, black) or SACs (bottom, blue). The dotted lines precede waves for clarity. C, Peak ΔF/F as a function of peak membrane potential recorded in perforated-patch configuration. Each point represents a spontaneous wave or current injection (n = 5 SACs). D, Average of all peak ΔF/F of non-SACs and SACs with somas in the ganglion cell layer (mean ± SD). E, Cumulative probability of within-cell variance of peak ΔF/F for non-SACs and SACs in the ganglion cell layer. F, Amplitude of peak ΔF/F as a function of the preceding peak ΔF/F in non-SACs (black) and SACs (blue) in the ganglion cell layer. Peak amplitudes are normalized to the mean peak amplitude for each cell. N = 1312 calcium transients in 161 SACs and 8686 calcium transients in 961 non-SACs from 11 retinas for C–E.
For simultaneous perforated-patch recording and calcium imaging from P4–P6 mGluR2-GFP retinas (see Fig. 2), waves in the region surrounding the recorded cell were detected by thresholding the derivative of the fluorescence signal of a 200 × 200 μm box region around the cell. Fluorescence changes evoked by current injection were assayed by observing the change in fluorescence in the 2 s following current injection. Waves triggered by the current injection were identified by an increasing spread of calcium signal originating from the site of recording and confirmed by inspecting the original imaging data. One of 12 current injections that evoked a wave occurred on the first current injection (30 s after the start of imaging) and preceded any spontaneous waves in the imaged region; hence, the interval of the preceding wave was unknown but was >30 s. We found that prolonged recordings, despite perforated-patch configuration, resulted in an inability to evoke waves from cells that previously could robustly initiate waves. Therefore, we limited our analysis to the time period before the last evoked wave during the stimulation protocol. Current injections that occurred simultaneously with spontaneous waves were excluded. A total of 24 of 70 current injections met these criteria. Eight of 17 SACs were found to initiate at least one wave. The actual fraction of SACs that can initiate a wave is likely to be higher as our experimental paradigm is subject to rundown.
Analysis of wave front properties (see Figs. 7, 8) was performed using custom scripts in MATLAB, as described previously (Blankenship et al., 2009).
Figure 7.
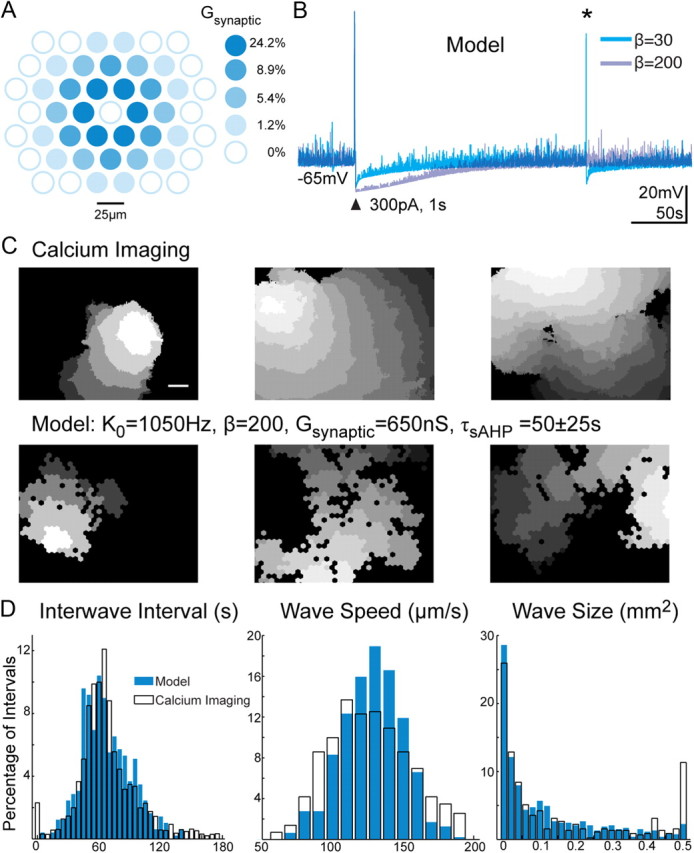
A computational model based on infrequent SAC spontaneous depolarizations recapitulates spatial and temporal properties of retinal waves. A, Schematic of excitatory connections between SACs in the model. The colored circles represent the scale factor that defines the strength of the synaptic connections between neighboring cell and the center cell. Depolarization due to synaptic input is the product of synaptic scale factor, Gsynaptic, and the amount of presynaptic depolarization. B, Membrane potential of modeled SACs in response to current injection (arrowhead). The responses for two values for the slow AHP parameter (β) are shown. For this example, the noise rate constant (K0) was set to 1050 Hz. The asterisk indicates a spontaneous depolarization generated by membrane noise. C, Top, Spatial extent of three experimentally recorded waves. Bottom, Three simulated waves using simulation parameter values as follows: K0, 1050 Hz; β, 200; Gsynaptic, 650 nS; τsAHP, 50 ± 25 s. The gray scale encodes 750 ms intervals between images with lighter shades indicating earlier activity. The black regions were not active. D, Distributions of interwave interval, wave speed, and wave size from calcium imaging (white) and simulated using the Hennig model with parameter values as in C (blue).
Figure 8.

Variability in the slow afterhyperpolarization is necessary to produce physiological waves. Distribution of mean interwave interval (left), wave speed (middle), and wave size (right) as a function of Gsynaptic and β parameters in the Hennig model. For each set of Gsynaptic and β parameters tested, the average interwave interval, wave speed, and wave size was computed. The color axis is centered such that green corresponds to the mean value measured from calcium imaging (Fig. 7D) and the range of color intensities covers 1SD on either side of the mean for interwave interval, wave speed, and size. Saturated blue and red colors indicate values outside of the mean ± 1SD. A, K0 was set to 1050 Hz and each cell in the simulation had a decay constant for the slow AHP drawn from a random Gaussian distribution with a mean of 50 s and SD of 25 s. Values for β and Gsynaptic used in Figure 7, C and D, are shown by red circle (β = 200; Gsynaptic = 650 nS). Eight values each of β and Gsynaptic were tested. B, K0 was set to 1050 Hz and all cells in the simulation had a decay constant for the slow AHP of 50 s. Eight values of β and six values for Gsynaptic were tested. C, Membrane potentials from three neighboring cells showing variable participation during simulated waves using parameter values indicated by the red circle in A. The corresponding τsAHP values are indicated above each trace. D, Summary of variability in local participation during simulated waves for simulation with (top, parameters as indicated by red circle in A) or without (bottom, parameters as indicated by black triangle in B) variability in τsAHP. Number of cells in a neighborhood of seven cells that were coactive within a 750 ms window (left) and peak membrane potential of three neighboring cells during a 750 ms window when at least two cells within the seven cell neighborhood are active (right). Data from six 20 min simulations are shown. E, Histogram distribution of the intervals between simulated current injection (300 pA, 1 s) and the time of the previous wave using parameters indicated by the red circle in B. The black bars are the distribution of all intervals between current injections and the preceding wave. The red bars indicate the subset of current injections that evoked a wave.
Cell-based neurotransmitter fluorescent engineered reporter imaging.
M1 and mCherry cell-based neurotransmitter fluorescent engineered reporters (CNiFERs) were acquired (Nguyen et al., 2010). CNiFERs were maintained in a humidified incubator at 37°C in growth media containing Dulbecco's Minimum Essential Medium (Invitrogen) supplemented with 10% FBS (Invitrogen). Before experiments, CNiFERs were removed from dishes without trypsin and concentrated in growth media. CNiFERs were loaded into a glass capillary with a tip size ∼20 μm. M1 and mCherry CNiFERs were pressure ejected onto the inner limiting membrane (ILM) of retinas and allowed to settle onto the surface. Clusters of several dozen cells were imaged at a focal plane ∼5–10 μm above the ILM. In imaging with simultaneous voltage-clamp recordings, a hole in the ILM was torn usually 50–200 μm from the imaged CNiFERs.
Fluorescence resonance energy transfer (FRET) images were acquired at 1 Hz using a 60× objective. The excitation wavelength was 435 nm. Individual FRET channel detection was accomplished by using a Dual-View image splitter (Optical Insights) with appropriate yellow and cyan channel filters. Images were digitized as during calcium imaging experiments above. Background fluorescence was subtracted from both channels. FRET ratios were computed as background-corrected YFP/CFP fluorescence averaged over a box region of interest around M1 or mCherry CNiFERs. Peaks were detected manually for analysis. For wave-triggered FRET changes, peak wave associated inward currents were detected manually from voltage-clamp recordings and FRET measurements were aligned to the times of each peak current.
Modeling.
C/C++ code for the wave model was acquired as described by Hennig et al. (2009). In this model, the membrane potential of each cell is influenced by a set of conductances. A voltage-gated calcium channel conductance was modeled using a Morris–Lecar model. Calcium influx was proportional to the low-pass-filtered calcium current. The current that gives rise to the sAHP was modeled as a calcium-dependent potassium conductance as follows:
 |
The state of this conductance depends on the calcium concentration and a second slower process s(t), with a slow time constant (τsAHP) and fourth-order dependence on calcium as follows:
The influence of the slow process on the current was weighted with the parameter β. A noise current (In) was implemented as filtered shot noise with a voltage-dependent rate, P(V, λ(t)), that was dependent upon K0 and the voltage-gated calcium channel activation function as follows:
Synaptic conductances were summed from all neighboring cells within a three-cell radius (see Fig. 7). Published parameters were used for the model except as presented in Results. The Hennig model code was modified to output the position and time of active cells (defined by threshold for calcium spike computed from parameter values). Simulations were run for 20 min following a 90 s warm-up period on a 56 × 56 hexagonal lattice of SACs, using the central 50 × 50 for analysis. Spacing between cells was set at 25 μm.
We developed MATLAB/C code to analyze the spatial and temporal aspects of the data generated from the models (see Figs. 7, 8). The set of active cells during 750 ms time steps was recorded, and each cell was either assigned a new wave number or inherited a wave number of neighboring cells. Simulated waves that merged were excluded from analysis for comparison with calcium imaging data. Wave speed was calculated in a manner similar to the calcium imaging analysis, using the last active cell of a wave as the end point of the wave path. All simulations and analysis were performed on an Intel Core i7 desktop running Linux. Simulations of the Hennig model took ∼45 real-time.
Results
Here, we use a variety of methods to characterize the physiological processes of SACs in mouse retina and then incorporate these properties into a computational model with the goal of developing a detailed description of the cellular basis of the spatiotemporal properties of cholinergic retinal waves.
SACs have very low spontaneous depolarization rates
First, we asked how retinal waves are initiated. We performed calcium imaging at single-cell resolution in retinas from mice expressing GFP-tagged IL-2 receptor under control of the mGluR2 promoter (Watanabe et al., 1998; Wang et al., 2007) or ChAT-Cre/TdTom (Ivanova et al., 2010), which selectively label SACs. Retinas from mGluR2-GFP or ChAT-Cre/TdTom mice were bolus-loaded with the calcium indicator Oregon Green BAPTA-1 AM (Stosiek et al., 2003; Blankenship et al., 2009) to compare the frequency of spontaneous depolarization of SACs in the presence and absence of synaptic coupling to other SACs (Fig. 1A). We observed waves as large changes in fluorescence that propagated among nearby neurons. In control solution, correlated spontaneous increases in intracellular calcium concentration ([Ca2+]i) were observed in all SACs (Fig. 1B–D; n = 386 cells in 15 retinas), with very few uncorrelated increases in [Ca2+]i between waves (11 of 2995 calcium transients were not associated with waves). Therefore, SACs rarely exhibit activity during the intervals between waves.
Figure 1.
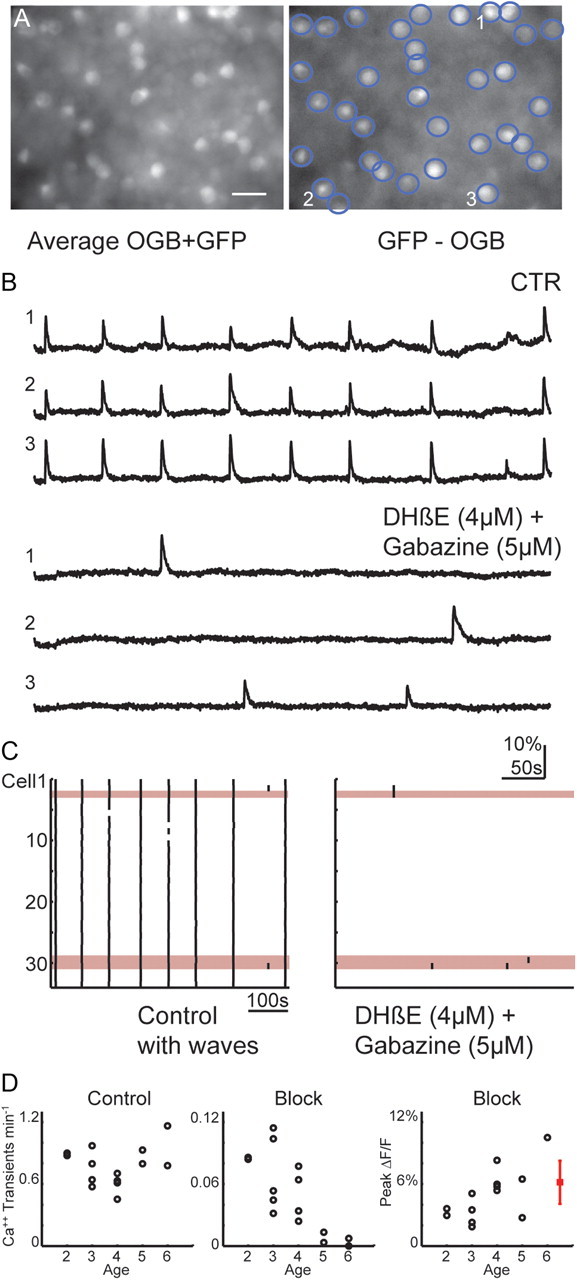
SACs rarely exhibit spontaneous depolarizations. A, Left, Fluorescence image of an mGluR2-GFP retina loaded with OGB using a filter set that allowed for visualization of both OGB and GFP fluorescence. Right, Fluorescence image of GFP+ cells generated by acquiring an image of the same field using a filter set that allowed for visualization of OGB (data not shown) and subtracting it from image shown in A. Regions of interest are shown around each SAC. Scale bar, 20 μm. B, Time course of ΔF/F averaged over the somas of three cells (labeled in A) in the absence (CTR, top) and in the presence of nAChR antagonist DHβE (4 μm) and GABAA receptor antagonist gabazine (5 μm) (bottom). C, Raster plots of calcium transients generated from the thresholded derivatives of the ΔF/F traces. The numbered cells from B are highlighted in red. All 34 cells from A are shown in CTR (left) and DHβE (4 μm) plus gabazine (5 μm) (right). D, Mean number of calcium transients per minute in SACs versus postnatal age for each retina (18–34 SACs per retina) during 10 or 20 min of imaging in control (left) and during blockade of waves using either DHβE (2–8 μm) plus gabazine (5 μm) or DHβE (2–8 μm) alone (middle). Right, Mean peak ΔF/F versus postnatal age during blockade of waves. Mean ± SD of peak ΔF/F evoked by current injection protocol used in Figure 2 are shown in red (n = 4 cells).
To determine the intrinsic rate of depolarization of SACs, we performed similar experiments while blocking waves. When coupling between SACs was blocked using a combination of nAChR and GABAAR antagonists (n = 7) or nAChR antagonists alone (n = 8), SACs rarely exhibited spontaneous calcium transients during a 15–20 min recording period (Fig. 1B–D), in sharp contrast to the observations in rabbit (Zheng et al., 2006). Spontaneous calcium transients were modulated with age: the rate decreased while the amplitude increased (Fig. 1D). The low rate of intrinsic spontaneous depolarization is consistent with the low level of activity between waves. Hence, in mouse retina, SACs spontaneously depolarize at a rate significantly lower than the frequency of waves. These findings indicate that, in contrast to rabbit and predictions from modeling studies, developing mouse retina SACs do not function as strong pacemakers. This critical difference has implications for how retinal waves are initiated, as explored below.
Depolarization of a single SAC can initiate waves
We found that SACs have infrequent spontaneous depolarizations in the absence of synaptic input and rarely depolarize independent of waves. Can these sparse depolarizations initiate waves? Previous models have predicted that SACs are weakly connected, and therefore waves are initiated only when several neighboring SACs are spontaneously active (Hennig et al., 2009). A low rate of spontaneous depolarization implies that the probability that neighboring SACs will spontaneously depolarize simultaneously is exceedingly low.
To determine whether depolarization of a single SAC is sufficient to initiate a wave, we performed targeted recordings from GFP+ neurons in mGluR2-GFP retinas that were bolus-loaded with OGB-1 AM (Fig. 2). In the design of this experiment, it was critical to take into account the existence of a refractory period following depolarization of a cluster of cells during which they cannot participate in subsequent waves. In mice, this refractory period lasts ∼30–50 s (Bansal et al., 2000). Hence, depolarizing current was injected for 1.5 s at 60 s intervals. The amplitude of the current injections induced a fractional change in fluorescence similar to spontaneous calcium transients (Fig. 1D), indicating that they induced depolarizations that were within normal physiological range. The frequency of current injections occurred at a range of intervals following the preceding wave.
Calcium increases were simultaneously monitored in the region surrounding the target cell to detect the initiation of propagating waves. Waves could be evoked by current injection in 8 of 17 of recorded SACs (Fig. 2B). In the SACs in which a single depolarization resulted in the initiation of a wave, successful wave initiations occurred only if the interval between the depolarization and the preceding wave was >40 s (Fig. 2C) (see Materials and Methods). Although these findings do not prove that waves are initiated by depolarization of single SACs, they do indicate that depolarization of single SACs is sufficient to initiate waves when the local region of the retina is in a nonrefractory state.
SACs form excitatory connections with other SACs
The substrate for retinal wave propagation is proposed to be a network of recurrently connected SACs (Zheng et al., 2004). To determine whether SACs form excitatory connections in mouse retina during the period of cholinergic retinal waves, we performed targeted paired whole-cell voltage-clamp recordings (Fig. 3A). To isolate cholinergic synapses between recorded cells, paired recordings were performed in the presence of GABAR blockers [50 μm (1,2,5,6-tetrahydropyridin-4-yl)methyl phosphinic acid (TPMPA), 2 μm (2S)- 3-[[(1S)-1-(3,4-dichlorophenyl)ethyl] amino-2-hydroxypropyl](phenylmethyl)phosphinic acid hydrochloride (CPG 55845), and 5 μm gabazine to block GABAC, GABAB, and GABAA, respectively; n = 6 pairs] or GABAR blockers with ionotropic glutamate receptor blockers (20 μm DNQX and 50 μm AP5 to block AMPA and NMDA receptors; n = 4 pairs). Depolarization of one SAC consistently evoked a PSC in the second SAC (n = 13 of 13). SACs were reciprocally connected in the subset we tested (n = 3 of 3 bidirectional pairs; Fig. 3D), indicating there is a strong connection between SACs. (Note: Presynaptic calcium currents washed out within 5 min following break-in; therefore, we were only able to test for reciprocal connections in a limited number of pairs.) Postsynaptic responses were recorded as a sustained inward current peaking several hundred milliseconds after termination of the presynaptic voltage step (peak amplitude, 25.3 ± 12.7 pA; mean ± SD), similar to responses recorded in rabbit retina (Zheng et al., 2004). Evoked EPSCs reversed near 0 mV (n = 5; Fig. 3C), consistent with them being mediated by nAChRs (Sargent, 1993; Feller et al., 1996). During waves, nearby SACs received periodic simultaneous compound postsynaptic currents (cPSCs) (Vhold = −70 mV; n = 6 pairs; Fig. 3E). cPSCs had slow kinetics, consistent with evoked PSCs measured between SAC–SAC pairs. The amount of inward current during cPSCs varied from wave to wave; however, this variability was highly correlated between neighboring SACs (Fig. 3F; r2 = 0.77; p = 6e−12; n = 6 pairs), implying that neighboring SACs receive highly correlated excitation during waves. These data demonstrate that, in mouse retina, SACs form reciprocal excitatory connections, which can provide a substrate for wave propagation.
ACh is released diffusely during waves
One of the unexplained features of cholinergic retinal waves is the slow postsynaptic currents. Although it has been speculated that ACh released in retina may spill over from the synaptic cleft as it does in central synapses and activate nAChRs on SACs and RGCs throughout the depth of the inner plexiform layer (IPL), this has not been directly demonstrated (for review, see Sarter et al., 2009). To test for diffuse action of ACh, we used CNiFERs (Nguyen et al., 2010), which can detect extracellular ACh within a range of 1–100 nm. CNiFERs are HEK-293 cells that express M1 ACh receptors and the FRET-based calcium indicator TN-XXL (Fig. 4A). Increases in extracellular ACh are reported as increases in FRET ratios resulting from activation of type 1 muscarnic M1 receptors and subsequent release of intracellular calcium stores. To determine whether ACh is released diffusely during waves, we imaged M1-CNiFERs placed on top of the ILM (Fig. 4A,B) to prevent disruption of cholinergic synapses within the IPL. Large spontaneous increases in FRET were observed in all CNiFERs imaged from retinas aged P0–P6 (n = 310 transients from 20 retinas; Fig. 4B). In contrast, no FRET increases were detected in control CNiFERs expressing the fluorescent protein mCherry instead of M1 receptors (n = 11), indicating that the FRET responses were due to ACh activation of M1 receptors and not activation of endogenous receptors on HEK-293 cells. FRET transients were observed with the ILM intact (n = 10 of 10 retinas), ruling out damage to the IPL as a cause for diffuse release of ACh. Simultaneous voltage-clamp recording from nearby RGCs revealed that FRET transients were preceded by large EPSCs associated with waves (n = 10; Fig. 4B,C). Although the time course of FRET signals are much slower than the release of ACh due to signaling cascades that underlie the response, these data demonstrate that ACh released by SACs during waves diffuses far from the site of release.
Our hypothesis is that spontaneous depolarizations in SACs initiate waves due to the release of ACh onto neighboring SACs. To test whether spontaneous depolarizations in the absence of waves cause diffuse release of ACh, we imaged CNiFERs on P0–P6 retinas in the presence of nAChR antagonist, which blocks waves but not CNiFERs since they detect ACh via a muscaric receptor. Remarkably, we observed small FRET transients in CNiFERs in several experiments when waves were blocked (n = 8 of 11 retinas; Fig. 4B,D). Spontaneous FRET transients in wave blockers occurred with an irregular frequency (Fig. 4E) and were not associated with any EPSCs recorded in nearby ganglion cells (n = 5 simultaneous recordings; Fig. 4B). Hence, we conclude that the spontaneous depolarization of SACs results in diffuse release of ACh.
Slow afterhyperpolarization in SACs is highly variable
SACs form a dense mosaic over the entire retina, yet waves have distinct boundaries. These boundaries are determined at least in part by a refractory period, in that waves fail to propagate into regions that have recently participated in a wave (Feller et al., 1996; Butts et al., 1999). It has been proposed that the source of this refractory period is a sAHP in SACs (Zheng et al., 2006). In rabbit retina, after a SAC is depolarized by a wave, it undergoes a hyperpolarization lasting over 15 s, which prevents that SAC from participating in subsequent waves. Computational models then predict that, when nearby SACs are depolarized simultaneously during a wave, there are local regions of the retina in which a large percentage of SACs are hyperpolarized following a wave, which in turn makes that region refractory to subsequent waves. Both experiments (Feller et al., 1997; Stellwagen et al., 1999) and computational models (Butts et al., 1999; Godfrey and Swindale, 2007; Hennig et al., 2009) have demonstrated that manipulating the duration of the refractory period has profound effects on the spatial and temporal properties of waves.
To identify and characterize the conductance underlying the sAHP in mouse SACs, we performed targeted perforated-patch recordings from SACs in retinas acutely isolated from mGluR2-GFP mice (Fig. 5). During waves, SACs exhibit depolarizations (interevent interval, 60 ± 25 s; n = 99 events in 7 cells) similar to the frequency of waves. Many waves (49 of 99) evoked calcium spikes riding on top of a slow graded depolarization, followed by a sAHP that persists for tens of seconds (Fig. 5B), similar to rabbit retina (Zheng et al., 2006). A sAHP was also evoked in response to a current injection in SACs that were synaptically isolated by the presence of nAChR and GABAAR antagonists (4 μm DHβE and 5 μm gabazine, respectively; Fig. 5C; amplitude, 6.0 ± 3.0 mV; rise time, 11.2 ± 2.1 s; time to half-max decay, 22.3 ± 4.3 s; n = 3 cells), indicating it was generated cell-autonomously and not due to network interactions.
To characterize the variability of the conductance underlying the sAHP, we performed voltage-clamp recordings using perforated patch. A step depolarization evoked an outward current (IsAHP) that peaked several seconds after the membrane potential returned to baseline (amplitude, 4.9 ± 1.9 pA; rise time, 13.5 ± 3.7 s; mean ± SD). The IsAHP peak was followed by a slow decay (time to half-max decay, 16.2 ± 7.5 s; n = 32; Fig. 5D), a kinetic profile that closely matched the time course of the sAHP (Fig. 5C). The large variability in peak amplitude and decay was not correlated with differences in access resistance (r2 < 0.02), implying that there is considerable cell-to-cell variability in the current underlying the slow afterhyperpolarization. In many cells, the sAHP lasted >90 s; for example, see Fig. 5B, bottom); hence the sAHP would not completely recover during the interval between waves.
Variable participation of SACs during waves
Our data indicate that waves drive diffuse release of ACh so that neighboring cells receive similar amounts of depolarizing input during waves (Fig. 3). However, we have measured remarkably variable sAHP currents in SACs (Fig. 5). In addition, in several perforated-patch current-clamp recordings (n = 5 of 7 cells), waves that evoked a burst of calcium spikes exhibited a large sAHP and subsequent waves that occurred before complete recovery of the sAHP displayed smaller depolarizations (for example, see Fig. 5B, bottom). To study whether this intrinsic variability in SACs is reflected in the extent of the depolarization of the population of SACs during waves, we turned to two-photon calcium imaging. The strong z-sectioning of two-photon imaging assures that the fluorescence signal comes only from the imaged cells and not from out-of-plane fluorescent cells and processes, thereby giving an accurate representation of depolarization in individual cells during waves (Kerr et al., 2005; Bonifazi et al., 2009).
To record calcium transients in SACs, we loaded retinas of mGlur2-GFP or ChAT-Cre/TdTom mice with OGB-1 AM. An XYZ scan was first performed with the laser tuned to 920 nm to preferentially excite GFP/TdTom and identify displaced SACs (Fig. 6A). Subsequently, with the laser tuned to 790 nm to preferentially excite OGB-1 AM, a single focal plane in the ganglion cell layer was imaged as a function of time with a frame rate of 1 Hz. Amplitudes of calcium transients were correlated with membrane potential in SACs (Fig. 6C; r2 = 0.66; p ≪ 0.0001). Therefore, calcium imaging provides a measure of the membrane potential, allowing us to determine the amount of depolarization each cell experiences during a wave.
Recordings show that the fractional change in fluorescence in non-SACs is mostly uniform from wave to wave, consistent with the low variability in spike count during waves (see supplemental material) (for example, see Stafford et al., 2009) driven by diffuse ACh release. In contrast, the amplitude of the ΔF/F in SACs was significantly variable within the same cell indicating that a given SAC depolarizes by a different extent for each wave (Fig. 6). We hypothesized that variability in calcium transients is inversely correlated with the amplitude of previous waves because large depolarizations will evoke a large sAHP that results in a smaller depolarization during the next wave. To test this hypothesis, we plotted the amplitude of each calcium transient as a function of the amplitude of the preceding calcium transient. We found an inverse relationship for calcium transient amplitudes from SACs but not non-SACs (Fig. 6E; r2SAC = 0.19, p ≪ 0.0001; r2non = 0.001, p = 0.001). Hence, the extent of depolarization of SACs during a wave is influenced by the strength of the previous wave on the timescale of the sAHP.
As an independent measure that this variability in SAC depolarization is history dependent, we computed the average autocorrelation function of peak calcium transients measured at each wave. We found that SACs display a significant dip in the average autocorrelation function, while non-SACs do not, indicating that, on average, calcium transients in SACs are reduced for a period lasting approximately one wave interval following each wave. One explanation for this variability is that there are alternating strong and weak waves. However, we found only a very weak correlation between calcium transient amplitude in each SAC and the average of the three closest SACs (r2 = 0.08), indicating that variability is not correlated between neighboring SACs. Interestingly, we found that SACs within the field of view had different autocorrelation functions that resulted in variability in participation during each wave (see supplemental material). In conclusion, we find that the depolarizing drive of each wave is decorrelated by variability in the SAC network.
Computational model of SACs recapitulates spatial and temporal properties of waves
Thus far, we have characterized the spontaneous initiation rate, synaptic connectivity, and sAHP of SACs. To determine whether these properties are sufficient to describe the propagation properties of retinal waves, we turn to computational modeling. Simulated waves generated by computational models have distributions of interwave intervals, propagation speed, and wave size that are similar to those measured physiologically using calcium imaging (Feller et al., 1997; Godfrey and Swindale, 2007) or multielectrode array recording (Hennig et al., 2009). Most models are based on the premise that waves are initiated by spontaneous depolarizations in SACs, propagate through an interconnected network of SACs, which in turn become refractory to subsequent waves. A key prediction of all of these models is that there is a substantial level of spontaneous activity of SACs between waves that is important in determining the periodicity and finite propagation of retinal waves. Can we compose a model based on our observation that individual SACs have infrequent spontaneous depolarizations that still robustly generate waves?
To devise a computational model that is consistent with our physiological measurements, we start with a recent model that incorporates spontaneous initiation, synaptic connectivity, and a sAHP of SACs (Hennig et al., 2009), which we will refer to as the Hennig model. The Hennig model consists of a homogeneous network of SACs that are more strongly connected to nearby SACs than distant ones. The synaptic input to a SAC is computed by summing the magnitude of neighboring SAC depolarizations above threshold (−60 mV) after weighting each input by a Gaussian distance function (Fig. 7A). This summed input is then scaled by the parameter Gsynaptic to generate an excitatory conductance. In this model, once the SAC has recovered from a sAHP, there is a stochastic depolarization mediated by activation of voltage-gated calcium channels that triggers release of neurotransmitter (Fig. 7B, asterisk). The depolarization of SACs as a function of time is determined by three parameters: (1) the spontaneous opening of voltage-gated calcium channels, which is determined by a Poisson process defined by the noise rate constant (K0); (2) the synaptic inputs from nearby SACs, which are weighted by a set of fixed synaptic strengths (Gsynaptic); and (3) the magnitude of a sAHP (β) (Fig. 7B), which is determined by the amount of time that has passed since the last depolarization relative to the decay constant of the conductance (τsAHP). Motivated by our experimental observation that there is considerable variability in the current underlying the slow AHP (Fig. 5D) and in depolarization of individual SACs in subsequent waves (Fig. 6), we implemented this variability in the model by varying the decay time of the sAHP. Specifically, we randomly assigned each model SAC a slow decay time constant (τsAHP) from a Gaussian distribution with a mean of 50 s and SD of 25 s.
In its original formulation, the Hennig model assumed that the spontaneous depolarization of an isolated starburst amacrine cell was roughly once every 2 min, as determined by recordings from rabbit SACs. To accommodate the significantly lower spontaneous depolarization rate we recorded in mice (Fig. 1), we reduced the value of the noise rate constant K0 from 1400 to 1050 Hz. Using this fixed value of K0, we then varied the value of two parameters, the strength of synaptic input, Gsynaptic, and the magnitude of the sAHP, β, to determine how altering them affects the spatial and temporal properties of simulated retinal waves. We developed analysis to visualize simulated waves and determine spatial and temporal properties. We tested the success of the model by comparing the interwave interval, the wavefront propagation speed, and the wave size of simulated waves with those recorded with calcium imaging (Fig. 7C,D). Note: Simulations modeled only SAC activity, while calcium imaging reflects the activity of ganglion cells, which spatially average the activity of the underlying SAC network (Feller et al., 1997). Hence, waves measured by calcium imaging appear “smoother” compared with simulations (Fig. 7D). However, the basic properties of wave frequency, speed, and size are not altered by ignoring this spatial summation (Godfrey and Swindale, 2007).
Using this modified Hennig model, we found a large range of Gsynaptic and β parameters that produced waves of the same size, speed, and periodicity as measured experimentally (Figs. 7C,D, 8A) as well as reproduced other experimental observations, such as the ability to initiate waves with depolarization of a single SAC (Fig. 8E) and large variability in the local participation of SACs in sequential waves (Fig. 8C,D). Hence, a model constrained by the experimentally measured slow rate of spontaneous depolarization and variability in the sAHP in SACs can recapitulate the spatial and temporal features of waves.
Waves require variability in starburst amacrine cell population
A previous modeling study (Hennig et al., 2009) has shown that variability in the proportion of nonrefractory SACs is necessary to produce waves of finite size. With a high rate of spontaneous depolarization, as in rabbit retina and previous models, this variability is introduced by spontaneous depolarizations and subsequent hyperpolarizations between waves. Here, we have introduced an intrinsic source of variability in the sAHP.
We tested whether variability in the sAHP is necessary to generate waves with finite spatial boundaries and once-per-minute periodicity. We assigned each model SAC a fixed τsAHP of 50 s and varied Gsynaptic and β parameters. With a fixed τsAHP, we were unable to find values for Gsynaptic and β that recapitulated physiological waves for the experimentally determined K0 value (Fig. 8B,D). Increasing Gsynaptic or decreasing β increased wave frequency to match experimental data, but the waves remained large, with each one covering the entire simulated retina. Decreasing Gsynaptic or increasing β elicited the opposite behavior: simulated waves were confined in size to those observed experimentally, but they occurred much less frequently. Hence, for the value of K0 that produces a physiologically realistic rate of spontaneous depolarizations in SACs, there are no values of Gsynaptic and β that recapitulate physiological waves in a network comprising SACs with identical sAHPs. These results indicate that variability within the SAC network is necessary to generate waves with the slow periodicity of once per minute with finite boundaries.
Computational model predicts how manipulation of starburst amacrine cell properties alters the properties of waves
As a final test of the accuracy of the new model, we altered the cellular properties of SACs and tested whether the model accurately predicted the effect of these changes on the spatial and temporal properties of retinal waves. The manipulation we chose was to elevate cAMP either by activating adenylate cyclases or inhibiting phosphodiesterases since this manipulation has been used previously to alter the sAHP in SACs (Zheng et al., 2006) and other neurons (Nicoll, 1988; Vogalis et al., 2002; Lancaster et al., 2006). In addition, elevating cAMP has been shown to alter the spatial and temporal properties of waves (Stellwagen et al., 1999; Stellwagen and Shatz, 2002).
Our experimental data showed that elevating cAMP decreased the magnitude of the current underlying the sAHP (Fig. 9B) and increased the rate of spontaneous depolarizations of SACs (control, 0.05 min−1; forskolin, 0.215 min−1; n = 110 cells in 4 retinas; Fig. 9A). To mimic these effects on the electrophysiological properties of SACs, we reduced the amplitude of the sAHP in the modified Hennig model by decreasing β and increased the rate of spontaneous depolarization in SACs by increasing K0. Using these parameters, simulated waves were more frequent, while there was only a small decrease in wave propagation speeds (Fig. 9C). These effects on spatial and temporal properties of waves were entirely consistent with what was observed with calcium imaging—namely, elevating cAMP dramatically increased the frequency of cholinergic retinal waves (Fig. 9D) and only marginally decreased wave speed. Notably, altering β or K0 alone did not recapitulate these changes in wave properties, indicating that cAMP acting on both of these cellular parameters is responsible for the observed effects. Hence, the model accurately predicts how features of waves are altered by the cellular properties of SACs.
Figure 9.

Model predicts how modulating cellular parameters of SACs alters spatial and temporal properties of waves. A, Left, Raster plot representation of spontaneous calcium transients in the absence of coupling between SACs (left) and in the absence of coupling but with the addition of forskolin (1 μm) (right). The left is reproduced from Figure 1. Right, Distribution of the rate of spontaneous calcium transients in the absence (black) and presence (gray) of forskolin. B, Summary data showing peak currents (IsAHP) measured in perforated patch following step depolarization (500 ms, −64 to −14 mV) for each cell before, during, and after rinse of forskolin (1 μm). Inset, Average current measured (Vh = −64 mV) following depolarization step in control (black) and forskolin (gray). C, Pseudocolor phase plot of how elevating K0 (in hertz) and reducing β parameters to reproduce effects of forskolin affects mean interwave interval (left) and wave speed (right) as a function. Gsynaptic and the decay constant for the sAHP are as in Figure 7, C and D. Five values for K0 and six values for β were tested. The arrow indicates that elevating K0 and reducing β leads to a decrease in interwave interval and little effect on wave speed. D, Summary bar graphs showing comparison of mean interwave interval (left) and mean wave speed (right) in forskolin (1 μm), CPT-cAMP (200 μm), and IBMX (100 μm). Data for each experimental condition are normalized to the control. The number of retinas in each condition is shown at the bottom of each bar.
Discussion
We have presented both novel physiological and modeling data to identify the features of the developing retinal circuit that are critical for generating the observed spatial and temporal properties of retinal waves. Cholinergic retinal waves in mice are initiated by spontaneous depolarizations in SACs that occur at a rate one-tenth the frequency of waves. Spontaneous depolarization of a single SACs causes volume release of ACh, which is sufficient to initiate a wave. The local excitability of SACs, which affects the likelihood of wave initiation or propagation in that region, is governed by the activation of a sAHP. We modified an existing computational model of retinal waves by introducing variability into the duration of sAHPs across the population of SACs, and this crucial modification allowed us to accurately reproduce both the spontaneous activity of isolated SACs and the spatial and temporal features of waves. These results point to the critical role that variability plays in the robust generation of network activity in developing neural circuits.
Below, we discuss the validity of our model assumptions and the implications of its predictions.
Wave initiation dictated by interplay between spontaneous depolarizations and network interactions
How does the intrinsic excitability of individual SACs give rise to the spatial and temporal features of waves? In many oscillatory networks, the intrinsic periodicity of pacemaker neurons embedded in a network strongly sets the frequency of network activation (Bucher et al., 2006; Tohidi and Nadim, 2009). However, this resonance frequency is also influenced by network interactions (Marder and Calabrese, 1996). In addition, there are examples of oscillatory networks in which no pacemakers have been identified, and the oscillations are an emergent property of spontaneous depolarizations, recurrent excitatory connections, and some form of synaptic depression (Tabak et al., 2000; Leznik and Llinás, 2005; Rubin et al., 2009).
Our model assumes that cholinergic waves are initiated by spontaneous activity in single SACs, a claim supported by our observation that depolarization of an individual SAC can initiate a wave (Fig. 2). This assumption is in contrast to previously proposed models for retinal waves in which multiple nearby SACs must be simultaneously active until a “network threshold” is reached (Butts et al., 1999; Godfrey and Swindale, 2007; Hennig et al., 2009). Indeed, a similar model based on a buildup of activity in a cluster of nearby cells has been proposed to describe the initiation of rhythmic activity in the pre-Bötzinger complex, which controls respiratory rhythms (Rubin et al., 2009), as well as in the developing spinal cord (Tabak et al., 2000). Our finding that population activity can be initiated by a single neuron is consistent with recent findings in the hippocampus and cortex (Bonifazi et al., 2009; Li et al., 2009).
Although our model assumes that depolarizations in single SACs initiate waves, we found that, in contrast to observations in rabbit retina, a given SAC in mouse retina has a very low probability of spontaneously depolarizing (Fig. 1). The frequency of wave initiation is limited, but not determined, by the intrinsic pacemaker properties of SACs. In a simple model in which each spontaneous depolarization of a SAC initiates a wave regardless of previous activity, one can compute the minimum frequency of waves given the experimentally measured data (Fig. 1). The observed low rate of spontaneous depolarization would still produce waves that occur much more frequently than observed (∼4–150 waves/min in ∼1 mm2 retina containing ∼1500 SACs). Hence, a balance among three factors determines the frequency of wave initiation: (1) the excitatory effects of spontaneous depolarizations; (2) the excitatory inputs from nearby SACs; and (3) the inhibitory effects of the slow afterhyperpolarizations exhibited by the SACs. The effect of the sAHP on wave initiation is discussed below.
The conductance underlying the spontaneous depolarization of SACs is not yet identified. Spontaneous calcium transients are observed in the presence of fast neurotransmitter receptors blockers (Zheng et al., 2006), suggesting that these depolarizations are intrinsic to SACs. Consistent with this, spontaneous depolarizations have been observed in several types of cultured amacrine cells (Firth and Feller, 2006). Waves are not blocked by voltage-gated sodium channel antagonist (Stellwagen et al., 1999) but are blocked by L-type voltage-gated channel antagonists (Singer et al., 2001). Indeed, L-type calcium channels have been implicated in spontaneous initiation of early network activity in both hippocampus and neocortex (Crépel et al., 2007; Allène et al., 2008).
Wave propagation via diffuse action of ACh
Our model assumes that waves propagate via excitatory connections between SACs. This substrate for propagation was proposed by a computational model (Feller et al., 1997) and evidence for direct synaptic connections between SACs was provided for rabbit retina (Zheng et al., 2004). Here, we confirmed the existence of a recurrent network of SACs in mouse (Fig. 3). In addition, we find that ACh released during waves can be detected several micrometers above the surface of the retina using a cell-based ACh sensor, indicating volume release of ACh during waves.
We postulate volume release of ACh is responsible for wave propagation. First, using paired recordings of SACs, we found that EPSCs last several seconds past the end of the depolarization, indicating they are not mediated by a conventional monosynaptic connection. Second, waves drive correlated calcium transients in ON and OFF ganglion cells (Wong and Oakley, 1996) as well as cells in the inner nuclear layer (Wong et al., 1995). At this age, the processes of SACs in the INL and GCL form two discrete bands (Stacy and Wong, 2003) and therefore do not have direct synaptic connections. Hence, the correlation between ON and OFF ganglion cells, which have processes in distinct layers within the IPL, is evidence of diffuse action of ACh. Indeed, in rabbit retina, there is evidence that ACh released in the inner retina is able to activate muscarinic receptors on cells in the ventricular zone (Syed et al., 2004). Given that later in development, when waves are mediated by a glutamatergic circuit, there is direct evidence that waves are accompanied by volume release of glutamate (Blankenship et al., 2009), these data are consistent with the diffuse action of neurotransmitter as a characteristic feature of developing circuits that exhibit spreading depolarization (Allène et al., 2008).
Wave boundaries are determined by variability in sAHP
We recorded a slow afterhyperpolarization in SACs following either spontaneous or evoked depolarizations (Fig. 5). We propose that the sAHP in SACs serves two functions. First, the sAHP imparts a minimum interval between waves. We show that inhibiting the sAHP by elevating levels of cAMP decreases the interval between waves (Fig. 9). While elevating cAMP both increases the rate of spontaneous depolarization and decreases the amplitude of the sAHP, the latter effect has a stronger impact on interwave interval (Fig. 9). Furthermore, increasing the depolarization rate of a single SAC by current injection only evoked a wave when the interval between the previous wave and current injection was >40 s (Fig. 2), similar to the minimum interval between spontaneous waves, suggesting that an increase in depolarization rate alone does not decrease the minimum interval between waves. These data support the role of the sAHP in setting a minimum interval between waves.
The sAHP also functions to generate variability in wave sizes. The global effect of variability in wave size is reflected in the local variability in refractory state of individual SACs during waves. In previous models (Godfrey and Swindale, 2007; Hennig et al., 2009), randomness in the refractory period was introduced by a high rate of spontaneous activity in SACs that was not correlated with waves. Since this assumption is not consistent with our observation that SACs rarely depolarize independent of waves (Fig. 1), we introduced variability in the form of different duration sAHPs for different SACs. Hence, in our model, individual SACs within a local region will participate in a wave depending upon the extent to which the sAHP has recovered from the previous wave, as was confirmed by two-photon calcium imaging (Fig. 6). The variability of the sAHP makes this refractoriness a dynamic variable, such that every wave activates a different population of SACs, altering the shapes of the refractory regions and thereby altering the boundaries for waves.
Variability within neuronal circuits is thought to be important for neuronal computations. For example, in the olfactory bulb, sister mitral cells innervating the same glomerulus express different levels of voltage-gated ion channels that impart different firing characteristics during stimulus presentation (Padmanabhan and Urban, 2010). This variability reduces redundancy and can provide extra information about stimulus features. Here, variability within the SAC network prevents waves from encompassing the entire retina, thereby broadening the distribution of wave sizes, which may be critical for driving downstream developmental events (Xu et al, 2011). Hence, variability on the properties of SACs serves to robustly generate activity patterns with precise spatial and temporal properties.
Notes
Supplemental material for this article is available at http://mcb.berkeley.edu/labs/feller/Ford_etal.htm. The supplemental material includes supplemental figures (five) and movies (two). This material has not been peer reviewed.
Footnotes
This work was supported by NIH Grant R01 EY013528 (M.B.F.), NSF Grant IOS-0818983 (M.B.F.), NIH Grant F31 NS614663 (K.J.F.). We thank members of the Yang Dan Laboratory for help with establishing methods for perforated-patch recordings. We thank Arnaud Muller and David Kleinfeld (University of California, San Diego) for their generous gift of the M1-CniFERS, and Aaron Blankenship, Justin Elstrott, and Lowry Kirkby for commenting on this manuscript.
References
- Allène C, Cattani A, Ackman JB, Bonifazi P, Aniksztejn L, Ben-Ari Y, Cossart R. Sequential generation of two distinct synapse-driven network patterns in developing neocortex. J Neurosci. 2008;28:12851–12863. doi: 10.1523/JNEUROSCI.3733-08.2008. [DOI] [PMC free article] [PubMed] [Google Scholar]
- Bansal A, Singer JH, Hwang BJ, Xu W, Beaudet A, Feller MB. Mice lacking specific nicotinic acetylcholine receptor subunits exhibit dramatically altered spontaneous activity patterns and reveal a limited role for retinal waves in forming ON and OFF circuits in the inner retina. J Neurosci. 2000;20:7672–7681. doi: 10.1523/JNEUROSCI.20-20-07672.2000. [DOI] [PMC free article] [PubMed] [Google Scholar]
- Blankenship AG, Feller MB. Mechanisms underlying spontaneous patterned activity in developing neural circuits. Nat Rev Neurosci. 2010;11:18–29. doi: 10.1038/nrn2759. [DOI] [PMC free article] [PubMed] [Google Scholar]
- Blankenship AG, Ford KJ, Johnson J, Seal RP, Edwards RH, Copenhagen DR, Feller MB. Synaptic and extrasynaptic factors governing glutamatergic retinal waves. Neuron. 2009;62:230–241. doi: 10.1016/j.neuron.2009.03.015. [DOI] [PMC free article] [PubMed] [Google Scholar]
- Bonifazi P, Goldin M, Picardo MA, Jorquera I, Cattani A, Bianconi G, Represa A, Ben-Ari Y, Cossart R. GABAergic hub neurons orchestrate synchrony in developing hippocampal networks. Science. 2009;326:1419–1424. doi: 10.1126/science.1175509. [DOI] [PubMed] [Google Scholar]
- Bucher D, Taylor AL, Marder E. Central pattern generating neurons simultaneously express fast and slow rhythmic activities in the stomatogastric ganglion. J Neurophysiol. 2006;95:3617–3632. doi: 10.1152/jn.00004.2006. [DOI] [PubMed] [Google Scholar]
- Butts DA, Feller MB, Shatz CJ, Rokhsar DS. Retinal waves are governed by collective network properties. J Neurosci. 1999;19:3580–3593. doi: 10.1523/JNEUROSCI.19-09-03580.1999. [DOI] [PMC free article] [PubMed] [Google Scholar]
- Crépel V, Aronov D, Jorquera I, Represa A, Ben-Ari Y, Cossart R. A parturition-associated nonsynaptic coherent activity pattern in the developing hippocampus. Neuron. 2007;54:105–120. doi: 10.1016/j.neuron.2007.03.007. [DOI] [PubMed] [Google Scholar]
- Feller MB, Wellis DP, Stellwagen D, Werblin FS, Shatz CJ. Requirement for cholinergic synaptic transmission in the propagation of spontaneous retinal waves. Science. 1996;272:1182–1187. doi: 10.1126/science.272.5265.1182. [DOI] [PubMed] [Google Scholar]
- Feller MB, Butts DA, Aaron HL, Rokhsar DS, Shatz CJ. Dynamic processes shape spatiotemporal properties of retinal waves. Neuron. 1997;19:293–306. doi: 10.1016/s0896-6273(00)80940-x. [DOI] [PubMed] [Google Scholar]
- Firth SI, Feller MB. Dissociated GABAergic retinal interneurons exhibit spontaneous increases in intracellular calcium. Vis Neurosci. 2006;23:807–814. doi: 10.1017/S095252380623013X. [DOI] [PubMed] [Google Scholar]
- Ford KJ, Feller MB. Assembly and disassembly of a retinal cholinergic network. Vis Neurosci. 2011 doi: 10.1017/S0952523811000216. [DOI] [PMC free article] [PubMed] [Google Scholar]
- Galli L, Maffei L. Spontaneous impulse activity of rat retinal ganglion cells in prenatal life. Science. 1988;242:90–91. doi: 10.1126/science.3175637. [DOI] [PubMed] [Google Scholar]
- Godfrey KB, Eglen SJ. Theoretical models of spontaneous activity generation and propagation in the developing retina. Mol Biosyst. 2009;5:1527–1535. doi: 10.1039/b907213f. [DOI] [PubMed] [Google Scholar]
- Godfrey KB, Swindale NV. Retinal wave behavior through activity-dependent refractory periods. PLoS Comput Biol. 2007;3:e245. doi: 10.1371/journal.pcbi.0030245. [DOI] [PMC free article] [PubMed] [Google Scholar]
- Hennig MH, Adams C, Willshaw D, Sernagor E. Early-stage waves in the retinal network emerge close to a critical state transition between local and global functional connectivity. J Neurosci. 2009;29:1077–1086. doi: 10.1523/JNEUROSCI.4880-08.2009. [DOI] [PMC free article] [PubMed] [Google Scholar]
- Huberman AD, Feller MB, Chapman B. Mechanisms underlying development of visual maps and receptive fields. Annu Rev Neurosci. 2008;31:479–509. doi: 10.1146/annurev.neuro.31.060407.125533. [DOI] [PMC free article] [PubMed] [Google Scholar]
- Ivanova E, Hwang GS, Pan ZH. Characterization of transgenic mouse lines expressing Cre recombinase in the retina. Neuroscience. 2010;165:233–243. doi: 10.1016/j.neuroscience.2009.10.021. [DOI] [PMC free article] [PubMed] [Google Scholar]
- Kerr JN, Greenberg D, Helmchen F. Imaging input and output of neocortical networks in vivo. Proc Natl Acad Sci U S A. 2005;102:14063–14068. doi: 10.1073/pnas.0506029102. [DOI] [PMC free article] [PubMed] [Google Scholar]
- Lancaster B, Hu H, Gibb B, Storm JF. Kinetics of ion channel modulation by cAMP in rat hippocampal neurones. J Physiol. 2006;576:403–417. doi: 10.1113/jphysiol.2006.115295. [DOI] [PMC free article] [PubMed] [Google Scholar]
- Leznik E, Llinás R. Role of gap junctions in synchronized neuronal oscillations in the inferior olive. J Neurophysiol. 2005;94:2447–2456. doi: 10.1152/jn.00353.2005. [DOI] [PubMed] [Google Scholar]
- Li CY, Poo MM, Dan Y. Burst spiking of a single cortical neuron modifies global brain state. Science. 2009;324:643–646. doi: 10.1126/science.1169957. [DOI] [PMC free article] [PubMed] [Google Scholar]
- Marder E, Calabrese RL. Principles of rhythmic motor pattern generation. Physiol Rev. 1996;76:687–717. doi: 10.1152/physrev.1996.76.3.687. [DOI] [PubMed] [Google Scholar]
- Meister M, Wong RO, Baylor DA, Shatz CJ. Synchronous bursts of action potentials in ganglion cells of the developing mammalian retina. Science. 1991;252:939–943. doi: 10.1126/science.2035024. [DOI] [PubMed] [Google Scholar]
- Nguyen QT, Schroeder LF, Mank M, Muller A, Taylor P, Griesbeck O, Kleinfeld D. An in vivo biosensor for neurotransmitter release and in situ receptor activity. Nat Neurosci. 2010;13:127–132. doi: 10.1038/nn.2469. [DOI] [PMC free article] [PubMed] [Google Scholar]
- Nicoll RA. The coupling of neurotransmitter receptors to ion channels in the brain. Science. 1988;241:545–551. doi: 10.1126/science.2456612. [DOI] [PubMed] [Google Scholar]
- Padmanabhan K, Urban NN. Intrinsic biophysical diversity decorrelates neuronal firing while increasing information content. Nat Neurosci. 2010;13:1276–1282. doi: 10.1038/nn.2630. [DOI] [PMC free article] [PubMed] [Google Scholar]
- Rubin JE, Hayes JA, Mendenhall JL, Del Negro CA. Calcium-activated nonspecific cation current and synaptic depression promote network-dependent burst oscillations. Proc Natl Acad Sci U S A. 2009;106:2939–2944. doi: 10.1073/pnas.0808776106. [DOI] [PMC free article] [PubMed] [Google Scholar]
- Sargent PB. The diversity of neuronal nicotinic acetylcholine receptors. Annu Rev Neurosci. 1993;16:403–443. doi: 10.1146/annurev.ne.16.030193.002155. [DOI] [PubMed] [Google Scholar]
- Sarter M, Parikh V, Howe WM. Phasic acetylcholine release and the volume transmission hypothesis: time to move on. Nat Rev Neurosci. 2009;10:383–390. doi: 10.1038/nm2635. [DOI] [PMC free article] [PubMed] [Google Scholar]
- Singer JH, Mirotznik RR, Feller MB. Potentiation of L-type calcium channels reveals nonsynaptic mechanisms that correlate spontaneous activity in the developing mammalian retina. J Neurosci. 2001;21:8514–8522. doi: 10.1523/JNEUROSCI.21-21-08514.2001. [DOI] [PMC free article] [PubMed] [Google Scholar]
- Stacy RC, Wong RO. Developmental relationship between cholinergic amacrine cell processes and ganglion cell dendrites of the mouse retina. J Comp Neurol. 2003;456:154–166. doi: 10.1002/cne.10509. [DOI] [PubMed] [Google Scholar]
- Stafford BK, Sher A, Litke AM, Feldheim DA. Spatial-temporal patterns of retinal waves underlying activity-dependent refinement of retinofugal projections. Neuron. 2009;64:200–212. doi: 10.1016/j.neuron.2009.09.021. [DOI] [PMC free article] [PubMed] [Google Scholar]
- Stellwagen D, Shatz CJ. An instructive role for retinal waves in the development of retinogeniculate connectivity. Neuron. 2002;33:357–367. doi: 10.1016/s0896-6273(02)00577-9. [DOI] [PubMed] [Google Scholar]
- Stellwagen D, Shatz CJ, Feller MB. Dynamics of retinal waves are controlled by cyclic AMP. Neuron. 1999;24:673–685. doi: 10.1016/s0896-6273(00)81121-6. [DOI] [PubMed] [Google Scholar]
- Stosiek C, Garaschuk O, Holthoff K, Konnerth A. In vivo two-photon calcium imaging of neuronal networks. Proc Natl Acad Sci U S A. 2003;100:7319–7324. doi: 10.1073/pnas.1232232100. [DOI] [PMC free article] [PubMed] [Google Scholar]
- Syed MM, Lee S, He S, Zhou ZJ. Spontaneous waves in the ventricular zone of developing mammalian retina. J Neurophysiol. 2004;91:1999–2009. doi: 10.1152/jn.01129.2003. [DOI] [PubMed] [Google Scholar]
- Tabak J, Senn W, O'Donovan MJ, Rinzel J. Modeling of spontaneous activity in developing spinal cord using activity-dependent depression in an excitatory network. J Neurosci. 2000;20:3041–3056. doi: 10.1523/JNEUROSCI.20-08-03041.2000. [DOI] [PMC free article] [PubMed] [Google Scholar]
- Tohidi V, Nadim F. Membrane resonance in bursting pacemaker neurons of an oscillatory network is correlated with network frequency. J Neurosci. 2009;29:6427–6435. doi: 10.1523/JNEUROSCI.0545-09.2009. [DOI] [PMC free article] [PubMed] [Google Scholar]
- Vogalis F, Harvey JR, Neylon CB, Furness JB. Regulation of K+ channels underlying the slow afterhyperpolarization in enteric afterhyperpolarization-generating myenteric neurons: role of calcium and phosphorylation. Clin Exp Pharmacol Physiol. 2002;29:935–943. doi: 10.1046/j.1440-1681.2002.03755.x. [DOI] [PubMed] [Google Scholar]
- Wang CT, Blankenship AG, Anishchenko A, Elstrott J, Fikhman M, Nakanishi S, Feller MB. GABAA receptor-mediated signaling alters the structure of spontaneous activity in the developing retina. J Neurosci. 2007;27:9130–9140. doi: 10.1523/JNEUROSCI.1293-07.2007. [DOI] [PMC free article] [PubMed] [Google Scholar]
- Watanabe D, Inokawa H, Hashimoto K, Suzuki N, Kano M, Shigemoto R, Hirano T, Toyama K, Kaneko S, Yokoi M, Moriyoshi K, Suzuki M, Kobayashi K, Nagatsu T, Kreitman RJ, Pastan I, Nakanishi S. Ablation of cerebellar Golgi cells disrupts synaptic integration involving GABA inhibition and NMDA receptor activation in motor coordination. Cell. 1998;95:17–27. doi: 10.1016/s0092-8674(00)81779-1. [DOI] [PubMed] [Google Scholar]
- Wong RO, Oakley DM. Changing patterns of spontaneous bursting activity of on and off retinal ganglion cells during development. Neuron. 1996;16:1087–1095. doi: 10.1016/s0896-6273(00)80135-x. [DOI] [PubMed] [Google Scholar]
- Wong RO, Chernjavsky A, Smith SJ, Shatz CJ. Early functional neural networks in the developing retina. Nature. 1995;374:716–718. doi: 10.1038/374716a0. [DOI] [PubMed] [Google Scholar]
- Xu HP, Furman M, Mineur YS, Chen H, King SL, Zenisek D, Zhou ZJ, Butts DA, Tian N, Picciotto MR, Crair MC. An instructive role for patterned spontaneous retinal activity in mouse visual map development. Neuron. 2011;70:1115–1127. doi: 10.1016/j.neuron.2011.04.028. [DOI] [PMC free article] [PubMed] [Google Scholar]
- Zheng J, Lee S, Zhou ZJ. A transient network of intrinsically bursting starburst cells underlies the generation of retinal waves. Nat Neurosci. 2006;9:363–371. doi: 10.1038/nn1644. [DOI] [PubMed] [Google Scholar]
- Zheng JJ, Lee S, Zhou ZJ. A developmental switch in the excitability and function of the starburst network in the mammalian retina. Neuron. 2004;44:851–864. doi: 10.1016/j.neuron.2004.11.015. [DOI] [PubMed] [Google Scholar]
- Zhou ZJ. Direct participation of starburst amacrine cells in spontaneous rhythmic activities in the developing mammalian retina. J Neurosci. 1998;18:4155–4165. doi: 10.1523/JNEUROSCI.18-11-04155.1998. [DOI] [PMC free article] [PubMed] [Google Scholar]