Abstract
Conventional (whole body) CYP2E1 knockout mice displayed protection against high-fat diet-induced weight gain, obesity, and hyperlipidemia with increased energy expenditure despite normal food intake and spontaneous locomotor activity. In addition, the CYP2E1 knockout mice displayed a marked improvement in glucose tolerance on both normal chow and high-fat diets. Euglycemic-hyperinsulinemic clamps demonstrated a marked protection against high-fat diet-induced insulin resistance in CYP2E1 knockout mice, with enhanced adipose tissue glucose uptake and insulin suppression of hepatic glucose output. In parallel, adipose tissue was protected against high-fat diet-induced proinflammatory cytokine production. Taken together, these data demonstrate that the CYP2E1 deletion protects mice against high-fat diet-induced insulin resistance with improved glucose homeostasis in vivo.
Keywords: energy expenditure
the cytochromes p-450 (CYP) represent a superfamily of hemoproteins that mediate the biotransformation of endogenous and exogenous compounds. The isoform E1 of the CYP2 subfamily (CYP2E1) is the only member in humans, rats, and mice that catalyzes the bioactivation of several procarcinogens and protoxins and participates in drug metabolism (4, 11). In addition to its ability to oxidize a variety of xenobiotic compounds, CYP2E1 is involved in the oxidation of several endogenous fatty acids, particularly hydroxylation of saturated fatty acids and epoxidation of unsaturated fatty acids (10, 20, 26, 28). In addition, CYP2E1 activity results in the generation of reactive oxygen species (ROS) through the reduction of molecular oxygen to water by NADH- and NADPH-dependent processes, and overexpression of CYP2E1 in vivo induces several markers of oxidative stress (6, 31, 38).
Increased oxidative stress has also been implicated as a causative factor for insulin resistance, and multiple studies show increased levels of oxidative stress markers in diabetes and related conditions (3). In diabetes, increased flux of free fatty acids and glucose is associated with an elevation of mitochondrial reactive oxygen species (ROS) and consequent increased oxidative stress (29). Increased mitochondrial oxidative stress is associated with increased CYP2E1 levels in diabetic rats (27) and diabetic patients (33, 37). Adipocytes exposed to prolonged oxidative stress impair insulin signaling to glucose uptake, and in hepatocytes, CYP2E1 induction of oxidative stress impairs insulin signaling to IRS-1, IRS-2, PI 3-kinase, and Akt/PKB, while reciprocally, stimulation of insulin signaling acts as a survival pathway against CYP2E1-dependent toxicity (3–5, 17, 18, 32). However, since transgenic overexpression of CYP2E1 could result in nonphysiological induction of ROS and impairment of insulin signaling, CYP2E1-deficient mice were used to determine the role of this enzyme in the pathogenesis of insulin resistance and diabetes. Our data demonstrate that CYP2E1 knockout (CYP2E1KO) mice are more insulin sensitive and protected from high-fat diet-induced obesity and glucose intolerance.
EXPERIMENTAL PROCEDURES
Materials.
p-Ser473 and total Akt antibodies were obtained from Cell Signaling Technology (Danvers, MA). Fatty acid synthase (FAS) antibody was obtained from BD Biosciences (San Diego, CA). Oil red O staining kit was obtained from Electron Microscopy Sciences (Hatfield, PA).
CYP2E1KO mice.
CYP2E1KO mice (Cyp2e1-null) on the SV/129 background were kindly provided by Dr. Frank J. Gonzalez at the National Cancer Institute (22), and SV/129 wild-type (WT) mice were purchased from The Jackson Laboratory (Bar Harbor, ME). CYP2E1KO mice and WT controls were fed either a normal chow diet (NCD, 12% kcal from fat) or a high-fat diet (HFD, 60% kcal from fat), for 8–12 wk. All mice were maintained on a 12:12-h light-dark cycle with free access to food and water, and protocols were performed in accordance with and approved by the Albert Einstein College of Medicine Institutional Animal Care and Use Committee.
Intraperitoneal glucose tolerance tests.
Glucose tolerance was determined in WT and CYP2E1KO mice following 5 h of fasting by an intraperitoneal injection of d-glucose (1 g/kg ip). Blood samples were drawn at 0, 15, 30, 60, and 120 min after injection for the determination of blood glucose (Precision Xtra; Abbot, Bedford, MA).
Euglycemic-hyperinsulinemic clamps.
WT and CYP2E1KO mice were fed a HFD for 12 wk. The mice were then fasted for 5 h, and euglycemic-hyperinsulinemic (EU) clamps were conducted in conscious mice as previously described (2, 43), with minor modification. The 2-h EU clamp was conducted with a continuous infusion of human insulin (2.5 mU·kg−1·min−1) and a variable infusion of 25% glucose to maintain glucose at ∼150 mg/dl. Insulin-stimulated whole body glucose metabolism was estimated using continuous infusion of [3-3H]glucose (0.1 μCi/min; PerkinElmer Life Sciences). To determine the rate of basal glucose turnover, [3-3H]glucose (0.05 μCi/min) was infused for 2 h (basal period) with a 5-μCi bolus before starting the EU clamp, and a blood sample was taken at the end of this basal period. To assess insulin-stimulated tissue-specific glucose uptake, 2-deoxy-d-[1-14C]glucose (2-[14C]DG) (PerkinElmer Life Sciences) was administered as a bolus (10 μCi) 75 min after the start of the clamp. Blood samples were taken at 0 min and every 10 min from 80 to 120 min through the carotid artery. To estimate basal muscle glucose uptake, 2-[14C]DG glucose was infused with isotonic saline. During the clamp, plasma glucose was monitored using 2 μl of blood with a glucose meter (Precision Xtra). Plasma [3-3H]glucose and 2-[14C]DG and 3H2O concentrations were measured as described previously (43, 44). After the EU clamp, individual tissue samples were collected and immediately frozen at −80°C for the measurement of glucose uptake, hepatic glucose production, and liver glycogen synthesis.
Physiological parameters.
Body composition parameters that included total body weight, total water, and lean and fat mass were determined by quantitative nuclear magnetic resonance noninvasive imaging as described previously (44). Spontaneous locomotor activity, energy expenditure, oxygen consumption (V̇o2) and carbon dioxide production (V̇co2) were determined by indirect calorimetry (Columbus Instruments, Oxymax system) as described previously (44).
Plasma lipids and cytokines.
Blood was collected from mice after a 14-h fast, and plasma triglyceride (TG), nonesterified free fatty acids (NEFA), tumor necrosis factor-α (TNFα) and interleukin-6 (IL-6) were determined using commercial kits per the manufacturer's instruction. TG and NFFA assay kits were obtained from Wako Chemicals USA (Richmond, VA) and Thermo Fisher Scientific (New York, NY), respectively. Plasma TNFα and IL-6 were measured with an ELISA kit (R&D Systems, Minneapolis, MN).
Statistical analysis.
Results are presented as means ± SE, and statistical significance was determined using an unpaired, one-tailed Student's t-test, with P < 0.05 considered significant.
RESULTS
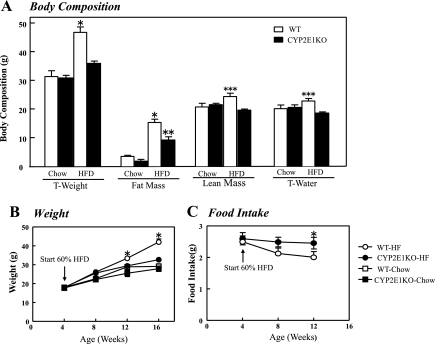
To examine the physiological consequences of CYP2E1 deficiency, we examine the overall body composition of WT and CYP2E1KO mice maintained on a normal chow (NCD) or HFD diet. WT mice gained ∼18 g of additional weight when maintained on a HFD for 12 wk compared with NCD fed mice (Fig. 1A). In contrast, when kept on NCD, CYP2E1KO mice had same weight as WT mice but were markedly resistant to weight gain when placed on the HFD and gained only ∼4 g of body mass. The time-dependent weight gain over a 16-wk period is shown in Fig. 1B. Body composition analysis showed that the increase in weight of the WT mice was primarily due to an increase in adipose tissue mass, with only small changes in lean mass and total body water content (Fig. 1A). The relative protection of CYP2E1KO mice from HFD-induced weight gain was not a result of decreased food intake, as the CYP2E1KO mice trended to eat more than the WT mice (Fig. 1C).
Fig. 1.
Cytochrome P-450 CYP2E1 knockout (CYP2E1KO) mice are protected against high-fat diet (HFD)-induced obesity. WT and CYP2E1KO male mice at 4 wk of age were placed on a normal chow diet (NCD, Chow) or HFD for 4–16 wk. A: body composition, including total weight (T-weight), fat mass, lean mass, and total body water (T-water), was determined by quantitative NMR after 8 wk on NCD or HFD (WT, □, CYP2E1KO, ■). B: time-dependent weight gain in mice maintained on NCD and HFD. C: average food intake on HFD were determined for WT and CYP2E1KO mice. Results represent means ± SE of data from 3–8 mice per group. *P < 0.05, WT-HFD vs.other 3 groups; **P < 0.05, CYP2E1KO-HFD vs.o both NCD groups; ***P < 0.05, WT-HFD vs. CYP2E1KO-HFD.
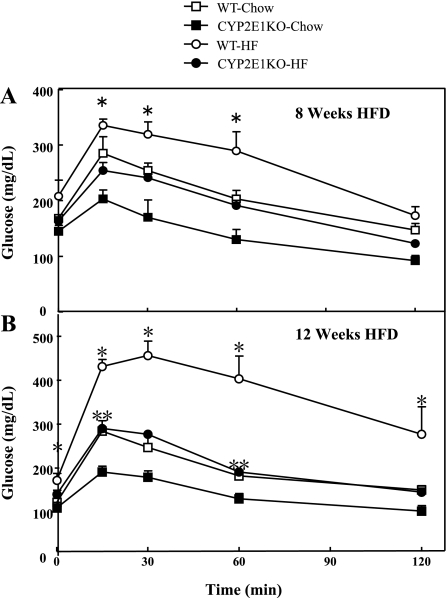
As typically observed following 8 wk of HFD, WT mice displayed glucose intolerance compared with NCD-fed WT mice (Fig. 2A). In contrast, CYP2E1KO mice were substantially protected against HFD-induced glucose intolerance. Moreover, following 12 wk on the HFD, the CYP2E1KO mice displayed a similar glucose tolerance to the NCD WT mice such that they were both markedly improved compared with the WT mice on the HFD (Fig. 2B). In addition, the CYP2E1KO mice on the NCD showed a significantly improved glucose tolerance over the WT mice, indicating protection from age-induced glucose intolerance. The differences in glucose tolerance correlated with improved plasma lipid profile, reduced TG, and free fatty acids in the CYP2E1KO mice compared with WT mice on both the NCD and HFD (Fig. 3, A and B).
Fig. 2.
CYP2E1KO mice have improved glucose tolerance compared with WT mice on HFD. Four-week-old WT and CYP2E1KO male mice were fed for 8 wk (A) or 12 wk (B) with NCD or HFD. After a 5-h overnight fast, mice were given an injection (1 g/kg ip) of d-glucose in saline. Blood glucose levels were measured by glucometer after 0, 15, 30, 60, and 120 min. Results represent means ± SE of data from 4–6 mice per group. *P < 0.05, WT-HFD vs. other 3 group; **P < 0.05, CYP2E1KO-HFD vs. both NCD groups.
Fig. 3.
CYP2E1KO mice are protected against HFD-induced hyperlipidemia. Four-week-old WT (open bars) and CYP2E1KO mice (filled bars) were maintained on NCD or HFD for 12 wk. Blood was then collected following a 14-h fast, and plasma levels of triglycerides (TG; A) and free fatty acids (FFA; B) were determined as indicated under experimental procedures. Results represent means ± SE of data from 5 mice per group. *P < 0.05.
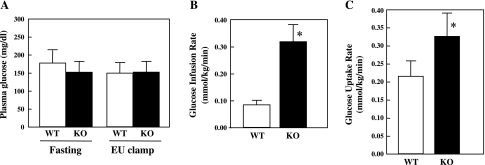
To determine whether the improved glucose tolerance was due to protection against insulin resistance, we next performed EU clamps on WT and CYP2E1KO mice maintained on a HFD for 12 wk (Fig. 4). WT mice displayed higher fasting glucose levels than the CYP2E1KO mice where both were clamped at ∼150 mg/dl at steady state during the EU clamp (Fig. 4A). The glucose infusion rate was approximately three times higher for the CYP2E1KO mice with increased glucose uptake compared with the WT mice (Fig. 4, B and C). Since typically WT mice on a chow diet have a glucose infusion rate of 0.30 mmol·kg−1·min−1, similar to the CYP2E1KO mice on a HFD, these data indicate that the CYP2E1KO mice were substantially protected against HFD-induced insulin resistance.
Fig. 4.
CYP2E1KO mice are protected against HFD-induced insulin resistance. WT and CYP2E1KO mice were maintained on HFD for 12 wk and then subjected to euglycemic-hyperinsulinemic (EU) clamps. A: plasma glucose during basal and last 30 min of EU clamps (2.5 mU·kg−1·min−1 insulin infusion with glucose level maintained at ∼150 mg/dl) for the WT (□) and CYP2E1KO (KO, ■) mice. B: glucose infusion rate (GIR) necessary to maintain euglycemia. C: whole body glucose uptake was determined as [3-3H]glucose specific activity tracer infusion rate during EU clamp. Data represent means ± SE from 4–5 individual mice per group. *P < 0.05.
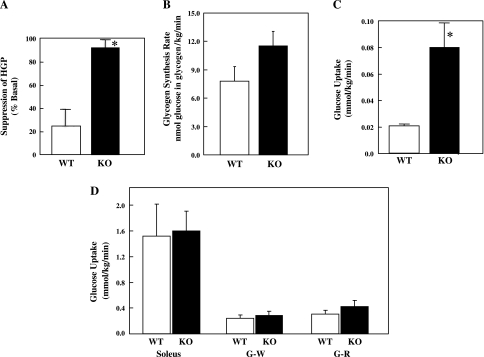
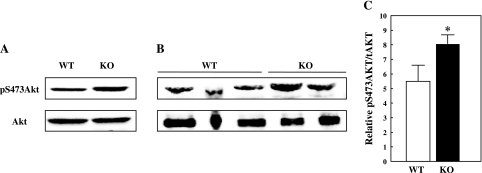
To identify the peripheral tissues responsible for the increased insulin sensitivity of the CYP2E1KO on a HFD, we determined the insulin suppression of hepatic glucose output and adipose tissue and muscle glucose uptake (Fig. 5). Insulin was able to suppress hepatic glucose production in the HFD CYP2E1KO mice ∼80%, whereas insulin was able to suppress hepatic glucose production only ∼25% in HFD WT mice (Fig. 5A). In parallel, insulin appeared to increase the rate of liver glycogen synthesis in the HFD CYP2E1KO compared with HFD WT mice, although the difference did not reach statistical significance (Fig. 5B). In addition, there was a fourfold increase in insulin-stimulated glucose uptake in adipose tissue of the CYP2E1KO mice compared with WT (Fig. 5C). Surprisingly, however, there was no significant difference in skeletal muscle glucose uptake in soleus, white gastrocnemius, or red gastrocnemius muscles (Fig. 5D). In any case, the increased insulin sensitivity in liver tissue directly correlated with a greater extent of Akt phosphorylation on Ser473 at the end of the EU clamp (insulin-stimulated) in the CYP2E1KO mice compared with WT mice (Fig. 6).
Fig. 5.
CYP2E1KO mice on HFD display improved insulin suppression of hepatic glucose output and insulin-stimulated adipose tissue glucose uptake (HGP). WT and CYP2E1KO mice were maintained on HFD for 12 wk and then subjected to EU clamps. A: insulin suppression of HGP was determined during EU clamp by [3-3H]glucose infusion. B: insulin-stimulated glycogen synthesis was determined by the amount of [3-3H]glucose incorporate into liver glycogen. Insulin-stimulated glucose uptake into epididymal adipose tissue (C) and soleus, gastrocnemius white (G-W), and gastrocnemius red (G-R) skeletal muscle fibers (D) was determined by 2-deoxy-d-[1-14C]glucose injection during the last 35 min of the EU Clamp. Data represent means ± SE from 4–5 individual mice per group. *P < 0.05.
Fig. 6.
CYP2E1KO mice on HFD display improved insulin-stimulated Akt phosphorylation in liver. WT and CYP2E1KO mice were maintained on HFD for 12 wk and then subjected to EU clamps. At the end of the clamp, liver tissue was frozen, extracts were prepared, and protein was subjected to phospho-Ser473 Akt (pS473Akt) and total (t)Akt immunoblots. Immunoblots of liver extracts from 1 WT and 1 CYP2E1KO mouse (A) and extracts from 3 WT and 2 CYP2E1KO mice (B). C: quantification of insulin-stimulated pSer473 Akt/total Akt levels. Data represent means ± SE from 4–5 individual mice per group. *P < 0.05.
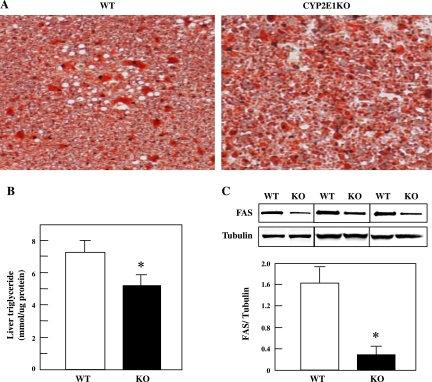
Typically, under HFD conditions, mice develop a fatty liver due to increased dietary fatty acid intake and through enhanced de novo lipogenesis. Since the liver of the CYP2E1KO mice on a HFD displayed apparently normal insulin sensitivity in terms of suppression of gluconeogenesis, we next examined the lipid accumulation in the liver with Oil Red O staining (Fig. 7A). Quantification of liver TG content confirmed the decrease in the CYP2E1KO compared with WT mice (Fig. 7B). In parallel, protein levels of FAS in HFD-fed CYP2E1KO mice was substantially reduced compared with the HFD-fed WT mice (Fig. 7C).
Fig. 7.
CYP2E1KO mice are protected against HFD-induced steatosis. Four-week-old WT and CYP2E1KO mice were maintained on HFD for 12 wk. A: liver sections were prepared and stained with Oil Red O for neutral lipids. B and C: liver triglyceride levels and fatty acid synthase (FAS) protein levels, respectively, were determined as described under experimental procedures. Data represent means ± SE from 4–5 individual mice per group. *P < 0.05. C, inset: 3 representative FAS- and tubulin-loading control immunoblots from WT and CYP2E1KO mouse livers.
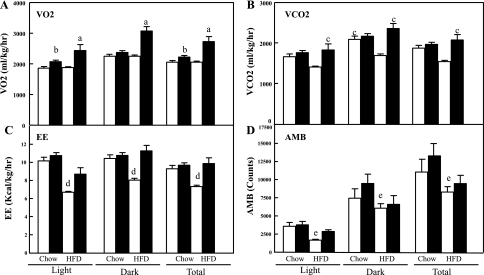
The protection from HFD-induced glucose intolerance, hyperlipidemia, liver steatosis, and adipose mass accumulation despite normal caloric intake in the CYP2E1KO mice suggested that these mice might have had altered energy expenditure. To address this issue, indirect calorimetry was performed in WT and CYP2E1KO mice. In both the light and the dark cycles, the HFD-fed CYP2E1KO mice displayed increased V̇o2, resulting in a net 24-h increase compared with HFD WT mice (Fig. 8A). Similarly, the HFD-fed CYP2E1KO mice had increased V̇co2 compared with HFD-fed WT mice (Fig. 8B), which resulted in an overall increase in energy expenditure (Fig. 8C). As expected, HFD mice displayed reduced spontaneous locomotor activity, but there was no difference between the WT and CYP2E1KO mice under either dietary regimen (Fig. 8D). Moreover, HFD is well established to induce adipose tissue inflammation and increased in plasma proinflammatory cytokine levels (16, 25, 36). As expected, HFD WT mice displayed increased plasma levels of TNFα compared with NCD mice (Fig. 9A); however, plasma TNFα levels were reduced in the CYP2E1KO mice. There was no significant difference in plasma IL-6 levels between WT or CYP2E1KO mice on both NCD and HFD (Fig. 9B). This is consistent with previous studies, demonstrating that plasma IL-6 levels are not significantly affected by HFD (8). Thus, since TNFα levels did not increase during the HFD, the CYP2E1KO mice also appear refractory to HFD-induced inflammation.
Fig. 8.
CYP2E1KO mice display enhanced energy expenditure (EE). Four-week-old WT (open bars) and CYP2E1KO mice (filled bars) were fed NDC or HFD for 8 wk. Mice were placed in an Oxymax open-circuit indirect calorimetry system over a 6-day period while being maintained on their same respective diets. Average V̇o2 (in ml·kg−1·h−1; A), V̇co2 (in ml·kg−1·h−1; B), EE (in kcal·kg−1·h−1; C), and spontaneous locomoter activity (AMB; D) were determined. Data represent means ± SE from 3–5 mice per group. aP < 0.05 for CYP2E1KO mice on HFD vs. the other 3 groups; bP < 0.05 for CYP2E1KO mice on NCD vs. the other 3 groups; cP < 0.05 for CYP2E1KO mice on HFD vs. WT on HFD; dP < 0.05 for WT mice on HFD vs. the other 3 groups; eP < 0.05 for WT mice on HFD vs. WT and CYP2E1KO mice on NCD.
Fig. 9.
CYP2E1KO mice are protected against HFD-induced expression of proinflammatory cytokines. Four-week-old WT (open bars) and CYP2E1KO mice (filled bars) were maintained on NCD or HFD for 12 wk. Blood was collected following a 14-h fast, and plasma levels of TNFα (A) and IL-6 (B) levels were determined as described under experimental procedures. Data represent means ± SE from 5 mice per group. *P < 0.05 WT-HFD vs. CYP2E1KO-HFD mice.
DISCUSSION
Previous studies have strongly implicated oxidative stress in the development of insulin resistance through multiple mechanisms, including induction of mitochondrial dysfunction, endoplasmic reticulum stress, inflammation, and induction of a variety of feedback insulin signaling inhibitor pathways (23, 24, 35). The physiological manifestations of insulin resistance typically result in increased hepatic glucose production and lipogenesis accompanied by decreased peripheral (skeletal muscle and adipose tissue) glucose uptake (14, 15, 21, 34). In the toxicology literature, CYP2E1 is well established as a major contributor to the production of ROS, and transgenic overexpression of CYP2E1 in mice increases oxidative stress in liver and cardiomyocytes (42). Although most cytochrome P-450 proteins are predominantly expressed in the liver, CYP2E1 has a broad tissue distribution, being highly expressed in the liver but also in many cell types throughout the body (30, 40).
Consistent with previous studies examining CYP2E1-overexpressing transgenic mice, our data on the CYP2E1KO mice demonstrate the presence of an opposite phenotype. For example, liver overexpressing transgenic CYP2E1 mice had increased plasma lipid levels, decreased glucose tolerance, and increased liver steatosis (18, 32), whereas the data present in this paper demonstrate that the conventional (whole body) CYP2E1KO mice have reduced plasma lipid levels, increased glucose tolerance, and protection against HFD-induced insulin resistance with increased energy expenditure. This was not due to any change in either food intake or spontaneous locomotor activity and thus represents some intrinsic change in insulin sensitivity and energy expenditure. Since the mice are conventional CYP2E1 knockouts, these studies were not able to distinguish between tissue-specific effects of CYP2E1. However, the CYP2E1KO mice displayed substantial protection against HFD-induced hepatic insulin resistance and insulin-stimulated adipose tissue glucose uptake. Surprisingly, there was no apparent increase in skeletal muscle (red or white) insulin sensitivity in the CYP2E1KO mice, suggesting that the increase in energy expenditure is skeletal muscle independent. Whether the peripheral effect on adipose tissue and liver is directly due to CYP2E1 deficiency or secondary to the improvement in liver insulin sensitivity remains to be determined. Nevertheless, taken together, these data provide evidence that CYP2E1 is a negative regulator of glucose and energy metabolism and that reduction of CYP2E1 can enhance these metabolic parameters.
In this regard, CYP2E1 expression is induced by a variety of endogenous and exogenous compounds, including ethanol, acetone, and other low-molecular-weight substrates and by HFD and insulin-deficient diabetes (1, 9, 12, 13, 39). Currently, there are ∼50 substrates that are metabolized by CYP2E1 with diverse structures, with most being small lipid-soluble molecules (13, 19). In particular, CYP2E1 is the predominant enzyme metabolizing acetaminophen (Tylenol) to N-acetyl-p-benzoquinone, which is thought to be the active metabolite responsible for liver toxicity (7). For example, WT mice exhibit liver toxicity and mortality at 400 mg/kg acetaminophen, whereas the CYP2E1KO mice are resistant to doses up to three times higher (41). On the basis of the observation that the CYP2E1KO mice are protected against HFD-induced obesity, an intriguing possibility is that long-term acetaminophen dosing could provide sufficient ROS to induce whole body insulin resistance and obesity. Future studies are needed to address this issue and whether other CYP2E1 substrates will have the same metabolic inhibitory effects. Finally, these studies suggest that inhibitors of CYP2E1 could be potential drugs for treatment of type 2 diabetes and obesity. Since the CYP2E1KO mice are otherwise normal, adverse events from chronic administration of a CYP2E1 inhibitor would not be expected.
GRANTS
This work has been supported in part by grants from the L.R. Diamond Fund, The Myra Rlenhardt Diabetes Research Fund, the Public Committee for Allocation of Estate Funds, Ministry of Justice, Israel, and grant numbers DK-082694 and DK-020541 from National Institute of Diabetes and Digestive and Kidney Diseases.
DISCLOSURES
No conflicts of interest, financial or otherwise, are declared by the author(s).
AUTHOR CONTRIBUTIONS
Author contributions: H.Z., M.A., C.H., E.K., and J.E.P. conception and design of research; H.Z., M.A., and C.H. performed experiments; H.Z. and M.A. analyzed data; H.Z., M.A., E.K., and J.E.P. interpreted results of experiments; H.Z. prepared figures; H.Z., M.A., and J.E.P. drafted manuscript; H.Z., M.A., E.K., and J.E.P. edited and revised manuscript; H.Z., M.A., C.H., E.K., and J.E.P. approved final version of manuscript.
ACKNOWLEDGMENTS
We thank Dr. Frank J. Gonzalez at the National Cancer Institute, who provided the CYP2E1KO mice and for helpful comments in the preparation of this manuscript. We also thank the Biological Services Department at the Weizmann Institute, Rehovot, Israel, for bioinformatic services, and Natalia Krits for technical assistance.
REFERENCES
- 1. Abdelmegeed MA, Carruthers NJ, Woodcroft KJ, Kim SK, Novak RF. Acetoacetate induces CYP2E1 protein and suppresses CYP2E1 mRNA in primary cultured rat hepatocytes. J Pharmacol Exp Ther 315: 203– 213, 2005 [DOI] [PubMed] [Google Scholar]
- 2. Ayala JE, Bracy DP, McGuinness OP, Wasserman DH. Considerations in the design of hyperinsulinemic-euglycemic clamps in the conscious mouse. Diabetes 55: 390– 397, 2006 [DOI] [PubMed] [Google Scholar]
- 3. Bloch-Damti A, Bashan N. Proposed mechanisms for the induction of insulin resistance by oxidative stress. Antioxid Redox Signal 7: 1553– 1567, 2005 [DOI] [PubMed] [Google Scholar]
- 4. Caro AA, Cederbaum AI. Oxidative stress, toxicology, and pharmacology of CYP2E1. Annu Rev Pharmacol Toxicol 44: 27– 42, 2004 [DOI] [PubMed] [Google Scholar]
- 5. Caro AA, Cederbaum AI. Role of phosphatidylinositol 3-kinase/AKT as a survival pathway against CYP2E1-dependent toxicity. J Pharmacol Exp Ther 318: 360– 372, 2006 [DOI] [PubMed] [Google Scholar]
- 6. Cederbaum AI, Wu D, Mari M, Bai J. CYP2E1-dependent toxicity and oxidative stress in HepG2 cells. Free Radic Biol Med 31: 1539– 1543, 2001 [DOI] [PubMed] [Google Scholar]
- 7. Dai Y, Cederbaum AI. Cytotoxicity of acetaminophen in human cytochrome P4502E1-transfected HepG2 cells. J Pharmacol Exp Ther 273: 1497– 1505, 1995 [PubMed] [Google Scholar]
- 8. DeFuria J, Bennett G, Strissel KJ, Perfield JW, 2nd, Milbury PE, Greenberg AS, Obin MS. Dietary blueberry attenuates whole-body insulin resistance in high fat-fed mice by reducing adipocyte death and its inflammatory sequelae. J Nutr 139: 1510– 1516, 2009 [DOI] [PMC free article] [PubMed] [Google Scholar]
- 9. Ekstrom G, Ingelman-Sundberg M. Rat liver microsomal NADPH-supported oxidase activity and lipid peroxidation dependent on ethanol-inducible cytochrome P-450 (P-450IIE1). Biochem Pharmacol 38: 1313– 1319, 1989 [DOI] [PubMed] [Google Scholar]
- 10. Fukuda T, Imai Y, Komori M, Nakamura M, Kusunose E, Satouchi K, Kusunose M. Different mechanisms of regioselection of fatty acid hydroxylation by laurate (omega-1)-hydroxylating P450s, P450 2C2 and P450 2E1. J Biochem 115: 338– 344, 1994 [DOI] [PubMed] [Google Scholar]
- 11. Gonzalez FJ. The 2006 Bernard B Brodie Award Lecture. Cyp2e1. Drug Metab Dispos 35: 1– 8, 2007 [DOI] [PubMed] [Google Scholar]
- 12. Gorsky LD, Koop DR, Coon MJ. On the stoichiometry of the oxidase and monooxygenase reactions catalyzed by liver microsomal cytochrome P-450. Products of oxygen reduction J Biol Chem 259: 6812– 6817, 1984 [PubMed] [Google Scholar]
- 13. Guengerich FP, Kim DH, Iwasaki M. Role of human cytochrome P-450 IIE1 in the oxidation of many low molecular weight cancer suspects. Chem Res Toxicol 4: 168– 179, 1991 [DOI] [PubMed] [Google Scholar]
- 14. Hannah JS, Howard BV. Dietary fats, insulin resistance, diabetes. J Cardiovasc Risk 1: 31– 37, 1994 [PubMed] [Google Scholar]
- 15. Haque M, Sanyal AJ. The metabolic abnormalities associated with non-alcoholic fatty liver disease. Best Pract Res Clin Gastroenterol 16: 709– 731, 2002 [DOI] [PubMed] [Google Scholar]
- 16. Ji G, Yang Q, Hao J, Guo L, Chen X, Hu J, Leng L, Jiang Z. Anti-inflammatory effect of genistein on non-alcoholic steatohepatitis rats induced by high fat diet and its potential mechanisms. Int Immunopharmacol 2011 [DOI] [PubMed] [Google Scholar]
- 17. Kathirvel E, Chen P, Morgan K, French SW, Morgan TR. Oxidative stress and regulation of anti-oxidant enzymes in cytochrome P4502E1 transgenic mouse model of non-alcoholic fatty liver. J Gastroenterol Hepatol 25: 1136– 1143, 2010 [DOI] [PubMed] [Google Scholar]
- 18. Kathirvel E, Morgan K, French SW, Morgan TR. Overexpression of liver-specific cytochrome P4502E1 impairs hepatic insulin signaling in a transgenic mouse model of nonalcoholic fatty liver disease. Eur J Gastroenterol Hepatol 21: 973– 983, 2009 [DOI] [PubMed] [Google Scholar]
- 19. Koop DR. Oxidative and reductive metabolism by cytochrome P450 2E1. FASEB J 6: 724– 730, 1992 [DOI] [PubMed] [Google Scholar]
- 20. Laethem RM, Balazy M, Falck JR, Laethem CL, Koop DR. Formation of 19(S)-, 19(R)-, and 18(R)-hydroxyeicosatetraenoic acids by alcohol-inducible cytochrome P450 2E1. J Biol Chem 268: 12912– 12918, 1993 [PubMed] [Google Scholar]
- 21. Lavau M, Fried SK, Susini C, Freychet P. Mechanism of insulin resistance in adipocytes of rats fed a high-fat diet. J Lipid Res 20: 8– 16, 1979 [PubMed] [Google Scholar]
- 22. Lee SS, Buters JT, Pineau T, Fernandez-Salguero P, Gonzalez FJ. Role of CYP2E1 in the hepatotoxicity of acetaminophen. J Biol Chem 271: 12063– 12067, 1996 [DOI] [PubMed] [Google Scholar]
- 23. Luo ZC, Xiao L, Nuyt AM. Mechanisms of developmental programming of the metabolic syndrome and related disorders. World J Diabetes 1: 89– 98, 2010 [DOI] [PMC free article] [PubMed] [Google Scholar]
- 24. Oberley LW. Free radicals and diabetes. Free Radic Biol Med 5: 113– 124, 1988 [DOI] [PubMed] [Google Scholar]
- 25. Olefsky JM, Glass CK. Macrophages, inflammation, and insulin resistance. Annu Rev Physiol 72: 219– 246, 2010 [DOI] [PubMed] [Google Scholar]
- 26. Porubsky PR, Battaile KP, Scott EE. Human cytochrome P450 2E1 structures with fatty acid analogs reveal a previously unobserved binding mode. J Biol Chem 285: 22282– 22290, 2010 [DOI] [PMC free article] [PubMed] [Google Scholar]
- 27. Raza H, Prabu SK, Robin MA, Avadhani NG. Elevated mitochondrial cytochrome P450 2E1 and glutathione S-transferase A4–4 in streptozotocin-induced diabetic rats: tissue-specific variations and roles in oxidative stress. Diabetes 53: 185– 194, 2004 [DOI] [PubMed] [Google Scholar]
- 28. Roy U, Joshua R, Stark RL, Balazy M. Cytochrome P450/NADPH-dependent biosynthesis of 5,6-trans-epoxyeicosatrienoic acid from 5,6-trans-arachidonic acid. Biochem J 390: 719– 727, 2005 [DOI] [PMC free article] [PubMed] [Google Scholar]
- 29. Rudich A, Ben-Romano R, Etzion S, Bashan N. Cellular mechanisms of insulin resistance, lipodystrophy and atherosclerosis induced by HIV protease inhibitors. Acta Physiol Scand 183: 75– 88, 2005 [DOI] [PubMed] [Google Scholar]
- 30. Saito H, Ohi H, Sugata E, Murayama N, Fujita Y, Higuchi S. Purification and characterization of a cytochrome P450 from liver microsomes of Xenopus laevis. Arch Biochem Biophys 345: 56– 64, 1997 [DOI] [PubMed] [Google Scholar]
- 31. Schattenberg JM, Wang Y, Rigoli RM, Koop DR, Czaja MJ. CYP2E1 overexpression alters hepatocyte death from menadione and fatty acids by activation of ERK1/2 signaling. Hepatology 39: 444– 455, 2004 [DOI] [PubMed] [Google Scholar]
- 32. Schattenberg JM, Wang Y, Singh R, Rigoli RM, Czaja MJ. Hepatocyte CYP2E1 overexpression and steatohepatitis lead to impaired hepatic insulin signaling. J Biol Chem 280: 9887– 9894, 2005 [DOI] [PubMed] [Google Scholar]
- 33. Song BJ, Veech RL, Saenger P. Cytochrome P450IIE1 is elevated in lymphocytes from poorly controlled insulin-dependent diabetics. J Clin Endocrinol Metab 71: 1036– 1040, 1990 [DOI] [PubMed] [Google Scholar]
- 34. Storlien LH, Baur LA, Kriketos AD, Pan DA, Cooney GJ, Jenkins AB, Calvert GD, Campbell LV. Dietary fats and insulin action. Diabetologia 39: 621– 631, 1996 [DOI] [PubMed] [Google Scholar]
- 35. Stumvoll M, Goldstein BJ, van Haeften TW. Type 2 diabetes: principles of pathogenesis and therapy. Lancet 365: 1333– 1346, 2005 [DOI] [PubMed] [Google Scholar]
- 36. Tzanavari T, Giannogonas P, Karalis KP. TNF-alpha and obesity. Curr Dir Autoimmun 11: 145– 156, 2010 [DOI] [PubMed] [Google Scholar]
- 37. Wang Z, Hall SD, Maya JF, Li L, Asghar A, Gorski JC. Diabetes mellitus increases the in vivo activity of cytochrome P450 2E1 in humans. Br J Clin Pharmacol 55: 77– 85, 2003 [DOI] [PMC free article] [PubMed] [Google Scholar]
- 38. Wu D, Cederbaum AI. Removal of glutathione produces apoptosis and necrosis in HepG2 cells overexpressing CYP2E1. Alcohol Clin Exp Res 25: 619– 628, 2001 [PubMed] [Google Scholar]
- 39. Yang CS, Yoo JS, Ishizaki H, Hong JY. Cytochrome P450IIE1: roles in nitrosamine metabolism and mechanisms of regulation. Drug Metab Rev 22: 147– 159, 1990 [DOI] [PubMed] [Google Scholar]
- 40. Yoshinari K, Sato T, Okino N, Sugatani J, Miwa M. Expression and induction of cytochromes p450 in rat white adipose tissue. J Pharmacol Exp Ther 311: 147– 154, 2004 [DOI] [PubMed] [Google Scholar]
- 41. Zaher H, Buters JT, Ward JM, Bruno MK, Lucas AM, Stern ST, Cohen SD, Gonzalez FJ. Protection against acetaminophen toxicity in CYP1A2 and CYP2E1 double-null mice. Toxicol Appl Pharmacol 152: 193– 199, 1998 [DOI] [PubMed] [Google Scholar]
- 42. Zhang W, Lu D, Dong W, Zhang L, Zhang X, Quan X, Ma C, Lian H. Expression of CYP2E1 increases oxidative stress and induces apoptosis of cardiomyocytes in transgenic mice. FEBS J 278: 1484– 1492, 2011 [DOI] [PubMed] [Google Scholar]
- 43. Zong H, Bastie CC, Xu J, Fassler R, Campbell KP, Kurland IJ, Pessin JE. Insulin resistance in striated muscle-specific integrin receptor beta1-deficient mice. J Biol Chem 284: 4679– 4688, 2009 [DOI] [PMC free article] [PubMed] [Google Scholar]
- 44. Zong H, Wang CC, Vaitheesvaran B, Kurland IJ, Hong W, Pessin JE. Enhanced energy expenditure, glucose utilization, and insulin sensitivity in VAMP8 null mice. Diabetes 60: 30– 38, 2011 [DOI] [PMC free article] [PubMed] [Google Scholar]


