Abstract
Sustained damage to the mucosal lining in patients with inflammatory bowel disease (IBD) facilitates translocation of intestinal microbes to submucosal immune cells leading to chronic inflammation. Previously, we demonstrated the role of Jak3 in IL-2-induced intestinal epithelial cell (IEC) migration, one of the early events during intestinal wound repair. In this study, we demonstrate that IL-2 also plays a role in IEC homeostasis through concentration-dependent regulation of IEC proliferation and cell death. At lower concentrations (≤50 U/ml), IL-2 promoted proliferation, while at higher concentrations (100 U/ml), it promoted apoptosis. Activation by IL-2 led to tyrosine phosphorylation-dependent interactions between Jak3 and p52ShcA only at lower concentrations. Phosphatase SHP1 dephosphorylated IL-2-induced phosphorylated p52ShcA. Higher concentrations of IL-2 decreased the phosphorylation of Jak3 and p52ShcA, disrupted their interactions, redistributed Jak3 to the nucleus, and induced apoptosis in IEC. IL-2 also induced dose-dependent upregulation of p52shcA and downregulation of jak3-mRNA. Constitutive overexpression and mir-shRNA-mediated knockdown studies showed that expression of both Jak3 and p52ShcA were necessary for IL-2-induced proliferation of IEC. Doxycycline-regulated sh-RNA expression demonstrated that IL-2-induced downregulation of jak3-mRNA was responsible for higher IL-2-induced apoptosis in IEC. Collectively, these data demonstrate a novel mechanism of IL-2-induced mucosal homeostasis through posttranslational and transcriptional regulation of Jak3 and p52ShcA.
Keywords: cell proliferation, apoptosis, necrosis, inflammatory bowel disease, Janus kinase-3
self-renewal of the epithelium of the small intestine and colon is a highly regulated process that links cell proliferation, crypt-villus migration, differentiation, and cell death. This involves proliferation of stem cells or progenitor cells located at the bottom of the crypt. The newly formed cells undergo these processes under temporal and spatial control ending ultimately with extrusion of the terminally differentiated cells at the tip of villus (7). Studies (17, 50) in recent years have shown that the mucosal immune system plays an essential role in regulating mucosal barrier and homeostasis through cross-talk between intestinal epithelial cells (IEC) and intestinal immune cells. Loss of this communication leads to sustained mucosal inflammation as seen in patients with various intestinal disorders including inflammatory bowel disease (8). Interleukin 2 (IL-2) is an important cytokine secreted by lymphocytes and plays a major role in stimulating proliferation of mucosal lymphocytes, natural killer cells, and macrophages (4). Although it was initially presumed that the target cells for IL-2 were confined largely to the immune system, recent studies (6, 9, 40) show that IL-2 receptors are also present in rat and human IEC lines and in the primary IEC of humans, rats, and mice. IL-2 knockout (KO) mice develop ulcerative colitis (43), and expression of IL-2 was reduced in human colitis patients (29) and correlated with persistent colonic inflammation (29, 43). IL-2 KO mice also showed severe chronic inflammation autoimmunity due to thymic and mucosal dysregulation (11). Although the role of IL-2 has been extensively investigated in the growth and homeostasis of different immune cells (15), explaining the thymic dysregulation in KO mice, the mechanism of mucosal dysregulation in these mice is unknown. Furthermore, the effect of IL-2 on epithelial cells may be of particular interest in the intestines where various constituents of the lamina propria and intraepithelial lymphocytes express IL-2 (25, 48). The concentration of lamina propria mononuclear cells (LPMC), the main source of IL-2 in the intestine, was doubled in inflammatory bowel disease (IBD) patients compared with normal controls, and both increased and decreased concentrations of IL-2 were found in active IBD lesions (3, 39). Thus there is evidence that both decreased IL-2 expression and overexpression of IL-2 can promote inflammation. Therefore, IL-2 expression must be tightly regulated to maintain a healthy mucosa. The specific role of IL-2 in intestinal epithelial homeostasis is not known. In vitro studies using different IEC lines from human and rat show that IL-2 promotes IEC proliferation and ion secretion (2, 34). However, IL-2 has also been shown to enhance susceptibility to apoptosis in colonic epithelial cells (44). The mechanism for these opposite effects in response to the same cytokine is not understood completely. To understand the role of IL-2 during intestinal inflammation and in IEC homeostasis, we (22) previously showed that Jak3 was important in IL-2-induced mucosal wound repair through its interactions with the cytoskeletal protein villin. In this study, we demonstrate that IL-2 also plays an important role in IEC homeostasis and propose a novel mechanism through which IL-2 regulates both proliferation and cell death in IEC by concentration-dependent activation and interaction between Jak3 and p52ShcA and transcriptional regulation of the mRNA expression of Jak3 and p52ShcA.
MATERIALS AND METHODS
Materials.
Materials were obtained from the following sources: HT-29 CL-19A and Caco2 cells were gifts from Dr. A. P Naren and Dr. Gabor Tigyi, respectively, from the University of Tennessee Health Science Center (Memphis, TN; Ref. 22); HEK293 T (Open Biosystems); pY20 antibody (MP Biomedicals); pSTAT3 antibody (Cell Signaling Technology); Jak3-, Shc-, IgG-, and β-actin antibody (Santa Cruz Biotechnology); Trizol (Invitrogen); first strand cDNA synthesis kit (Roche Chemical); recombinant IL-2 (Sigma); primers (IDT); Jak3-shRNA and Shc-shRNA constructs (Open Biosystems); and doxycycline (Sigma).
Cell culture and IL-2 treatment.
Caco-2 and HT-29 Cl-19A are human-derived colonic epithelial cell lines and both are used as an intestinal epithelial model (1, 49). HT-29-derived clone HT-29 CL-19 A is permanently differentiated and comprised of a homogenous population of cells (24). Caco2, HT-29 Cl-19A, and HEK 293T cells were maintained in DMEM containing 10% FBS (Invitrogen) and penicillin and streptomycin. For IL-2 treatment, cells were kept in DMEM containing 0.1% FBS for 17 h before replacement with fresh DMEM containing human IL-2 (Sigma).
Immunoprecipitation and Western blot analysis.
HT-29 CL 19 A cells grown under different conditions in a sixwell plate were lysed using lysis buffer (20 mM Tris pH 7.4, 150 mM NaCl, 10% glycerol, 2 mM EDTA, 1 mM PMSF 0.15 U/ml aprotenin, 20 μM lupeptine, 2 mM sodium orthovanadate, and 1% NP-40). Proteins in the lysates were estimated using BCA reagents (Pierce Biotech). Equal amounts of protein (also probed for β-actin as a loading control through Western analysis using anti β-actin antibody) were subjected to immunoprecipitation using pY20, Jak-3, Shc, and IgG control antibodies. The components of the immunoprecipitate complexes were resolved on 4–12% gradient gel and detected by Western analysis using the above-mentioned antibodies and Pierce SuperSignal West Dura Extended duration Chemiluminescent Substrate (Thermo Scientific).
Phase contrast and immunofluorescence microscopy.
Phase contrast images of IL-2-treated cells were taken using a fluorescence TS-100 Nikon microscope. For immunofluorescence microscopy, control and IL-2-treated cells were grown on coverslips, fixed using 4% (vol/vol) paraformaldehyde in PBS, permeablized using 0.2% Triton X-100 in PBS, and blocked using 0.1% (vol/vol) BSA in PBS. Cells were stained using Jak3 as primary and anti-mouse CY3 as secondary antibody. For controls, cells were incubated with secondary antibody alone. Fluorescence was examined using a Zeiss laser scanning confocal microscope. Experiments were conducted in triplicate.
Cell proliferation assay.
Cells (5 × 10⁴) were grown in a 96-well microtiter plate in a volume of 100 μl/well in the presence or absence of different concentrations of IL-2 for 72 h to allow sufficient time for proliferation (13, 33). The medium was replenished every 24 h. In selected wells, the cells were grown in the presence of IL-2 and the Jak3 inhibitor WHI-P131. Phase-contrast images of the cells at 0 and 72 h were taken as mentioned above. For quantification, the plate was washed three times using PBS and quantified using the Quick cell proliferation assay kit (QCPAK; BioVison) as per the manufacturer's protocol. The assay is based on the cleavage of the tetrazolium salt WST-1 to formazan by cellular mitochondrial dehydrogenase. Expansion in the number of viable cells results in an increase in the activity of mitochondrial dehydrogenases that leads to the increase in the amount of formazan dye formed. Absorbance of the sample was measured in a microtiter plate reader (Perkin Elmer) at 450 nm. Each data point represented the means ± SE of three independent experiments.
Cell counting.
Control and IL-2-treated cells were trypsinized to dissociate from the plates, and an equal volume of cell suspension was mixed with trypan blue and loaded to each chamber of the hemocytometer. Cells were counted on each chamber, and the average number of viable cells was calculated by deducting the stained cells from the total.
Real-time PCR and reverse transcriptase PCR.
Total RNA was isolated using Trizol reagent (Invitrogen) and reverse transcribed using Transcriptor First Strand cDNA synthesis kit (Roche). The reaction mixture contained 2 μg of purified total RNA, 4 μl of PCR mix (provided by the manufacturer), 4 μl of MgCl2 (25 mM), 1 μl of each primer (10 μM), and 0.4 μl of enzyme mix and DEPC water in a 20-μl final volume. Sequence specific primers for Jak3 and p52ShcA were designed using a universal probe library (Roche Applied Science) and synthesized from IDT Technology (Coralville, IA). Primers used were as follows: Shc (forward) 5′-GGGGTTTCCTACTTGGTTCG-3′ and Shc (reverse) 5′-CCGGGTGTTGAAGTCCAG3-′; Jak3 (forward) 5′-CTACGCCCTCAACTATCTGGA3-′ and Jak3 (reverse) 5′-TTCCGGGCAGAGACATTG3-′; 18srRNA control (forward) 5′-CGGCTACCACATCCAAGGAA-3′ and 18srRNA control (reverse) 5′-GCTGGAATTACCGCGGCT-3′. Real-time detection of PCR products was performed by a ABI PRISM 7700 sequence Detector (Applied Biosystems). Reactions were performed in triplicate for each condition. Based on Ct (cycle threshold) values from Jak3 and p52ShcA detections, normalized Jak3 and ShcA expression (Jak3/18srRNA and p52ShcA/18srRNA) was calculated using the Ct method according to the supplier's protocol (User Bulletin; Applied Biosystem). Reverse transcriptase PCR was performed using a One step RT-PCR kit (Qiagen) as per the manufacturer's protocol using 2 μg of total RNA (as template) and the above-mentioned primers. 18srRNA was again used as an internal control. The amplified PCR samples were separated using a 3% agarose gel.
Stable transfection.
Full-length Jak3 was cloned in a eukaryotic expression vector pCDNA3-HA. HA-Jak-3 and Flag-ShcA (a gift from Dr. Tony Pawson, Mount Sinai Hospital, Toronto, Canada) were stably transfected in HT-29 CL19A cells using Lipofectamine 2000 (Invitrogen). Transfected cells were selected by growing in media containing G418 (200 μg/ml). Individual clones (visualized under phase contrast microscopy) were lifted using Raschig rings and propagated under G418 selection pressure. Cell lysates from different clones were analyzed by Western blot to determine the expression of HA-Jak3 and Flag-p52Shc. Clones expressing comparable amounts of proteins were selected for further studies.
Knockdown of p52ShcA and Jak-3 expression.
p52ShcA shRNA cloned in pLKO.1 vector and human Jak-3 shRNA cloned in pTRIPZ vector (Expression arrest) was obtained from Open Biosystem. A translentiviral shRNA packaging system (Open Biosystem) was used to package the Jak3-shRNA and p52ShcA-shRNA in lentivirus. Viral particles were purified as per the manufacturer's protocol. Expression of turbo-red-fluorescence protein (RFP)-tagged Jak3-shRNA was induced in transduced cells by supplementing the growth media with 1 μg/ml of doxycycline. Cells grown in the absence of doxycycline were used as a control. Knockdown of the Jak3 gene was confirmed using fluorescence and confocal microscopy for RFP-tagged Jak3-shRNA expression and Western analysis for Jak3 protein expression. Knockdown of p52ShcA was confirmed using Western analysis.
Isolation of cytoplasmic and nuclear fraction.
Cells (2 × 10⁶) were grown in a 100-mm dish. Nuclear and cytoplasmic fractions were isolated using Pierce nuclear and cytoplasmic extraction kit (NE-PER) as per the manufacturer's protocol. Samples were normalized for protein concentration using BCA reagent. Ten micrograms of each cytosolic and nuclear extract were separated using 4–12% SDS-PAGE and analyzed by Western blot as mentioned above using Jak3, β-actin, and pSTAT3 antibodies.
Apoptosis assays.
Cells (1 × 10⁶) were seeded on a coverslip in a 24-well plate and allowed to grow for 48 h followed by serum starvation for 12 h. The cells were treated with different concentrations of IL-2 for 12 h. The control and treated cells were fixed and stained using Apo-Brdu In-Situ DNA fragmentation assay kit (Biovision) as per the manufacturer's protocol. Cells were visualized using a Nikon TS-100 eclipse fluorescence microscope using FITC and TRITC filters. The green staining with FITC indicated DNA fragmentation while the red staining with TRITC indicated nuclei. Apoptosis and necrosis in HT-29 Cl-19A cells were detected using the GFP-certified apoptosis/necrosis detection kit (Enzo Life Sciences). Cells were grown as mentioned above in the presence of a lentivirus expressing green fluorescence protein and treated with the apoptotic inducer staurosporine or different concentrations of IL-2 for 16 h. Cells were then washed with PBS and incubated with apoptosis (annexin V-EnzoGold)/necrosis (DNA intercalating dye-7-AAD) dual detection reagent as per the manufacturer's protocol and observed under a Nikon C1-plus confocal microscope with a dual filter set for Cyanine-3/Far-red and a GFP/FITC filter. The display of phosphatidylserine on the extracellular face of the intact plasma membrane as indicated by membrane impermeable annexin V-EnzoGold binding showed induction of early stage apoptosis, while binding of membrane impermeable DNA intercalating dye to the nuclear DNA indicated membrane rupture and necrosis.
In vitro phosphatase assay.
Constructs for full-length SHP1, SHP2, and PTP-1B cloned in pGEX2T were purchased from Addgene (Addgene plasmid nop8594, 8322, and 8602, respectively). Escherichia coli BL-21/DE3 was transformed with these constructs and active forms of the GST fusion phosphatases were obtained as reported previously (14, 35, 37). The phosphatase assay was done as reported elsewhere (18). Briefly, HT-29CL-19A cells were grown in 60-mm dish, and cell lysates were prepared from control and IL-2 (50 U/ml)-treated cells. The lysates were subjected to immunoprecipitation using a ShcA antibody. The immune complex was incubated with protein A-Sepharose beads for 1 h at 4°C. Bead-bound proteins were separated by centrifugation and washed using cold PBS. Bead-bound proteins (substrate) were estimated using the BCA reagent and were incubated with different recombinant GST-tagged phosphatase (enzyme). The substrate to phosphatase ratio was maintained at 10:1. The reaction was carried out in binding buffer for 12 h at 4°C on a rotator followed by centrifuging. Protein A-Sepharose bound proteins were eluted in 2× Lammeli buffer (Bio-Rad) and separated using 4–15% PAGE (Clear-PAGE SDS gel). To determine the tyrosine phosphorylation of the separated proteins, Western analysis was performed using pY20 antibody.
Statistical analysis.
Data were analyzed using a one-way ANOVA using SigmaStat Statistical Software 2.03 (SPPS, Chicago, IL). If significant differences were detected, pair-wise comparisons were made using a Tukey's post hoc test. Significance was defined as P < 0.05 for all analyses.
RESULTS
IL-2 induced a dose-dependent increase in cell proliferation in IEC.
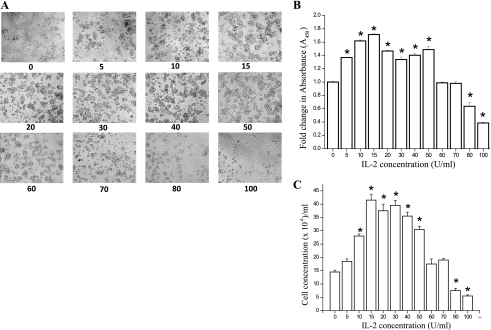
Although IL-2 has been shown to be important for mucosal wound repair (6, 10), the specific role of IL-2 in IEC homeostasis is unclear. To determine the effect of IL-2 on IEC, we treated cells with doses of IL-2 ranging from 0 to 100 U/ml for 72 h and examined morphology and proliferation. Figure 1A shows that IL-2 stimulated a dose-dependent increase in HT-29 Cl 19A cell spreading and cell number that peaked between 10 and 50 U/ml, when higher doses caused decreased spreading and cell number. To quantitatively confirm these findings, we measured proliferation using both a metabolic indicator approach (QCPAK) and by direct counting with a hemocytometer. Figure 1, B and C, confirms the stimulation of HT-29 Cl 19A proliferation by IL-2 with a peak response between 10 and 50 U/ml. The highest doses (80–100 U/ml) caused decreased cell number indicating cytotoxicity at these doses. To determine whether the effects of IL-2 were cell specific, a similar dose response was also obtained using another intestinal epithelial cell line, Caco-2.
Fig. 1.
IL-2 induces a dose-dependent increase in cell proliferation at lower concentration and cell death at higher concentrations in intestinal epithelial cell (IEC). A: HT-29 CL-19A cells were treated with different concentrations of IL-2 for 72 h. Phase-contrast images were taken after 72 h using Nikon TS100 microscope. B: 5 × 10³ cells were cultured in a 96-well microtiter plate in a final volume of 100 μl/well culture medium in the absence or presence of indicated concentrations of IL-2. Cell proliferation was measured by using QCPAK as per manufacturer's protocol. C: cell counting was performed on control and IL-2-treated cells following 72 h of incubation using hemocytometer as mentioned in materials and methods section. B and C: values are means ± SE. *P < 0.05, statistically significant differences from untreated cells; n = 3 experiments.
IL-2 promoted Jak3 interactions with Shc only at low concentrations.
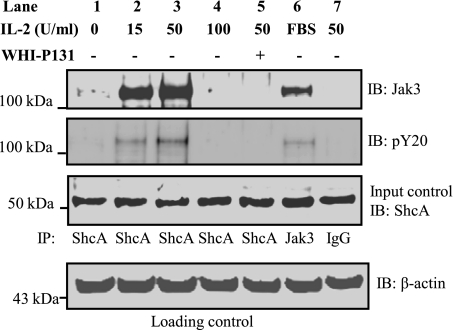
We previously reported that IL-2 induced mucosal wound repair through activation of Jak3 and its interactions with the cytoskeletal protein villin (22). To investigate whether IL-2-mediated effects on IEC were dependent upon interactions between Jak3 and ShcA, we performed coimmunoprecipitation experiments. As shown in Fig. 2, top, treatment with IL-2 caused coimmunoprecipitation of Jak3 and ShcA (using an antibody against ShcA) at doses of 15 and 50 U/ml, but this interaction did not occur in the absence of IL-2 or at a dose of 100 U/ml. To further determine if these interactions were dependent on Jak3 activation, the coimmunoprecipitation experiments were carried out in the presence of a Jak3 specific inhibitor, WHI-P131. We (22) previously reported that treatment with this inhibitor prevented tyrosine phosphorylation of Jak3 in the presence of IL-2. Treatment with WHI-P131 prevented Jak3 coimmunoprecipitation by ShcA antibody (Fig. 2, lane 5). Immunoprecipitation using IgG was used as a negative control (lane 7), and the use of a Jak3 antibody was taken as a positive control (lane 6). Immunoblotting using a phosphotyrosine-specific antibody showed that Shc-interacting Jak3 was also tyrosine phosphorylated (second panel). Figure 2, third and fourth panels, shows the loading and input controls, respectively. Taken together, these results show that low concentrations of IL-2 promoted the interaction between Jak3 and ShcA, and these interactions were dependent on tyrosine phosphorylation (activation) of Jak3, as indicated by the effects of WHI-P131.
Fig. 2.
IL-2 promotes Jak3 interactions with ShcA at lower concentrations: HT-29 CL-19A cells were treated with 15-, 50-, and 100-U/ ml of IL-2 in the presence or absence of Jak3 inhibitor WHI-P131 for 15 min. Cells were lysed using lysis buffer and proteins in the lysates were estimated using BCA protein assay reagents. Equal amounts of ShcA proteins (Input control) were subjected to immunoprecipitation (IP) using Shc-A (test samples; lanes 1–5), Jak3 (positive control; lane 6), and IgG (negative control; lane 7) antibodies. IB, immunoblot. Western analysis of the SDS-PAGE separated protein complex was performed using a Jak3 and phospho-tyrosine (pY20) antibodies. Blots shown represent n = 3 experiments.
IL-2 induced tyrosine phosphorylation of p52ShcA.
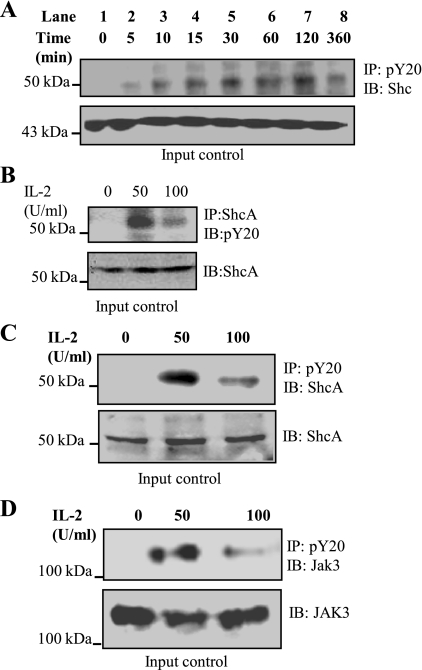
To determine whether IL-2-dependent interactions between Jak3 and ShcA led to tyrosine phosphorylation of ShcA, we treated cells with IL-2 and performed immunoprecipitation experiments. As shown in Fig. 3A treatment with IL-2 (50 U/ml) caused a time-dependent increase in tyrosine phosphorylation of ShcA that was persistent even after 360 min. The phosphorylation of p52ShcA increased with time after 120 min of IL-2 activation and then decreased at 360 min. To further demonstrate whether IL-2 induced tyrosine phosphorylation of p52ShcA, immunoprecipitation with a ShcA antibody followed by blotting with an anti-phosphotyrosine antibody showed that p52ShcA was tyrosine phosphorylated by IL-2 (Fig. 3B), but the phosphorylation level was decreased at 100 U/ml IL-2. Figure 3, C and D, confirms that although treatment with 100 U/ml IL-2 caused an increase in tyrosine phosphorylation of both ShcA and Jak3 compared with untreated cells, the levels of phosphorylation were decreased compared with cells treated with 50 U/ml. Figure 3, A–D, bottom, indicates comparable levels of protein in the input control. Taken together, these results show that low concentrations of IL-2 promoted tyrosine phosphorylation of Jak3 and p52-ShcA, but the extent of phosphorylation was decreased with 100 U/ml IL-2.
Fig. 3.
IL-2 induces tyrosine phosphorylation of ShcA in a time-dependent manner: A: HT-29 CL-19A cells were treated with 0 (control), 50, and 100 U/ml of IL-2 and cells were lysed using lysis buffer. Proteins in the lysates were estimated using BCA protein assay reagents. Equal amounts of protein (input control) were subjected to immunoprecipitation using ShcA and Western analysis of the SDS-PAGE separated protein complex was performed using phosphotyrosine-specific antibody (pY20: MP Biomedical). B: HT-29 CL-19A cells were treated with 50 U/ml of IL-2 for indicated times. Cells were lysed using lysis buffer, and proteins in the lysates were estimated using BCA protein assay reagents. Equal amounts of proteins (input control) were subjected to immunoprecipitation using pY20 antibody. Western analysis of SDS-PAGE separated protein complex was done using ShcA antibody. C and D: same protocol was followed as in A except the proteins were immunoprecipitated using pY20 antibody and the Western analysis of the SDS-PAGE separated protein complex was performed using ShcA (C) and Jak3 (D) antibodies. Blots shown represent n = 3 experiments.
Protein tyrosine phosphatase SHP1 deposphorylates IL-2-induced tyrosine-phosphorylated ShcA.
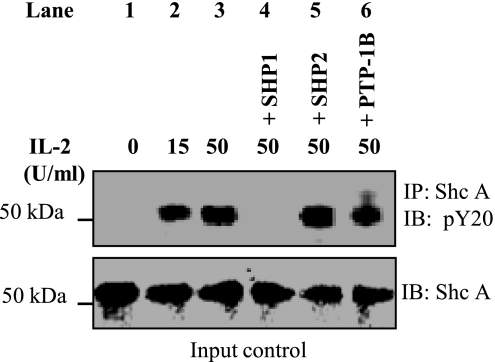
To examine the phosphatases involved in the dephosphorylation of ShcA, we produced recombinant and active forms of SHP1, SHP2, and PTP-1B as reported before (14, 35, 37) and performed an in vitro phosphatase assay using IEC p52ShcA as substrate. As shown in Fig. 4, treatment with IL-2 led to tyrosine phosphorylation of p52ShcA, which was not affected by incubation with recombinant phosphatase SHP2 (lane 5) or PTP-1B (lane 6). However, incubation with SHP1 led to complete dephosphorylation of p52ShcA.
Fig. 4.
Protein tyrosine phosphatase SHP1 deposphorylates IL-2-induced tyrosine phosphorylated ShcA: HT-29 CL-19A cells were treated with 50 U/ ml of IL-2 for 2 h. Lysates were subjected to immunoprecipitation using ShcA antibody. Immune complex was incubated with 60 μl of protein A-Sepharose beads for 1 h at 4°C. Protein complex with the beads was centrifuged. Beads were washed 3 times with ice cold PBS. Phosphatase assay using equal amounts of ShcA (input control) was done using the bead bound proteins (substrate) and different recombinant GST-tagged phosphatase (enzyme) as described under materials and methods. Protein A-Sepharose bound proteins were eluted in 2× Lammeli buffer (Bio-Rad) and were separated using 4–15% PAGE (Clear-PAGE SDS gel). Tyrosine phosphorylation status of the separated proteins was determined through Western analysis using pY20 antibody. Blots shown represent n = 3 experiments.
Elevated concentrations of IL-2 induced redistribution of Jak3 to the nucleus.
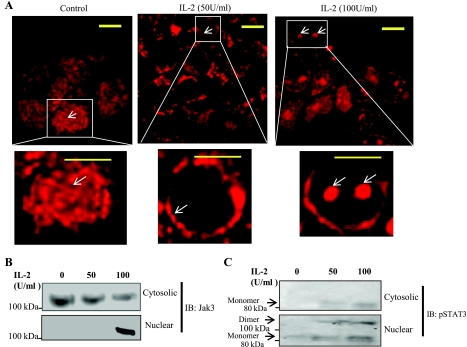
Since we (22) previously reported that IL-2 promoted tyrosine phosphorylation and redistribution of Jak3 to the cell margin, we examined the effect of an elevated concentration of IL-2 on the redistribution of Jak3 in IEC using immunofluorescence staining of Jak3. As shown in Fig. 5A, the distribution of Jak3 in control cells was mostly cytoplasmic without any clear compartmentalization. However, as reported previously (22), treatment with 50 U/ml of IL-2 promoted redistribution of Jak3 to the cell periphery. Interestingly, when HT-29 CL-19A cells were incubated with a higher concentration of IL-2 (100 U/ml), Jak3 redistributed more to the nuclear region. To further confirm that Jak3 redistributes to the nucleus, the nuclear extracts and the corresponding extranuclear fractions were isolated from control and treated cells. Figure 5B shows the distribution of Jak3 in the extranuclear fraction and the nuclear fraction from the same samples. Jak3 protein was present in the extranuclear fraction from control and IL-2-treated cells but appeared in the nuclear fraction only in the cells treated with 100 U/ml IL-2. As a positive control, we checked the distribution of STAT3, which is phosphorylated during IL-2 activation (15). It is known that phosphorylated STAT3 dimerizes and translocates to the nucleus (15). As shown in Fig. 5C, treatment with IL-2 led to tyrosine phosphorylation of STAT3, but the nuclear fraction from IL-2-treated cells also contained the dimer forms of STAT3.
Fig. 5.
Elevated concentration of IL2 induces localization of Jak3 to the nucleus: A: HT-29 CL-19A cells were grown on 12-mm glass coverslip incubated with lower (50 U/ ml) or higher (100 U/ml) concentrations of IL-2 for 15 min and washed using 1× PBS. Washed cells were then fixed using 4% paraformaldehyde and permeabilized using 0.2% Triton X-100 followed by staining with Jak3 antibody. Localization of Jak3 protein was examined using immunofluorescence microscopy, and a representative image from 3 independent experiments is shown as control cells (left), cells treated with lower concentrations of IL-2 (middle), and the cells treated with higher concentrations of IL-2 (right). Bottom: enlarged view of a single cell. B and C: HT-29 CL-19A cells were grown in a 100-mm dish followed by treatment with lower or higher concentrations of IL-2 as above. Cells were lysed and both nuclear and cytoplasmic fraction were isolated using Pierce nuclear and cytoplasmic extraction kit (NE-PER) as per manufacturer's protocol. Samples were normalized for protein concentration using BCA protein assay reagents. Ten micrograms of each cytosolic and nuclear extract were separated using 4–20% SDS-PAGE, and Western analysis was done using Jak3 (B)- and phospho-specific STAT3 (pSTAT; C) antibodies. Data represent 3 independent experiments. Arrow indicates the changes in localization of Jak3 proteins. Scale bar = 14 μm.
IL-2 induced downregulation of p52ShcA-mRNA and upregulation of Jak3-mRNA.
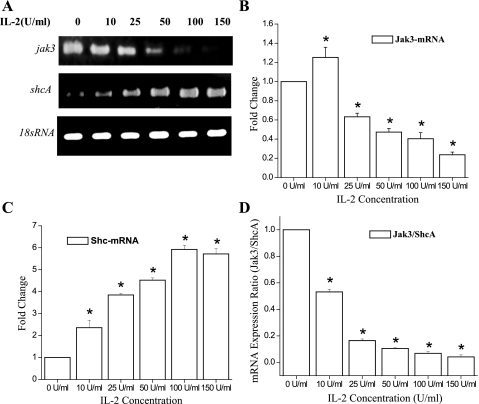
Since we demonstrated dose-dependent responses of IEC to IL-2, we investigated whether IL-2 had an effect on transcriptional regulation of Jak3 and p52ShcA mRNA. Figure 6A shows that Jak3 mRNA levels were increased by a 12-h treatment with 10 U/ml IL-2, but higher doses caused decreased mRNA expression. In contrast, IL-2 stimulated a dose-dependent increase in ShcA mRNA expression. For these experiments, 18s RNA was taken as an internal control, which did not show variation with increasing IL-2 concentrations (Fig. 6A, bottom). These results were confirmed by real-time PCR, as shown in Fig. 6, B and C. Figure 6D suggests that a Jak3/ShcA mRNA ratio of 0.1 or higher supported proliferation, while a lower ratio induced cell death (Fig. 1B).
Fig. 6.
IL-2 induced upregulation of p52ShcA-mRNA and downregulation of Jak3-mRNA expression in a dose-dependent manner: A: cells were grown in a 6-well plate and were treated with different concentrations of IL-2 for 12 h. Total RNA was extracted using TRIZOL reagent (Invitrogen). Two micrograms of total RNA was reverse-transcribed into cDNA using transcription first strand cDNA synthesis kit (Roche Biochemicals). The amount of DNA was estimated using spectrophotometer. Equal amounts of cDNA were subjected to reverse transcriptase PCR in a 30-μl total volume using PCR machine (Bio-Rad). The whole reaction mixture was analyzed using 3% agarose gel. B and C: equal amounts of cDNA were subjected to real-time PCR analysis using ABI PRISM 7500. Absolute quantification of the gene expression was done using ABI PRISM software and expressed as fold change with respect to housekeeping gene 18srRNA. D: ratio of mRNA expression from B (Jak3) and C (ShcA) is plotted at the indicated concentrations of IL-2. Values are means ± SE. *P < 0.05, statistically significant differences from untreated cells; n = 3 experiments.
Constitutive overexpression of ShcA potentiated IL-2-induced proliferation of IEC.
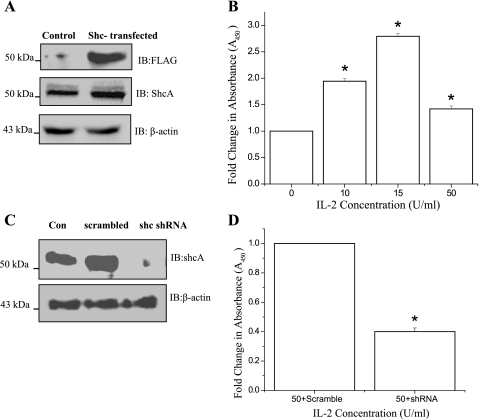
To further investigate the role of ShcA in IEC proliferation, we examined the effect of constitutive overexpression of ShcA on the proliferation of HT-29 CL 19A cells. Figure 7A, top, demonstrates the expression of FLAG-tagged p52ShcA in stably transfected HT-29 CL-19A cells. Figure 7A, middle and bottom, shows the ShcA overexpression and the loading control, respectively. When ShcA overexpressing cells were treated with increasing doses of IL-2 for 72 h, proliferation was increased dose dependently (Fig. 7B). However, proliferation was stimulated to a greater extent than parental cells at 10 and 15 U/ml, but at 50 U/ml the stimulation was not as high as in parental cells (see Fig. 1). To determine if p52ShcA expression was necessary for the proliferation of IEC, the expression of p52shcA was knocked down using pLok sh-Shc (Fig. 7C), and the proliferation of these cells was determined as the ratio between pLok sh-Shc transfected and the internal control pLok sh-scrambled transfected cells. As shown in Fig. 7D, knockdown of p52shcA expression led to decreased cell proliferation at 72h.
Fig. 7.
Constitutive overexpression of ShcA potentiates IL-2-induced proliferation of IEC: A: HT-29 Cl-19A cells were stably transfected with FLAG tagged p52ShcA. Constitutive expression p52ShcA was analyzed by Western analysis of the cell lysates from the recombinant clone (HT-29 CL-19A-FLAG-ShcA) using FLAG antibody. B: 5 × 10³ of HT-29 CL-19A-FLAG-ShcA cells were cultured in a 96-well microtiter plate in a final volume of 100 μl/well culture medium in the presence of indicated concentrations of IL-2. Cell proliferation was measured using QCPAK as in Fig. 1B. C: 5 × 10⁵HT-29 Cl 19A cells were transfected either with pLok vector containing scrambled RNA or pLok vector containing p52ShcA-shRNA. Western analysis of the cell lysates from control (Con-untransfected; lane 1), scrambled transfected (scramble; lane 2), and p52ShcA transfected (shc-shRNA; lane 3) cells were done using ShcA antibody. D: 5 × 10³HT-29 Cl 19A cells transfected either with pLok vector containing scrambled RNA (Control) or pLok vector containing p52ShcA-shRNA were cultured in a 96-well microtiter plate in a final volume of 100 μl/well culture medium in the presence of 50 U/ml IL-2. Cell proliferation was measured as mentioned above. B and D: values are means ± SE. *P < 0.05, statistically significant differences from untreated cells; n = 3 experiments.
Constitutive overexpression of Jak3 offset the dose effect of IL-2 on proliferation.
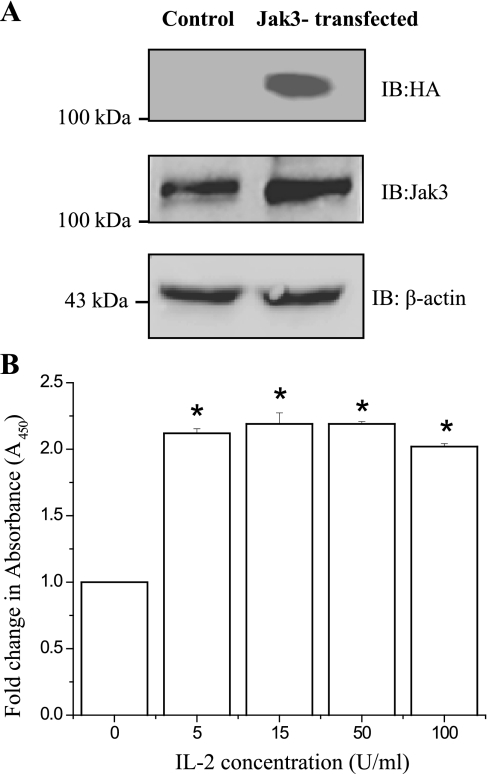
Since IL-2 induced a dose-dependent downregulation of Jak3 mRNA expression, we examined whether overexpression of Jak3 would prevent the decrease in cell proliferation caused by high doses of IL-2. With the use of stable transfection of hemagglutinin-(HA)-tagged Jak3 into HT-29 CL-19A cells under the control of the CMV promoter, constitutive expression of HA-Jak3 was confirmed, as shown in Fig. 8A, top. Figure 8A, middle and bottom, shows the overexpression of Jak3 compared with endogenous Jak3 and the loading control, respectively. HA-tagged Jak3 was constitutively expressed in these cells and was not affected by IL-2 concentrations (data not shown). Figure 8B shows that treatment with IL-2 led to more than a twofold increase in proliferation of HT-29 CL-19A-HA-Jak3 cells even at a low concentration (5 U/ml) of IL-2. Further increases in IL-2 concentration had little effect on the proliferation, which remained at an elevated level at all IL-2 concentrations, including doses that caused decreased proliferation in parent cells (100 U/ml; Fig. 1, B and C). These results indicate that constitutive expression of Jak3 had a protective effect on HT-29 CL-19A-HA-Jak3 cells against high dose IL-2.
Fig. 8.
Constitutive overexpression of Jak3 offsets the dose effect of IL-2 on proliferation and has protective effect at higher concentrations of IL-2: A: HT-29 Cl-19A cells were stably transfected with HA tagged Jak3 (HA-Jak3) and the constitutive expression Jak3 was analyzed by Western analysis of the cell lysates from the recombinant clone (HT-29 CL-19A-HA-Jak3) using HA antibody. B: 5 × 10³ of HT-29 CL-19A-HA-Jak3 cells were cultured in a 96-well microtiter plate in a final volume of 100 μl/well culture medium in the absence or presence of indicated concentrations of IL-2. Cell proliferation was measured by using QCPAK as in Fig. 1B. Values are means ± SE. *P < 0.05, statistically significant differences from untreated cells; n = 3 experiments.
Knockdown of Jak3 expression caused cell death in IEC in the presence of IL-2.
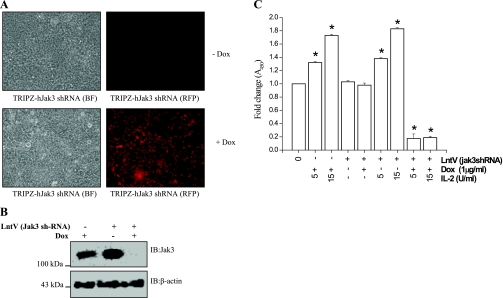
To examine whether decreased expression of Jak3 would affect cell proliferation or death, we used a tetracycline regulated system of Jak3-shRNA expression. Lentiviral-mediated transduction of pTRIPZ-sh-Jak3 was done in HT-29 CL-19A cells (as described in materials and methods). pTRIPZ-sh-Jak3 also contained RFP under a doxycycline regulated promoter for visualization in live cells. The expression of Jak3-sh-RNA in the transduced cells was induced by supplementing doxycycline in the growth media, as shown in Fig. 9A. Figure 9B further confirms the doxycycline regulation of Jak3-sh-RNA expression, and the downregulation of Jak3 protein. To determine the effect of Jak3 expression on IL-2-induced proliferation of HT-29 CL-19A cells, the cells were transduced with lentivirus for Jak3 sh-RNA in the presence of 1.0 μg/ml of doxycycline and treated with different concentrations of IL-2 for 72 h. Figure 9C shows that doxycycline alone had no effect on IL-2-induced cell proliferation and was comparable to normal wild-type HT-29 CL19A cells (Fig. 1B). Also, there was no effect of the lentivirus carrying Jak3 sh-RNA alone or in combination with doxycycline on proliferation in the absence of IL-2. However, when Jak3 was knocked down by doxycycline-regulated expression of Jak3 shRNA, IL-2 induced loss of cells at low concentrations (5 and 15 U/ml). Higher concentrations of IL-2 had similar effects (data not shown). These results suggest that the decrease in cell number caused by high concentrations of IL-2 was due to downregulation of Jak3 mRNA expression.
Fig. 9.
Knockdown of Jak3 expression promotes IEC cell death at lower concentration of IL-2: A: 5 × 10⁵HT-29Cl 19A cells were transduced with Lentiviruses containing Jak3-shRNA and red-fluorescent protein (RFP) under tetracycline regulated system. Induction of turbo-RFP/shRNA mir expression in transduced cells was done by growing the cells in presence of 1 μg/ml of doxycycline (bottom). B: Jak3 gene knockdown was also analyzed using Western analysis. Cell lyastes from control [cells treated with doxycycline (Dox) alone; lane 1] and cells transduced with lentivirus containing Jak3-shRNA grown in absence (lane 2) or presence (lane 3) of doxycycline were separated using SDS-PAGE and Western analysis of SDS-PAGE separated proteins were done using Jak3 antibody. C: 5 × 10³ of control cells (1st bar), cells treated with doxycycline alone (2nd and 3rd bar), and cells transduced with lentivirus containing Jak3-shRNA alone (4th bar, or IL-2 control as 5th bar) or grown in the absence (6th and 7th bar) or presence (8th and 9th bar) of doxycycline were cultured in a 96-well microtiter plate in a final volume of 100 μl/well culture medium in the presence of the indicated concentrations of IL-2. Cell proliferation was measured by QCPAK as in Fig. 1B. Values are means ± SE. *P < 0.05, statistically significant differences from untreated cells; n = 3 experiments. BF, bright field.
High concentrations of IL-2 promoted apoptosis through nuclear fragmentation and extracellular display of phosphatidylserine.
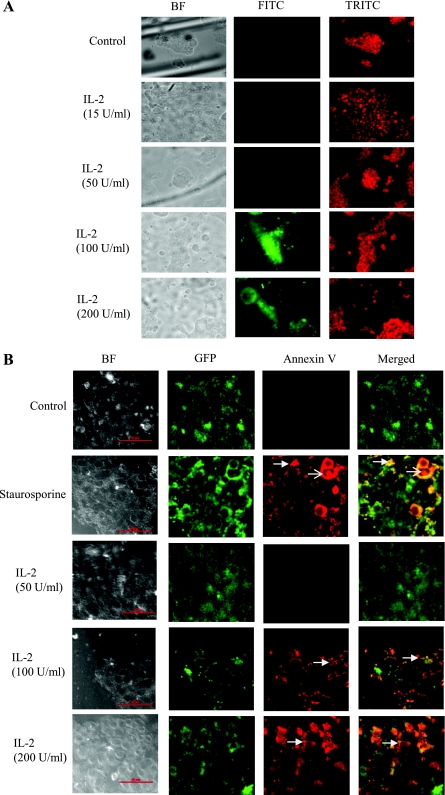
To investigate the mechanism of cell death at high concentrations of IL-2, we examined DNA fragmentation and annexin V binding to phosphatidylserine on the extracellular face of the plasma membrane as an indicator of apoptosis using FITC- and Cy3-conjugated antibodies, respectively. As shown in Fig. 10A, DNA fragmentation was not observed in control cells or cells treated with 15 or 50 U/ml IL-2, but cells treated with 100 or 200 U/ml demonstrated substantial DNA fragmentation. Figure 10A, right, shows the propidium iodide counterstaining for the total number of cells. Figure 10B shows that 100 or 200 U/ml IL-2 promoted PS display on the extracellular face of the plasma membrane, a hallmark of apoptotic cells, as indicated by annexin V binding to these surfaces. The apoptotic inducer staurosporine (positive control) showed similar results as 100 or 200 U/ml IL-2. On the other hand, control and 50 U/ml IL-2 showed no annexin V binding.
Fig. 10.
A: higher concentration of IL2 promotes apoptosis in intestinal epithelial cells: HT-29 Cl-19A cells were seeded on glass coverslips in a 24-well plate and were allowed to grow for 48 h followed by serum starvation for 12 h. Cells were treated with different concentrations of IL-2 for 12 h. Control and treated cells were fixed and stained using Apo-Brdu In-Situ DNA fragmentation assay kit (Biovision) as per manufacturer's protocol. Cells were visualized using Nikon TS-100 eclipse fluorescence microscope using FITC and TRITC filters. Green FITC staining shows DNA fragmentation, and red TRITC shows nuclear staining. Data represent 5 different fields from 3 independent experiments. B: higher concentration of IL-2 promotes apoptosis in intestinal epithelial cells: Apoptosis and necrosis in HT-29 Cl-19A cells were detected using a green fluorescence protein (GFP)-certified apoptosis/necrosis detection kit (Enzo Life Sciences). Cells grown on glass coverslips in the presence of lentivirus expressing GFP were treated with apoptotic inducer staurosporine or indicated concentrations of IL-2 for 16 h. Cells were then washed with PBS and incubated with apoptosis (annexin V-EnzoGold)/necrosis (DNA intercalating dye-7-AAD) dual detection reagent as per manufacturer's protocol and observed under a Nikon C1-plus confocal microscope with a dual filter set for cyanine-3/Far-red and a GFP/FITC filter. Shown in merged, healthy (green), apoptotic (orange/yellow membrane staining), and necrotic (red nuclear staining) cells. Scale bar = 50 μM; thick arrow, apoptotic cells; thin arrow, necrotic cell. Data represent 5 different fields from 3 independent experiments.
DISCUSSION
Mucosal homeostasis plays an essential role not only in intestinal restitution but also during normal IEC turnover (19). Although previous studies have supported a role for different growth factors including IL-2 in intestinal epithelial regeneration and cell survival, the specific signaling pathways regulated by IL-2 have not been well established. We (22) previously showed that IL-2 stimulated wound closure of IEC through activation of Jak3 and subsequent interactions with the cytoskeletal protein villin. In the present study, we investigated the mechanisms by which IL-2 regulates IEC homeostasis. Interestingly, IL-2 stimulated cell proliferation in a dose-dependent manner up to 10 to 50 U/ml, but higher doses (70 to 100 U/ml) caused a decrease in cell number (Fig. 1). Previous studies (6, 34) showed that supplementing IL-2 in FBS-containing growth media promoted proliferation even at a lower concentration in BN cells, while a biphasic effect was observed in a similar concentration range in IEC 6 cells. This raises the question as to the physiologic levels of IL-2 that might occur in the intestines. IL-2 has been reported to be increased in IBD: direct estimation of IL-2 in biopsy samples from normal individuals varied from 0–9 U/ml, while samples from IBD patients varied from 0–20 U/ml (3). However, it was also reported that although the LPMC were doubled in IBD patients, lower levels of IL-2 activity were produced by the LPMC (39). IL-2 was also decreased in the intestinal mucosa of patients with IBD (23) and in peripheral blood mononuclear cells of patients with Crohn's disease (CD; Ref. 31). In addition, one study (3) demonstrated a tendency toward higher IL-2 concentrations in patients with ulcerative colitis (UC) compared with patients with CD. This may contribute to the finding that patients with UC who are unresponsive to corticosteroid therapy are good candidates for immunosuppressive treatment with cyclosporin A (CSA), a cyclic peptide that exerts an immunosuppressive effect by inhibiting IL-2 production (21). Although significant clinical improvement was achieved in CSA-treated patients compared with placebo, several adverse effects including paresthesias and hypertension were observed (21, 26, 46). These effects may be due to high IL-2 levels in UC patients. Our data suggest that high IL-2 levels may pose an apoptotic threat to intestinal mucosa and thereby compromise its homeostasis. CSA treatment could lower IL-2 levels and reduce mucosal apoptosis. Compared with UC, CSA treatment in chronic active CD did not offer an advantage compared with low dose steroid as reported in a multicenter, double blind, and placebo-controlled trial in 182 CD patients (45). This may be related to the finding that appreciable, but lower levels of IL-2 activity were produced by LPMC from IBD-affected mucosa compared with control when the IBD patients consisted of mostly active CD patients (39). Since IL-2 levels may already be low in CD patients (31), using CSA to lower it further might not be beneficial for mucosal homeostasis. Different studies have shown that the expression of IL-2 was either increased or decreased in IBD patients compared with healthy controls; our data suggest that either of these conditions could lead to a disruption in mucosal homeostasis. IL-2 concentrations have also been reported to vary depending on the way the LPMC were activated. When LPMC were isolated from intestinal biopsies and activated in vitro using phytohaemaglutinin, they produced IL-2 in the range of 0–20 U/ml. However, when LPMC were not separated from other tissues in biopsy samples and were stimulated in vitro using phytohaemaglutinin, the control and IBD patient samples both showed production of IL-2 that varied from 190–300 U/ml (39). Thus there is a great deal of inconsistency in studies reporting in vivo measurement of IL-2 protein and mRNA that may be due to differences in methodological approaches (20). The free IL-2 levels measured by these methods were influenced by different factors including 1) the concentration of activated lymphocytes in the overall LPMC, 2) the level of expression of IL-2 receptors on the surface of activated lymphocytes regulating enhanced consumption of IL-2 by these cells, and 3) the concentration of soluble IL-2 receptors (sIL-2R) shed by activated lymphocytes that neutralize free IL-2 (28). The epithelial cells of the mucosa could encounter a varied concentration of free IL-2 depending on each of these factors. We showed that IL-2 alone could have opposing effects on the proliferation of IEC, where it promoted proliferation at low concentrations (≤50 U/ml) but induced cell death at high concentrations. Breaches in epithelial lining led to the loss of IEC polarity (dedifferentiation) at the margin of the wound (5, 19), and rapid repair was achieved through paired mechanisms acting at both the basolateral and apical surfaces (38). We observed that during the proliferative mode apical and basolateral stimulation by IL-2 had similar effects in IEC lines, which might be due to the dedifferentiated nature of these cells where IL-2 receptors might not be fully compartmentalized.
To investigate how low concentrations of IL-2 induced proliferation while high concentrations induced cell death, we examined the signaling pathways activated by IL-2. In our previous study (22), we showed that IL-2 (≤50 U/ml) stimulated IEC wound closure through mechanisms involving tyrosine phosphorylation of Jak3. The present study showed that the same concentration of IL-2 also supported IEC proliferation where Jak3 specifically interacted with the adapter protein p52-ShcA in an IL-2-dependent manner, and these interactions took place only at concentrations when the IEC were in the proliferative mode (Figs. 1 and 2). Our data showed that Jak3, which was in complex with ShcA, was also tyrosine phosphorylated. At higher doses, when IECs were not proliferating, the interactions between Jak3 and p52ShcA were lost, which correlated with decreased phosphorylation of Jak3 and p52ShcA (Fig. 3). Although ShcA has been reported to be involved in cell proliferation of IEC (36), its role during IL-2-mediated IEC homeostasis was not known. The CH1 domain of p52ShcA might be responsible for these interactions since this domain was tyrosine-phosphorylated upon engagement with different cell surface receptors (12). Another study showed IL-2 induced phosphorylation of p52shcA on both tyrosine and serine residues, and maximum phosphorylation was observed within 5 min after IL-2 stimulation of T-lymphocytes (41). In contrast, we showed that IL-2-stimulated tyrosine phosphorylation of p52ShcA in IEC peaked at ∼120 min and was sustained up to 360 min. We previously reported that IL-2 stimulation led to tyrosine phosphorylation of Jak3 with maximum phosphorylation at 15 min followed by a later loss of phosphorylation (22). We speculate that p52ShcA could be a direct cellular substrate of Jak3 in IEC in the initial stage of IL-2 stimulation, but the later extended phosphorylation was due to the activation of other kinases. The reverse immunoprecipitation studies further confirmed that p52ShcA was tyrosine phosphorylated by IL-2 and that higher concentrations of IL-2 promoted dephosphorylation of this protein and Jak3 (Fig. 3). In Fig. 4, we showed that p52ShcA was dephosphorylated by the protein tyrosine phosphatase SHP-1, while the phosphatases SHP-2 and PTP-1B had no effect on phosphorylated p52ShcA. However, it remains to be investigated if IL-2 affected the expression or activation of SHP-1.
Previously, we (22) reported that Jak3 phosphorylation led to its membrane localization and the present study confirmed that finding, albeit with low-dose IL-2 (Fig. 5A). Higher concentrations of IL-2 induced redistribution of Jak3 to the nucleus. The reason for nuclear localization of Jak3 is unclear at this point, but this suggests interactions between Jak3 and an as yet unidentified nuclear targeting protein. Nuclear localization of Jak3 appeared to be prominent in cells with either dual nuclei (dividing cells) or nuclear fragments (apoptotic cells). Cell fractionation studies confirmed nuclear localization of Jak3 at high doses of IL-2 (Fig. 5B) while the purity of samples was confirmed through Western analysis using a phospho-specific antibody against STAT3. It has previously been shown (15) that STAT3 is phosphorylated during IL-2 activation, and phosphorylated STAT3 dimerizes and translocates to the nucleus. Our data showed that while the phosphorylated STAT3 was detected upon IL-2 stimulation and the monomer forms of phosphorylated STAT were present in the cytoplasmic fraction, the dimers were present only in the nuclear fraction (Fig. 5C).
To demonstrate the role of p52-ShcA transcription we showed that mRNA expression of p52-ShcA was increased in IEC treated with low-dose IL-2 and correlated with a proliferative response (Figs. 1 and 6). The adapter protein p52-ShcA has been reported to influence proliferation in smooth muscle cells (42) and epithelial cells (47). Also, p52/46 ShcA-induced Ras activation has been linked to growth and proliferation (30). Our study shows that at higher IL-2 concentrations the expression of p52ShcA mRNA increased while the expression of Jak3 mRNA decreased, and this correlated with apoptosis (Fig. 10A–B). Despite the fact that the phosphorylation of ShcA and Jak3 were rapid upon IL-2 treatment (0–15 min), changes in mRNA for these proteins were seen after 12 h of IL-2 treatment. Thus long-term moderate concentrations of IL-2 (≤ 50 U/ml) balanced the mRNA expression of p52-Shc and Jak3 in such a way that resulted in extended steady state levels of p52-Shc phosphorylation (Fig. 3). Constitutive overexpression of ShcA potentiated IL-2 induced proliferation, while constitutive overexpression of Jak3 led to increased proliferation in response to IL-2 at both low and high concentrations (Figs. 7 and 8). Constitutive Jak3 overexpression also protected IEC from higher IL-2-induced cell death. On the other hand, knockdown of either of these genes resulted in increased sensitivity to IL-2-induced cell death. This could be correlated with previous work (32) in mice where knockout of Jak3 expression in mice led to increased susceptibility towards mucosal inflammation and IBD (32).
Apart from playing a role in mucosal homeostasis IL-2 may also be implicated in IBD-associated colorectal cancer. Natural killer (NK) and lymphokine activated killer (LAK) cells are involved in immune surveillance including anti-neoplastic actions. However, minimal mucosal NK cell activity was found in LPMC from IBD-affected mucosa where the patient populations were mainly CD. In vitro culture of LPMC from these patients in the presence of IL-2 generated LAK/NK cells that mediated a high level of killing activity against neoplastic epithelial cells that was comparable to normal controls (16). Since IBD patients also have appreciably reduced IL-2 (23, 39), the reduced IL-2 activity may be correlated to IBD-associated colorectal cancer due to impairment of immune surveillance including antineoplastic actions by these killer cells.
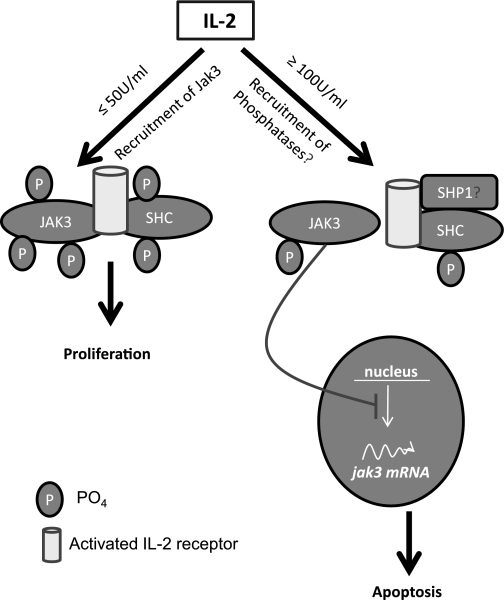
In summary, our results demonstrate that IL-2 regulates IEC homeostasis through mechanisms involving p52-ShcA and Jak3. The concentration-dependent effects on phosphorylation-dephosphorylation and transcription of p52-ShcA (upregulated) and Jak3 (downregulated) may contribute to the opposite effects on proliferation and apoptosis observed at different doses (Fig. 11). These findings corroborate our previous findings and the hypothesis that IL-2 plays an essential role not only during mucosal wound repair through cell migration (22) but also during mucosal homeostasis following wound repair by regulating the cell proliferation and cell death of IEC. Different reports compiled in a databank show that although ∼728 genes are either upregulated or downregulated in different cell types by IL-2 (http://www.netpath.org/pathways?path_id=NetPath_14), the present study is the first report that shows Jak3 and p52-ShcA regulation by IL-2 and its relevance in intestinal epithelial cell homeostasis.
Fig. 11.
Proposed model of IL-2-induced intestinal epithelial homeostasis. At lower concentrations, IL-2 promoted tyrosine phosphorylation-dependent interactions between Jak3 and p52ShcA leading to increased proliferation (27). A higher concentration could recruit phosphatases (e.g., SHP1) at this complex through Shc leading to decrease in phosphorylation and disruption of this complex. Less phosphorylated form of Jak3 translocates to the nucleus inhibiting (possibly the transcription factor responsible) its own transcription and hence downregulation of jak3-mRNA leading to higher IL-2-induced apoptosis in IEC. Nuclear targeted Jak3 might also influence the transcription factors for Shc expression.
GRANTS
The work was supported by grants from Crohn's & Colitis Foundation of America (CCFA Ref. No. 1351 and 2188) and National Institutes of Health Grants DK-081661 (to N. Kumar) and HL-094366 (to C. M. Waters).
DISCLOSURES
No conflicts of interest, financial or otherwise, are declared by the author(s).
AUTHOR CONTRIBUTIONS
Author contributions: J.M. performed experiments; J.M., C.M.W., and N.K. analyzed data; J.M., C.M.W., and N.K. interpreted results of experiments; J.M. prepared figures; J.M., C.M.W., and N.K. approved final version of manuscript; C.M.W. and N.K. edited and revised manuscript; N.K. conception and design of research; N.K. drafted manuscript.
ACKNOWLEDGMENTS
We greatly appreciate the gift of Jak3 cDNA from Dr. Leslie J. Berg (University of Massachusetts Medical School, Boston, MA).
REFERENCES
- 1.Blais A, Aymard P, Lacour B. Paracellular calcium transport across Caco-2 and HT29 cell monolayers. Pflügers Arch 434: 300–305, 1997 [DOI] [PubMed] [Google Scholar]
- 2.Brunton VG, MacPherson IR, Frame MC. Cell adhesion receptors, tyrosine kinases and actin modulators: a complex three-way circuitry. Biochim Biophys Acta 1692: 121–144, 2004 [DOI] [PubMed] [Google Scholar]
- 3.Brynskov J, Tvede N, Andersen CB, Vilien M. Increased concentrations of interleukin 1 beta, interleukin-2, and soluble interleukin-2 receptors in endoscopical mucosal biopsy specimens with active inflammatory bowel disease. Gut 33: 55–58, 1992 [DOI] [PMC free article] [PubMed] [Google Scholar]
- 4.Burchill MA, Yang J, Vang KB, Farrar MA. Interleukin-2 receptor signaling in regulatory T cell development and homeostasis. Immunol Lett 114: 1–8, 2007 [DOI] [PMC free article] [PubMed] [Google Scholar]
- 5.Cancelas JA, Jansen M, Williams DA. The role of chemokine activation of Rac GTPases in hematopoietic stem cell marrow homing, retention, and peripheral mobilization. Exp Hematol 34: 976–985, 2006 [DOI] [PubMed] [Google Scholar]
- 6.Ciacci C, Mahida YR, Dignass A, Koizumi M, Podolsky DK. Functional interleukin-2 receptors on intestinal epithelial cells. J Clin Invest 92: 527–532, 1993 [DOI] [PMC free article] [PubMed] [Google Scholar]
- 7.Creamer B, Shorter RG, Bamforth J. The turnover and shedding of epithelial cells. I. The turnover in the gastro-intestinal tract. Gut 2: 110–118, 1961 [DOI] [PMC free article] [PubMed] [Google Scholar]
- 8.Dahan S, Roth-Walter F, Arnaboldi P, Agarwal S, Mayer L. Epithelia: lymphocyte interactions in the gut. Immunol Rev 215: 243–253, 2007 [DOI] [PMC free article] [PubMed] [Google Scholar]
- 9.de Villiers WJ, Varilek GW, de Beer FC, Guo JT, Kindy MS. Increased serum amyloid a levels reflect colitis severity and precede amyloid formation in IL-2 knockout mice. Cytokine 12: 1337–1347, 2000 [DOI] [PubMed] [Google Scholar]
- 10.Dignass AU, Podolsky DK. Interleukin 2 modulates intestinal epithelial cell function in vitro. Exp Cell Res 225: 422–429, 1996 [DOI] [PubMed] [Google Scholar]
- 11.Ehrhardt RO, Ludviksson BR. When immunization leads to autoimmunity: chronic inflammation as a result of thymic and mucosal dysregulation in IL-2 knock-out mice. Int Rev Immunol 18: 591–612, 1999 [DOI] [PubMed] [Google Scholar]
- 12.Entschladen F, Zanker KS. Locomotion of tumor cells: a molecular comparison to migrating pre- and postmitotic leukocytes. J Cancer Res Clin Oncol 126: 671–681, 2000 [DOI] [PubMed] [Google Scholar]
- 13.Forgue-Lafitte ME, Coudray AM, Breant B, Mester J. Proliferation of the human colon carcinoma cell line HT29: autocrine growth and deregulated expression of the c-myc oncogene. Cancer Res 49: 6566–6571, 1989 [PubMed] [Google Scholar]
- 14.Frangioni JV, Beahm PH, Shifrin V, Jost CA, Neel BG. The nontransmembrane tyrosine phosphatase PTP-1B localizes to the endoplasmic reticulum via its 35 amino acid C-terminal sequence. Cell 68: 545–560, 1992 [DOI] [PubMed] [Google Scholar]
- 15.Heldin CH, Westermark B. Mechanism of action and in vivo role of platelet-derived growth factor. Physiol Rev 79: 1283–1316, 1999 [DOI] [PubMed] [Google Scholar]
- 16.Hogan PG, Gibson PR, Hapel AJ, Doe WF. Intestinal lymphokine-activated killer cells in inflammatory bowel disease. J Gastroenterol Hepatol 6: 455–460, 1991 [DOI] [PubMed] [Google Scholar]
- 17.Ivanov AI, Parkos CA, Nusrat A. Cytoskeletal regulation of epithelial barrier function during inflammation. Am J Pathol 177: 512–524, 2010 [DOI] [PMC free article] [PubMed] [Google Scholar]
- 18.Jiao H, Berrada K, Yang W, Tabrizi M, Platanias LC, Yi T. Direct association with and dephosphorylation of Jak2 kinase by the SH2-domain-containing protein tyrosine phosphatase SHP-1. Mol Cell Biol 16: 6985–6992, 1996 [DOI] [PMC free article] [PubMed] [Google Scholar]
- 19.Karrasch T, Jobin C. Wound healing responses at the gastrointestinal epithelium: a close look at novel regulatory factors and investigative approaches. Z Gastroenterol 47: 1221–1229, 2009 [DOI] [PubMed] [Google Scholar]
- 20.Kmiec Z. Cytokines in inflammatory bowel disease. Arch Immunol Ther Exp (Warsz) 46: 143–155, 1998 [PubMed] [Google Scholar]
- 21.Kornbluth A, Present DH, Lichtiger S, Hanauer S. Cyclosporin for severe ulcerative colitis: a user's guide. Am J Gastroenterol 92: 1424–1428, 1997 [PubMed] [Google Scholar]
- 22.Kumar N, Mishra J, Narang VS, Waters CM. Janus kinase 3 regulates interleukin 2-induced mucosal wound repair through tyrosine phosphorylation of villin. J Biol Chem 282: 30341–30345, 2007 [DOI] [PubMed] [Google Scholar]
- 23.Kusugami K, Matsuura T, West GA, Youngman KR, Rachmilewitz D, Fiocchi C. Loss of interleukin-2-producing intestinal CD4+ T cells in inflammatory bowel disease. Gastroenterology 101: 1594–1605, 1991 [DOI] [PubMed] [Google Scholar]
- 24.Lavagna C, Strup C, Rampal A, Hofman P, Bardon S, Rampal P, Poiree JC. Immunolocalization of a new intestinal antiproliferative factor in human intestinal epithelial cells. Dig Dis Sci 47: 2446–2453, 2002 [DOI] [PubMed] [Google Scholar]
- 25.Li M, Cuff CF, Pestka JJ. T-2 toxin impairment of enteric reovirus clearance in the mouse associated with suppressed immunoglobulin and IFN-gamma responses. Toxicol Appl Pharmacol 217: 76–85, 2006 [DOI] [PMC free article] [PubMed] [Google Scholar]
- 26.Lichtiger S, Present DH, Kornbluth A, Gelernt I, Bauer J, Galler G, Michelassi F, Hanauer S. Cyclosporine in severe ulcerative colitis refractory to steroid therapy. N Engl J Med 330: 1841–1845, 1994 [DOI] [PubMed] [Google Scholar]
- 27.Lin JX, Leonard WJ. Signaling from the IL-2 receptor to the nucleus. Cytokine Growth Factor Rev 8: 313–332, 1997 [DOI] [PubMed] [Google Scholar]
- 28.Mahida YR, Gallagher A, Kurlak L, Hawkey CJ. Plasma and tissue interleukin-2 receptor levels in inflammatory bowel disease. Clin Exp Immunol 82: 75–80, 1990 [DOI] [PMC free article] [PubMed] [Google Scholar]
- 29.Melgar S, Yeung MM, Bas A, Forsberg G, Suhr O, Oberg A, Hammarstrom S, Danielsson A, Hammarstrom ML. Overexpression of interleukin 10 in mucosal T cells of patients with active ulcerative colitis. Clin Exp Immunol 134: 127–137, 2003 [DOI] [PMC free article] [PubMed] [Google Scholar]
- 30.Mitic LL, Anderson JM. Molecular architecture of tight junctions. Annu Rev Physiol 60: 121–142, 1998 [DOI] [PubMed] [Google Scholar]
- 31.Miura M, Hiwatashi N. Cytokine production in inflammatory bowel disease. J Clin Lab Immunol 18: 81–86, 1985 [PubMed] [Google Scholar]
- 32.Murata Y, Yamashita A, Saito T, Sugamura K, Hamuro J. The conversion of redox status of peritoneal macrophages during pathological progression of spontaneous inflammatory bowel disease in Janus family tyrosine kinase 3(−/−) and IL-2 receptor gamma(−/−) mice. Int Immunol 14: 627–636, 2002 [DOI] [PubMed] [Google Scholar]
- 33.O′Connor PM, Nieves-Neira W, Kerrigan D, Bertrand R, Goldman J, Kohn KW, Pommier Y. S-phase population analysis does not correlate with the cytotoxicity of camptothecin and 10,11-methylenedioxycamptothecin in human colon carcinoma HT-29 cells. Cancer Commun 3: 233–240, 1991 [DOI] [PubMed] [Google Scholar]
- 34.O′Loughlin EV, Pang GP, Noltorp R, Koina C, Batey R, Clancy R. Interleukin 2 modulates ion secretion and cell proliferation in cultured human small intestinal enterocytes. Gut 49: 636–643, 2001 [DOI] [PMC free article] [PubMed] [Google Scholar]
- 35.O'Reilly AM, Pluskey S, Shoelson SE, Neel BG. Activated mutants of SHP-2 preferentially induce elongation of Xenopus animal caps. Mol Cell Biol 20: 299–311, 2000 [DOI] [PMC free article] [PubMed] [Google Scholar]
- 36.Parsons JT, Martin KH, Slack JK, Taylor JM, Weed SA. Focal adhesion kinase: a regulator of focal adhesion dynamics and cell movement. Oncogene 19: 5606–5613, 2000 [DOI] [PubMed] [Google Scholar]
- 37.Plutzky J, Neel BG, Rosenberg RD. Isolation of a src homology 2-containing tyrosine phosphatase. Proc Natl Acad Sci USA 89: 1123–1127, 1992 [DOI] [PMC free article] [PubMed] [Google Scholar]
- 38.Podolsky DK. Healing the epithelium: solving the problem from two sides. J Gastroenterol 32: 122–126, 1997 [DOI] [PubMed] [Google Scholar]
- 39.Pullman WE, Doe WF. IL-2 production by intestinal lamina propria cells in normal inflamed and cancer-bearing colons. Clin Exp Immunol 88: 132–137, 1992 [DOI] [PMC free article] [PubMed] [Google Scholar]
- 40.Reinecker HC, Podolsky DK. Human intestinal epithelial cells express functional cytokine receptors sharing the common gamma c chain of the interleukin 2 receptor. Proc Natl Acad Sci USA 92: 8353–8357, 1995 [DOI] [PMC free article] [PubMed] [Google Scholar]
- 41.Reynolds AJ, Bartlett SE, Hendry IA. Molecular mechanisms regulating the retrograde axonal transport of neurotrophins. Brain Res Brain Res Rev 33: 169–178, 2000 [DOI] [PubMed] [Google Scholar]
- 42.Rozengurt E. Signal transduction pathways in the mitogenic response to G protein-coupled neuropeptide receptor agonists. J Cell Physiol 177: 507–517, 1998 [DOI] [PubMed] [Google Scholar]
- 43.Sadlack B, Merz H, Schorle H, Schimpl A, Feller AC, Horak I. Ulcerative colitis-like disease in mice with a disrupted interleukin-2 gene. Cell 75: 253–261, 1993 [DOI] [PubMed] [Google Scholar]
- 44.Song E, Chen J, Antus B, Wang M, Xie Y, Yao H, Exton MS. Interleukin-2 enhances susceptibility of colon cancer cells to FasR mediated apoptosis by upregulating Fas receptor level and downregulating FAP-1 expression. Int J Immunopathol Pharmacol 13: 113–122, 2000 [PubMed] [Google Scholar]
- 45.Stange EF, Modigliani R, Pena AS, Wood AJ, Feutren G, Smith PR. European trial of cyclosporine in chronic active Crohn's disease: a 12-month study. The European Study Group. Gastroenterology 109: 774–782, 1995 [DOI] [PubMed] [Google Scholar]
- 46.Sternthal MB, Murphy SJ, George J, Kornbluth A, Lichtiger S, Present DH. Adverse events associated with the use of cyclosporine in patients with inflammatory bowel disease. Am J Gastroenterol 103: 937–943, 2008 [DOI] [PubMed] [Google Scholar]
- 47.Stice LL, Vaziri C, Faller DV. Regulation of platelet-derived growth factor signaling by activated p21Ras. Front Biosci 4: D72–86, 1999 [DOI] [PubMed] [Google Scholar]
- 48.Tena JG, Manzano L, Leal JC, Antonio ES, Sualdea V, Alvarez-Mon M. Distinctive pattern of cytokine production and adhesion molecule expression in peripheral blood memory CD4(+) t cells from patients with active Crohn's disease. J Clin Immunol 2006 [DOI] [PubMed] [Google Scholar]
- 49.Wang S, Evers BM. Caco-2 cell differentiation is associated with a decrease in stat protein levels and binding. J Gastrointest Surg 3: 200–207, 1999 [DOI] [PubMed] [Google Scholar]
- 50.Zimmerman NP, Vongsa RA, Wendt MK, Dwinell MB. Chemokines and chemokine receptors in mucosal homeostasis at the intestinal epithelial barrier in inflammatory bowel disease. Inflamm Bowel Dis 14: 1000–1011, 2008 [DOI] [PMC free article] [PubMed] [Google Scholar]


