

Abstract
Computers are organized into hardware and software. Using a theoretical approach to identify patterns in gene expression in a variety of species, organs, and cell types, we found that biological systems similarly are comprised of a relatively unchanging hardware-like gene pattern. Orthogonal patterns of software-like transcripts vary greatly, even among tumors of the same type from different individuals. Two distinguishable classes could be identified within the hardware-like component: those transcripts that are highly expressed and stable and an adaptable subset with lower expression that respond to external stimuli. Importantly, we demonstrate that this structure is conserved across organisms. Deletions of transcripts from the highly stable core are predicted to result in cell mortality. The approach provides a conceptual thermodynamic-like framework for the analysis of gene-expression levels and networks and their variations in diseased cells.
Keywords: disease patterns, firmware, genomics, surprisal analysis, thermodynamic analysis
In biological studies, gene-expression networks are interrogated routinely to recognize transcripts and pathways that vary significantly upon experimental manipulation or among samples displaying distinct phenotypes. Identifying the significance of variation requires a definition and understanding of transcripts whose expression levels are steady and therefore can serve as a baseline from which the change is measured. We expect that the baseline includes the transcripts often referred to as “housekeeping genes,” the genes that maintain the basic cellular function. However, many familiar housekeeping genes vary significantly under different experimental conditions (1), complicating their utility as a baseline for gene-expression studies and calling into question our understanding of their cellular function. We use a thermodynamic-like theoretical approach to identify a set of steady-state genes in living cells. These genes define the stable baseline. Interestingly, two distinguishable groups could be resolved within this “steady” set of transcripts: genes that are highly expressed, stable, and robust and a flexible subset with lower expression levels that can vary depending on the experimental manipulations and are subject to epigenetic transformations. Importantly, we demonstrate that this structure is conserved across organisms.
The set of steady transcripts is reminiscent of what is called “firmware” in electronic systems and computing. Firmware enables the very basic functioning of a consumer electronic device.
The devices it enables can range in complexity from washing machines or remote controllers of TV sets to smart mobile phones. Engineers discern two classes that make up firmware: low-level firmware, which is part of the hardware of the device, and high-level firmware, the operational instructions that reside in the device. These two levels are analogous to the two classes, housekeeping and signaling, that we identify within the steady set of genes.
The analogy perhaps can be extended further, because it is possible, from the outside, to induce the high-level firmware to reprogram itself and thereby provide additional applications or to express hitherto hidden functionalities of the device, such as the switch to glycolysis (2) in cancerous cells. Furthermore, landmark studies have demonstrated a corresponding and newly recognized plasticity in mammalian cells: Like firmware, gene networks in a differentiated cell can be induced by extrinsic influences, including transcription factors and small molecules, to alter their normal state, reprogram to an embryonic-like state, and perform hitherto hidden functions. On the other hand, changes in the housekeeping genes are expected to be lethal. This feature, too, is reminiscent of electronic devices.
To complement the set of transcripts that constitute the steady pattern, we characterize the transcription patterns underlying the process of oncogenic transformation and other changes in biological processes. The expression levels of the transcripts that belong to these patterns vary significantly in different types of cancers and among different patients who have the same type of cancer. The dramatic variations among patients who have the same disease have clear implications for translation and personalized medicine. At the same time, we show that these variations are minor compared with the level of expression of the stable transcripts. It is possible to extend the computer analogy and relate software to those easily modified and personalized transcription patterns that describe the biological change.
A pattern is a set of genes whose expression levels do not vary with time, as in the steady state, or that vary in concert (i.e., all the transcription levels are time-dependent in the same way).
The analogy that we make with computer architecture is complementary to the well-developed characterization of local motifs in transcription networks (3, 4). The aim in characterizing local motifs is to discern connections between a few genes that act like simple logic gates. Here, instead, we examine the flow of information in the whole genome to identify large groups of transcripts that act in concert. There are other important methods that analyze expression level changes in the cellular process (5). Many are local (i.e., bottom up), such as the Bayesian methods based on elucidating the relationships between a few genes at a time (6–11). The approaches based on information theory that rely on the concept of statistical entropy (8–10, 12) differ from the present work in that we use thermodynamics to define the physical entropy, the free energy of the transcripts, and thereby the steady state. Reverse-engineering algorithms based on chemical kinetic-like differential equations identify causal interactions through the rate constants of mutual influence (11, 13–17). Tree-based methods of clustering (18, 19) and connectivity in graphs (20) are similar to the more global point of view that we use. All the studies successfully infer gene networks from particular datasets and are able to follow the most significant changes in the biological system (21). We suggest that only by identifying what is stable (1) can we truly understand the significance of variation. Hence we begin by using gene-expression profiling to find the free energy of transcripts at the steady state and the time-evolving deviations in gene expressions caused by the disease or perturbation. By using thermodynamics, we can relate the physical idea of “work” to the expression levels of genes. This approach thus allows us to determine a steady state that is almost invariant across organisms (Experimental Procedures and refs. 22 and 23). Posttranslation factors and other elements also are important and are not yet included in our analysis that looks at the expression levels from mRNA microarrays.
The stable steady state provides more than a reference. Using available experimental data, we validate the claim that highly expressed or very stable transcripts are the most functionally connected. The dependence of the network connectivity on transcript stability provides quantitative thermodynamic support for the theory of general robustness of biological networks (24).
Results
Steady and Time-Varying Parts of the Expression Level of Transcript.
We consider evolving biological systems that have been measured at several time points or stages along the process and in which there is a change between two measurements. We analyze the change over time in the natural logarithm of the expression level (i.e., the fold value) of each transcript. The method we use to represent the changing values of the expression levels is known as “surprisal analysis” (25, 26). Surprisal analysis also is able to determine how many transcripts really contribute to a particular biological process. Explicit applications to changes in the evolution toward cancer are reported in refs. 22 and 23. Surprisal analysis as outlined in Experimental Procedures, Box 1 in particular, represents the fold value as a sum of two types of contributions: a steady state that is the time-invariant part of the expression level and a time-varying contribution reflecting the change.
Box 1. Surprisal Analysis Defines the Steady State.
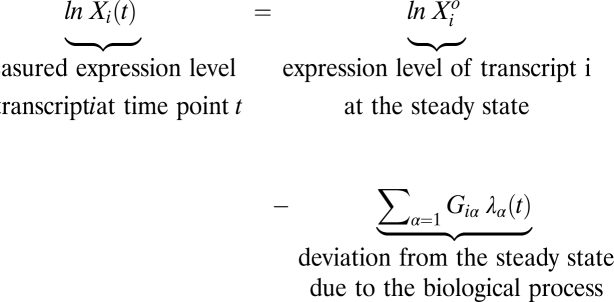 |
In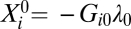 the fold level of transcript i at the steady state α = 0. λ0 does not depend on time. In refs. 22 and 23 we provide full details on how the steady state and the values of λα(t) and of the transcription patterns Giα are determined from the measured values of the expression levels Xi(t) of different genes.
Perturbing Steady-State Transcription Levels.
Surprisal analysis relates the fold change in the expression level of a transcript to the work done by the ongoing biological process. We thereby explain why the steady-state pattern is exceptionally stable.
The free energy of the transcript i at the steady state, measured in units of the thermal energy kT, is denoted as −Gi0λ0. λ0 is the weight of the steady-state pattern, common to all the transcripts. Gi0 is the contribution of transcript i in the steady state (Experimental Procedures, Box 1). By comparing these values with the values −Giαλα, which describe the work done by a disease pattern α on the transcript i, we show that the steady state is robust.
Fig. 1 shows an explicit example (22) taken from the cellular cancer model system WI-38 (27). This cellular system includes 12 stages of cancer development in which genetic alterations were applied (SI Appendix, Fig. S4). The gene-expression level for each transcript, Xi(t), was measured at time t for a series of 12 time points (27). This system did not develop continuously from one point to the next; therefore we divided it into several trajectories that go through different time points (SI Appendix, Fig. S4). For example, trajectories 156 and 15781012 share a common process up to and including point 5. Examination of the −Gi0λ0 and −Giαλα values of different trajectories in the WI-38 system revealed that for most transcripts the values of the free energy −Gi0λ0 are lower than the free energy changes, −Giα = 1λα = 1, because of the main pattern of the disease. Fig. 1 suggests that the steady state is very stable and that the process of transformation changes the free energy balance of the steady state only slightly. The robustness of the steady state of the cell, as shown in Fig. 1, was identified in healthy cells, such as TGF-β–treated hematopoietic stem cells and dendritic differentiated cells; in different types of malignant cells, including lung adenocarcinoma A549 cells treated for up to 72 h with TGF-β to induce epithelial–mesenchymal transition (EMT) (28); in three different disease stages of primary renal, colon, and prostate tumor-development processes from multiple distinct patients; and across organisms, as seen in phenelzine-treated Saccharomyces cerevisiae (29) and in the development of three disease stages of carcinoma in 31 mice (30). For additional examples, see SI Appendix, Figs S1 and S2. For a more detailed description of the experimental studies reported in the manuscript, see SI Appendix, Text.
Fig. 1.

Histogram of free energy values in units of the thermal energy kT of the transcripts at the steady-state Gi0λ0 and the work done by the major transcription pattern (α =1, Gi1λ1) at time point 8 in the trajectory 15781012 (in the middle of the transformation process) for the WI-38 cancer model (27). The values of Gi0λ0 and Gi1λ1 are distributed in a bell-shaped manner around a finite negative number and around zero, respectively.
Robustness of the Steady State.
The essence of the robustness of the steady state is the inequality in the weights of the transcripts
The separation of fold magnitudes implies that the free energy of the transcripts in the steady state is more than an order of magnitude larger than the perturbations of the free energy of the transcripts caused by disease. Explicit results are shown in SI Appendix, Tables S1 and S2, in which the transcription patterns are numbered in decreasing order of importance: λ0 ≥ λ1 ≥ λ2 ≥.
Durable Core of the Steady State.
Robustness also has an implication for the expression levels of particular genes. The global manifestation is expressed by the inequality in Eq. 1; namely, the weight of the steady transcription pattern is significantly larger than the weights of the disease-induced patterns. The second manifestation applies at the level of the individual transcripts and defines the set of more durable core transcripts that have the lowest of the low Gi0 values. For such exceptionally stable transcripts i one has the inequality Gi0λ0 >> Giαλα, α = 1, 2, … . On the other hand, for steady-state transcripts with a weight near zero (i.e, transcripts that have higher free energy), the change in the free energy caused by the disease can be significant (Fig. 1). Depending on the sign of the work done by the disease, Giαλα, the fold change in these more adaptable transcripts can either destabilize the transcript completely or make it significantly more stable. We suggest that, unlike low-energy transcripts that generate a connected stable network, the degree and structure of the network of unstable transcripts is temporal and is somewhat dependent on stimuli and available partners.
Conservation of the Steady-State Pattern in Different Cells and Organisms.
The distribution of the Gi0 values among the cellular functional modules remains essentially the same in the steady-state pattern of the different cellular models, such as TGF-β–treated lung cancer cells (28), WI-38 transformed fibroblasts (27), HPV16 immortalized keratinocytes from four different stages of transformation (31), the renal carcinoma metastatic model (32), TGF-β–treated hematopoietic stem cells, and dendritic differentiated cells (33). The detailed analysis of the distribution among functional groups is provided in SI Appendix, Text Section 2.
The most stable transcripts (i.e., the core transcripts with the lowest values of Gi0 discussed above) usually include ribosome, protein translation, and energy pathways modules (see, for example, SI Appendix, Tables S3, S7, S10, and S11). The transcripts with mid Gi0 values participate in the cell cycle and DNA/RNA metabolism (SI Appendix, Tables S8 and S12). The adaptable, most easily modified, transcripts, those with the highest Gi0 values, usually participate in signal transduction, morphogenesis, and cell communication modules (SI Appendix, Tables S9 and S13). It is important to note that the majority of the transcripts have mid Gi0 values (see, for example, Fig. 1 and SI Appendix, Fig. S3).
Quantifying the Conservation of the Steady-State Pattern in Different Cells.
A number of distinct experimental trajectories have been measured for the WI-38 cancer model. These trajectories include the development of normal cells (trajectory 134), immortalization (trajectory 156), and cancer development (trajectory 15781012) (see refs. 22 and 23 and SI Appendix, Fig. S4 for more details). We make a quantitative comparison of the steady-state expression in different trajectories using the notion of dissimilarity discussed in Experimental Procedures
Box 3. We make the comparisons by calculating the overlap of two different vectors: 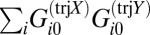 for the trajectories X and Y (see Experimental Procedures, Box 3 for details). We know that
 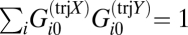 , because, for a given trajectory X, the weights are normalized (see Experimental Procedures, Box 2). Therefore, if two different trajectories have similar distributions of expression levels, the value of the overlap
  should be close to 1. For example, the scalar product of the G0 vectors of two different trajectories in the cancer model system WI-38 is
 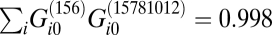 . (See Experimental Procedures, Box 3 for further discussion of the notion of a scalar product.) Similar results are found for all scalar products among the five different trajectories in the WI-38 system. The steady-state core remains essentially unchanged despite the different pathways that have been characterized for the WI-38 cellular system.
Box 3. Different Patients with the Same Symptoms Can Have Quite Different Patterns of the Disease.
 where i is the variable is a linear array comprised of many components (the number of transcripts). The value of each component is the expression level at the pattern α for all transcripts for a particular patient n. The overlap of two different arrays is
  where the summation is over all transcripts. In vector algebra the overlap is known as the “scalar product.” It is the cosine of the angle between the two directions.
Box 2. Transcription Patterns Are Distinct.
The different transcription patterns of the same process are distinct from the steady state. Technically, when summed over all transcripts, the weights are orthogonal:  . Also, different transcription patterns of the same process are distinct from one another:
  . The weights are normalized:
  , ensuring that the values of the weights are bounded. The value of all of these sums follow because the weights of the transcripts are components of eigenvectors of a symmetric matrix that is determined from the microarray data (22, 23).
We find that the concept of the steady-state core is equally applicable to other cellular systems. Using gene-expression data for different cell types, we calculated the G0 vector of lung cancer cells (A549) treated with TGF-β to induce EMT (28); normal colon, primary carcinoma, and metastatic cells from two different patients (34); normal renal, tumor, and metastatic cells from three patients (32); prostate tissues taken from radical prostatectomy surgeries from four different patients and separated into highly purified populations of benign basal epithelial cells, benign luminal epithelial cells, and cancerous luminal cells (SI Appendix, Text); and human papilloma virus (HPV16) immortalized keratinocytes from four distinct time points in the route of transformation (31). We calculated the scalar product of the G0 vectors of different cell types. Typical results are
 |
Because highly expressed transcripts have larger absolute Gi0 values and therefore contribute most to the scalar products, the above results show that highly expressed stable transcripts are neither extensively suppressed nor amplified across different biological processes in human cells. Next we analyzed data (30) for skin tumor progression from three different disease stages (normal, benign papillomas, and malignant carcinomas) in 31 mice. The resulting 31 vectors were remarkably similar, with a scalar product > 0.993 for all mouse pairs (SI Appendix, Fig. S5). The distribution of the transcripts among functional groups in the steady-state pattern is similar to the distribution in human models. We further examined the steady-state pattern of phenelzine-treated S. cerevisiae grown for 200 min (29) and, as an extreme example, Escherichia coli grown on biofilms for 24 h (35); results are reported in SI Appendix, Text Section 2.
Comparing Disease-Induced Transcription Patterns of Different Patients.
In contrast to the conservation of the steady state, we note that the transcription patterns that characterize the process of transformation vary significantly among different patients who have the same type of cancer. For example, the largest overlap for the first disease pattern in two different patients with renal metastatic cancer is 0.43, (SI Appendix, Table S4). The same result was obtained for two patients with colon carcinoma (ref. 34 and SI Appendix, Table S5) and for four patients with prostate cancer (SI Appendix, Table S6). The analysis of the key signaling proteins present in the pattern disease in colon and renal cancer samples, such as PTEN (a negative regulator of Akt pathway), different MAPK proteins, SRC, MYC, EGFR, PDGFR, IGFR, and NFκBIL2 (a negative regulator of NFκB) shows that these hub proteins have different, sometimes opposite, contributions in different patients who have the same type of cancer (SI Appendix, Tables S4A and S5A).
As in human patients, the G1 (α = 1) arrays of the major transcription patterns for different mice were rather heterogeneous and very much uncorrelated (SI Appendix, Fig. S5). These results provide a potential explanation for the heterogeneity in patient tumor response to pathway inhibitors observed in clinical trials.
Stable Transcripts of the Steady-State Participate Less in the Process of Transformation.
Transcripts that are significantly up- or down-regulated in the process of transformation are necessarily located at the edges of histogram describing the major transcription pattern (Fig. 1). Examination of the free energy values of these transcripts at the steady state revealed that the majority of these transcripts are located on the upper edge of the steady-state free energy histogram (Gi0λ0; Fig. 1); that is, they are categorized among the less stable of the stable core transcripts. Quantitative data bearing on this point are discussed in SI Appendix, Text, Sections 5 and 6 and Fig. S6. These transcripts belong to signal transduction and cell communication proteins and cell-cycle networks (SI Appendix, Text, Section 6 and Fig. S6). Furthermore, the above analysis showed that the steady-state core transcripts with the lowest free energy are hardly influenced by any disease process (SI Appendix, Text, Section 6 and Fig. S6).
From Steady-State Transcription Levels to the Functional Network.
To examine the structure of the transcripts with the greatest contribution to the steady state, we used the STRING software (36) that builds functional protein-association networks based on compiled available experimental evidence. As an example, consider the most stable transcripts, namely those with the lowest Gi0 values (less than −0.018) in SI Appendix, Fig. S3. Fig. 2 shows that these transcripts generate a highly connected, experimentally validated network. The lowest Gi0 values therefore are able to predict experimentally previously known protein–protein interactions. The least stable transcripts, those with the highest negative Gi0 values (greater than −0.008) in SI Appendix, Fig. S3 are much less connected than the transcripts with the lowest free energy (Fig. 2B). In the SI Appendix we show that the transcripts with either low or high Gi1values produce significantly less-connected experimentally validated networks (SI Appendix, Fig. S7). In SI Appendix, Text Sections 1 and 3, we discuss why the lowest Gi0 values predict connectivity. We conclude that transcripts with stable gene expressions are more connected.
Fig. 2.

Examination of the experimentally determined networks obtained from the Gi0 values in the trajectory 15781012. (A) The 66 transcripts with the lowest (i.e., most stable) Gi0 values (less than −0.018 according to SI Appendix, Fig. S3). (B) The 354 transcripts with the highest Gi0 values (greater than −0.008 according to SI Appendix, Fig. S3). The validation of the high connectivity of the stable transcripts is shown in Fig. 3.
Free Energy Predicts the Functional Connectivity of Transcripts.
To validate further the prediction of functional connectivity by free energy values, we built a heatmap according to the symmetric matrix, whose ij element is Gi0Gj0. Results for the process shown in Fig. 1 are compared in Fig. 3 with the known protein–protein interactions according to STRING. The values of the product Gi0Gj0 for 160 transcripts are represented in Fig. 3 by a heatmap (Fig. 3B). The most connected group in the heatmap comprises the transcripts with the lowest Gi0 values. Transcripts in this group are involved primarily in protein synthesis. Transcripts involved in energy pathways and transcription are somewhat less connected. The transcripts with high free energy are hardly connected. The steady-state connectivity agrees well with the known interaction maps according to STRING (Fig. 3A).
Fig. 3.

Predicting the connectivity of transcripts in the trajectory 15781012. (A) Connectivity of 160 transcripts in the process of Fig.1 according to the STRING software. The 120 most stable and the 40 least stable transcripts are shown. (B) A heatmap of the corresponding Gi0Gj0 values. The transcripts are labeled according to Gene Ontology categories. The transcripts with high Gi0 values, group 5, are sparsely connected.
Corresponding results for the TGF-β–treated A549 cells are shown in SI Appendix, Fig. S8. The interactions predicted by the heatmap also reflect known interactions according to STRING. The same result is found in other human cells.
Connectivity Networks Across Organisms.
Finally, we argue that in other organisms, also, low Gi0 values predict connectivity. In mice, for example we examined the process of carcinoma development (30) that included three stages: normal, benign, and carcinoma. The analysis showed that the steady-state connectivity that we calculated (Fig. 4B), agrees well with the known interaction maps according to STRING (Fig. 4A). The most connected group in the heatmap primarily comprises transcripts involved in protein synthesis. Transcripts involved in energy pathways are less connected. The transcripts with high free energy are hardly connected. Examination of data for other organisms showed similar results (SI Appendix, Figs. S9 and S10).
Fig. 4.

Predicting the connectivity of transcripts as determined for carcinoma development in mice. (A) Connectivity of 250 transcripts (the 210 most stable and the 40 least stable transcripts) is shown. (B) A heatmap of the corresponding Gi0Gj0 values. The transcripts are labeled according to Gene Ontology categories. The transcripts with high Gi0 values, groups 3 and 4, are sparsely connected.
Discussion
Using the measured distribution of expression levels of transcripts at several time points of a biological progression (Experimental Procedures), we determined the steady-state pattern and the transcription patterns that represent the deviations from the steady state caused by the ongoing process. The transcripts that contribute significantly to the steady state have much lower free energy values than the values of energy that can be produced by the particular process. The lower free energy explains why the steady state is robust.
The steady-state core network is conserved among different biological processes and across organisms. This result is consistent with previous studies showing that essential genes display lower variability (37, 38). We expect that the conservation of the core transcripts is essential for survival. On the other hand, we find that the transcription patterns that deviate from the steady state can vary significantly in the different types of cancer or even among different patients with the same type of cancer. Furthermore, we have found a remarkable convergence between our predicted structure of a steady-state network and the experimentally validated protein-interaction network in all the biological systems that we examined.
Functional analysis of the steady-state transcripts establishes that the protein network (which includes ribosomal RPS proteins, RPL proteins, and eukaryotic initiation and elongation factors) and energy metabolism networks (such as the oxidation phosphorylation chain network, including NDUF, COX transcripts, and ATP synthases) are the main contributors to the steady-state core set. Signal transduction and cell communication pathways that do not contribute significantly to the steady state and whose level is lower can vary in response to perturbations and are better able to respond to changing external stimuli. This set potentially would contain a larger number of therapeutic targets than the more stable core sequences.
In conclusion, surprisal analysis is able to predict the functionally connected stable steady-state network of a biological process by determining the free energy values of the mRNA molecules. The steady-state pattern remains largely unchanged in different biological processes and across organisms and provides a baseline for measuring deviations caused by a perturbation or a disease. The deviations are software-like gene patterns that are uncorrelated with the steady state and that vary even among different individuals with tumors of the same type.
Experimental Procedures
Surprisal analysis identifies the steady state and also the transcription patterns that represent the biological change. Each transcription pattern is an enumeration of the participating transcripts. Surprisal analysis shows that all the transcripts belonging to the same pattern act in concert, contributing in the same manner over time. Each transcript contributes to a transcription pattern with its characteristic, time-independent weight. In Box 1, Giα is the weight of transcript labeled i to the transcription pattern α. We use α = 0 to designate the steady state; α = 1, 2, … are the transcription patterns of the disease. A key practical point is that very few (two or three) transcription patterns suffice to represent accurately the changes in the expression levels of transcripts caused by the biological process. We use the number λα(t) as the value of the contribution of transcription pattern α at the time t. Surprisal analysis shows that very few λα(t) values are not zero, so only a few transcription patterns contribute (22, 23). Surprisal analysis also identifies the steady state as the pattern whose value, λ0, does not vary with time.
The steady-state pattern and the patterns of the disease are distinct from one another (Box 2). Technically we express this dissimilarity by a sum, over all transcripts, of the respective weights. The same considerations also imply that the Giα weights of the individual transcripts in pattern α are inherently standardized (Box 2).
Surprisal analysis uses the same core assumption that can be applied to characterize time-evolving physico-chemical systems. We illustrate this hypothesis here by reference to a system of coupled chemical reactions (e.g., metabolism). When such a system is initiated, reactions take place, and the concentrations of different species change. At any instant we can freeze the evolving system by adding or removing a catalyst (e.g., an enzyme) so that the system remains at its current composition. Upon such freezing, reactions stop, and the system is stable. Therefore for each transcript we can determine the work required to bring the expression to its value in the frozen state. This calculation gives us a quantitative value for each transcript.
Free Energy and the Expression Level of a Transcript.
Surprisal analysis determines the free energy of the transcripts in the cell and the changes caused by the work done by the biological process. Free energy is measured in units of work or, equivalently, of energy. The fold value is a dimensionless number. The steady-state fold value of a transcript, In  (Box 1), is the thermodynamic free energy measured in units of kT per transcript where k is Boltzmann's constant, and T is the temperature. The free energy is the (reversible) work required to bring the level of expression to its steady-state value. A negative value means that the transcript is very stable, because a lot of work is needed to change the level.
The biological process does work, and, using the point of view of a frozen equilibrium we can identify the work done on the genome at each time point t. The fold value of a transcript is the work required to bring the level of expression to its present value. Thus the change in fold value between two time points is the work done by the biological process. Quantitatively (Experimental Procedures, Box 1), Giαλα(t) is the work required by disease transcription pattern α to bring transcript i from the steady state to its expression level at the time t.
Supplementary Material
Acknowledgments
We thank James Heath and Owen Witte for valuable discussions and criticism of the manuscript. F.R. is Director of Research, Fonds National de la Recherche Scientifique, Belgium. A.G. and R.D.L. thank the Prostate Cancer Foundation for the support by a Creativity Award.
Footnotes
The authors declare no conflict of interest.
This article contains supporting information online at www.pnas.org/lookup/suppl/doi:10.1073/pnas.1200790109/-/DCSupplemental.
References
- 1.de Jonge HJ, et al. Evidence based selection of housekeeping genes. PLoS ONE. 2007;2:e898. doi: 10.1371/journal.pone.0000898. [DOI] [PMC free article] [PubMed] [Google Scholar]
- 2.Hanahan D, Weinberg RA. Hallmarks of cancer: The next generation. Cell. 2011;144:646–674. doi: 10.1016/j.cell.2011.02.013. [DOI] [PubMed] [Google Scholar]
- 3.Alon U. Network motifs: Theory and experimental approaches. Nat Rev Genet. 2007;8:450–461. doi: 10.1038/nrg2102. [DOI] [PubMed] [Google Scholar]
- 4.Morris MK, Saez-Rodriguez J, Sorger PK, Lauffenburger DA. Logic-based models for the analysis of cell signaling networks. Biochemistry. 2010;49:3216–3224. doi: 10.1021/bi902202q. [DOI] [PMC free article] [PubMed] [Google Scholar]
- 5.Davidson E, Levin M. Gene regulatory networks. Proc Natl Acad Sci USA. 2005;102:4935. doi: 10.1073/pnas.0502024102. [DOI] [PMC free article] [PubMed] [Google Scholar]
- 6.Friedman N, Linial M, Nachman I, Pe'er D. Using Bayesian networks to analyze expression data. J Comput Biol. 2000;7:601–620. doi: 10.1089/106652700750050961. [DOI] [PubMed] [Google Scholar]
- 7.Koller D, Friedman N. Probabilistic Graphical Models: Principles and Techniques. Cambridge, MA: MIT Press; 2009. [Google Scholar]
- 8.Lezon TR, Banavar JR, Cieplak M, Maritan A, Fedoroff NV. Using the principle of entropy maximization to infer genetic interaction networks from gene expression patterns. Proc Natl Acad Sci USA. 2006;103:19033–19038. doi: 10.1073/pnas.0609152103. [DOI] [PMC free article] [PubMed] [Google Scholar]
- 9.Margolin AA, et al. ARACNE: An algorithm for the reconstruction of gene regulatory networks in a mammalian cellular context. BMC Bioinformatics. 2006;7(Suppl 1):S7. doi: 10.1186/1471-2105-7-S1-S7. [DOI] [PMC free article] [PubMed] [Google Scholar]
- 10.Nykter M, et al. Critical networks exhibit maximal information diversity in structure-dynamics relationships. Phys Rev Lett. 2008;100:058702. doi: 10.1103/PhysRevLett.100.058702. [DOI] [PubMed] [Google Scholar]
- 11.Shmulevich I, Aitchison JD. Deterministic and stochastic models of genetic regulatory networks. Methods Enzymol. 2009;467:335–356. doi: 10.1016/S0076-6879(09)67013-0. [DOI] [PMC free article] [PubMed] [Google Scholar]
- 12.Amit I, et al. Unbiased reconstruction of a mammalian transcriptional network mediating pathogen responses. Science. 2009;326:257–263. doi: 10.1126/science.1179050. [DOI] [PMC free article] [PubMed] [Google Scholar]
- 13.Alter O. Genomic signal processing: From matrix algebra to genetic networks. Methods Mol Biol. 2007;377:17–60. doi: 10.1007/978-1-59745-390-5_2. [DOI] [PubMed] [Google Scholar]
- 14.Bansal M, Belcastro V, Ambesi-Impiombato A, di Bernardo D. How to infer gene networks from expression profiles. Mol Syst Biol. 2007;3:78. doi: 10.1038/msb4100120. [DOI] [PMC free article] [PubMed] [Google Scholar]
- 15.Bansal M, di Bernardo D. Inference of gene networks from temporal gene expression profiles. IET Syst Biol. 2007;1:306–312. doi: 10.1049/iet-syb:20060079. [DOI] [PubMed] [Google Scholar]
- 16.Janes KA, Reinhardt HC, Yaffe MB. Cytokine-induced signaling networks prioritize dynamic range over signal strength. Cell. 2008;135:343–354. doi: 10.1016/j.cell.2008.08.034. [DOI] [PMC free article] [PubMed] [Google Scholar]
- 17.Yeung MKS, Tegnér J, Collins JJ. Reverse engineering gene networks using singular value decomposition and robust regression. Proc Natl Acad Sci USA. 2002;99:6163–6168. doi: 10.1073/pnas.092576199. [DOI] [PMC free article] [PubMed] [Google Scholar]
- 18.Huynh-Thu VA, Irrthum A, Wehenkel L, Geurts P. Inferring regulatory networks from expression data using tree-based methods. PLoS ONE. 2010;5 doi: 10.1371/journal.pone.0012776. [DOI] [PMC free article] [PubMed] [Google Scholar]
- 19.Xiao Y, Segal MR. Identification of yeast transcriptional regulation networks using multivariate random forests. PLOS Comput Biol. 2009;5:e1000414. doi: 10.1371/journal.pcbi.1000414. [DOI] [PMC free article] [PubMed] [Google Scholar]
- 20.Yeger-Lotem E, et al. Bridging high-throughput genetic and transcriptional data reveals cellular responses to alpha-synuclein toxicity. Nat Genet. 2009;41:316–323. doi: 10.1038/ng.337. [DOI] [PMC free article] [PubMed] [Google Scholar]
- 21.Omberg L, et al. Global effects of DNA replication and DNA replication origin activity on eukaryotic gene expression. Mol Syst Biol. 2009;5:312. doi: 10.1038/msb.2009.70. [DOI] [PMC free article] [PubMed] [Google Scholar]
- 22.Kravchenko-Balasha N, et al. Convergence of logic of cellular regulation in different premalignant cells by an information theoretic approach. BMC Syst Biol. 2011;5:42. doi: 10.1186/1752-0509-5-42. [DOI] [PMC free article] [PubMed] [Google Scholar]
- 23.Remacle F, Kravchenko-Balasha N, Levitzki A, Levine RD. Information-theoretic analysis of phenotype changes in early stages of carcinogenesis. Proc Natl Acad Sci USA. 2010;107:10324–10329. doi: 10.1073/pnas.1005283107. [DOI] [PMC free article] [PubMed] [Google Scholar]
- 24.Macneil LT, Walhout AJ. Gene regulatory networks and the role of robustness and stochasticity in the control of gene expression. Genome Res. 2011;21:645–657. doi: 10.1101/gr.097378.109. [DOI] [PMC free article] [PubMed] [Google Scholar]
- 25.Laidler K. A glossary of terms used in chemical kinetics, including reaction dynamics (IUPAC Recommendations 1996) Pure Appl Chem. 1996;68:149–192. [Google Scholar]
- 26.Levine RD. Molecular Reaction Dynamics. Cambridge, UK: Cambridge Univ Press; 2005. [Google Scholar]
- 27.Milyavsky M, et al. Transcriptional programs following genetic alterations in p53, INK4A, and H-Ras genes along defined stages of malignant transformation. Cancer Res. 2005;65:4530–4543. doi: 10.1158/0008-5472.CAN-04-3880. [DOI] [PubMed] [Google Scholar]
- 28.Sartor MA, et al. ConceptGen: A gene set enrichment and gene set relation mapping tool. Bioinformatics. 2010;26:456–463. doi: 10.1093/bioinformatics/btp683. [DOI] [PMC free article] [PubMed] [Google Scholar]
- 29.Li CM, Klevecz RR. A rapid genome-scale response of the transcriptional oscillator to perturbation reveals a period-doubling path to phenotypic change. Proc Natl Acad Sci USA. 2006;103:16254–16259. doi: 10.1073/pnas.0604860103. [DOI] [PMC free article] [PubMed] [Google Scholar]
- 30.Quigley DA, et al. Network analysis of skin tumor progression identifies a rewired genetic architecture affecting inflammation and tumor susceptibility. Genome Biol. 2011;12:R5. doi: 10.1186/gb-2011-12-1-r5. [DOI] [PMC free article] [PubMed] [Google Scholar]
- 31.Kravchenko-Balasha N, Mizrachy-Schwartz S, Klein S, Levitzki A. Shift from apoptotic to necrotic cell death during human papillomavirus-induced transformation of keratinocytes. J Biol Chem. 2009;284:11717–11727. doi: 10.1074/jbc.M900217200. [DOI] [PMC free article] [PubMed] [Google Scholar]
- 32.Stickel JS, et al. HLA ligand profiles of primary renal cell carcinoma maintained in metastases. Cancer Immunol Immunother. 2009;58:1407–1417. doi: 10.1007/s00262-008-0655-6. [DOI] [PMC free article] [PubMed] [Google Scholar]
- 33.Ruau D, Ju XS, Zenke M. Genomics of TGF-beta1 signaling in stem cell commitment and dendritic cell development. Cell Immunol. 2006;244:116–120. doi: 10.1016/j.cellimm.2007.01.011. [DOI] [PubMed] [Google Scholar]
- 34.Wang H, Tsai C. Comparison of gene expression profiles between paired primary and metastasis colorectal carcinoma. 2009. (GEO database; http://www.ncbi.nlm.nih.gov/geo/)
- 35.Domka J, Lee J, Bansal T, Wood TK. Temporal gene-expression in Escherichia coli K-12 biofilms. Environ Microbiol. 2007;9:332–346. doi: 10.1111/j.1462-2920.2006.01143.x. [DOI] [PubMed] [Google Scholar]
- 36.Szklarczyk D, et al. The STRING database in 2011: Functional interaction networks of proteins, globally integrated and scored. Nucleic Acids Res. 2011;39(Database issue):D561–D568. doi: 10.1093/nar/gkq973. [DOI] [PMC free article] [PubMed] [Google Scholar]
- 37.Batada NN, Hurst LD. Evolution of chromosome organization driven by selection for reduced gene expression noise. Nat Genet. 2007;39:945–949. doi: 10.1038/ng2071. [DOI] [PubMed] [Google Scholar]
- 38.Lehner B. Selection to minimise noise in living systems and its implications for the evolution of gene expression. Mol Syst Biol. 2008;4:170. doi: 10.1038/msb.2008.11. [DOI] [PMC free article] [PubMed] [Google Scholar]
Associated Data
This section collects any data citations, data availability statements, or supplementary materials included in this article.