Abstract
A quantitative understanding of right ventricular (RV) remodeling in repaired tetralogy of Fallot (rTOF) is crucial for patient management. The objective of this study is to quantify the regional curvatures and area strain based on three-dimensional (3-D) reconstructions of the RV using cardiac magnetic resonance imaging (MRI). Fourteen (14) rTOF patients and nine (9) normal subjects underwent cardiac MRI scan. 3-D RV endocardial surface models were reconstructed from manually delineated contours and correspondence between end-diastole (ED) and end systole (ES) was determined. Regional curvedness (C) and surface area at ED and ES were calculated as well as the area strain. The RV shape and deformation in rTOF patients differed from normal subjects in several respects. Firstly, the curvedness at ED (mean for 13 segments, 0.030 ± 0.0076 vs. 0.029 ± 0.0065 mm−1; P < 0.05) and ES (mean for 13 segments, 0.040 ± 0.012 vs. 0.034 ± 0.0072 mm−1; P < 0.001) was decreased by chronic pulmonary regurgitation. Secondly, the surface area increased significantly at ED (mean for 13 segments, 982 ± 192 vs. 1,397 ± 387 mm2; P < 0.001) and ES (mean for 13 segments, 576 ± 130 vs. 1,012 ± 302 mm2; P < 0.001). In particular, rTOF patients had significantly larger surface area than that in normal subjects in the free wall but not for the septal wall. Thirdly, area strain was significantly decreased (mean for 13 segments, 56 ± 6 vs. 34 ± 7%; P < 0.0001) in rTOF patients. Fourthly, there were increases in surface area at ED (5,726 ± 969 vs. 6,605 ± 1,122 mm2; P < 0.05) and ES (4,280 ± 758 vs. 5,569 ± 1,112 mm2; P < 0.01) and decrease in area strain (29 ± 8 vs. 18 ± 8%; P < 0.001) for RV outflow tract. These findings suggest significant geometric and strain differences between rTOF and normal subjects that may help guide therapeutic treatment.
Keywords: magnetic resonance imaging, curvature, right ventricular remodeling, deformation, three-dimensional reconstruction
tetralogy of fallot (TOF) is the most common cyanotic congenital heart disease (19). The main features include ventricular septum defect, subpulmonary stenosis, and overriding aorta and right ventricular (RV) hypertrophy. Surgical repair is usually performed in early infancy to widen the passage from the RV to the pulmonary artery and close the ventricular septal defect. This ensures separation of oxygen-rich and oxygen-poor blood flows to the proper chambers. Surgical repair of TOF often involves disruption of pulmonary valve integrity that leads to pulmonary regurgitation (PR; Refs. 8, 37). This in turn causes RV dilation (9, 23) and RV outflow tract (RVOT) aneurysm (2–3, 13, 28–29). The RV dilation is usually tolerated with little or no symptoms during the first two to three decades of age. If left untreated, however, continued RV dilation may lead to adverse outcomes, including arrhythmias and sudden death (11, 13, 30). Repeat surgery with pulmonary valve replacement (PVR) may be necessary to preempt RV function deterioration and malignant ventricular arrhythmias (15, 21, 39, 40, 42). The optimal timing for PVR before irreversible RV functional deterioration, however, is not known (17, 18, 36, 37).
In contrast to the left ventricle (LV), RV anatomy is much more complex and can vary tremendously in repaired TOF (rTOF) patients. Few works have quantified the anatomical alterations and evolutions of the RV in rTOF. Currently, quantitative measures of RV remodeling are typically global RV volumes and ejection fraction (EF). In rTOF patients, surveillance echocardiography to detect the presence of PR is obligatory (22). If significant PR is found, cardiac MRI is performed to quantify PR severity and RV function (20). Many studies have shown that MRI is the best and most comprehensive approach to quantify the three dimensional (3-D) ventricular geometry and function (4, 25, 47–48), compared with echocardiography (16, 41), ventriculography (14, 46), angiography (33), and indicator-dilution methods (10). In patients with demonstrable severe PR and borderline RV function, serial MRI assessment becomes mandatory for timing of pulmonary valve replacement (PVR; Ref. 17). Traditional RV measures (volume and EF), however, do not provide a comprehensive quantitative description of the remodeling process (i.e., regional shape and deformation).
In this study, we aim to assess the following: 1) regional variations of the 3-D RV shape in terms of surface curvedness, 2) regional variations of deformation in terms of area strain, 3) regional septum shape and deformation to characterize the LV-RV interaction, and 4) RVOT shape and deformation of rTOF patients compared with normal subjects.
METHODS
Subjects.
The study consisted of 9 normal subjects and 14 rTOF patients. All subjects underwent diagnostic MRI scans. None of the normal subjects had the following: 1) significant valvular or congenital cardiac disease, 2) history of myocardial infarction, 3) coronary artery lesions, or 4) abnormal LV pressure, end-diastolic (ED) volume, or EF. All subjects were recruited without consideration of gender or ethnicity and gave informed consent. The study protocol was approved by the SingHealth Centralised Institutional Review Board.
MRI scans.
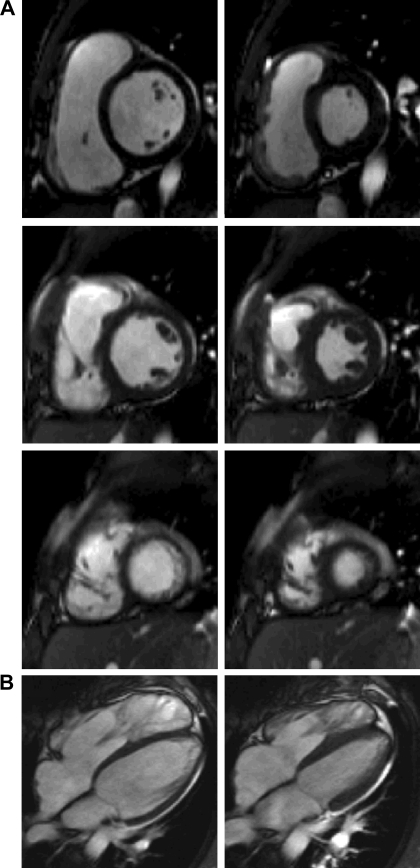
MRI scanning was performed using steady-state free precession cine gradient echo sequences. Subjects were imaged on a 1.5T Siemens scanner (Avanto, Siemens Medical Solutions, Erlangen). Some preliminary short-axis acquisitions were used to locate the plane passing through the mitral and aortic valves. The following planes (ventricular 2-chamber, 4-chamber, and short-axis planes with 12–14 equidistant slices covering both ventricles) were acquired. The field of view was typically 320 mm with in-plane spatial resolution of <1.5 mm. Each slice was acquired in a single breath hold, with 25 temporal phases per heart cycle. Figure 1 depicts the MR short- and long-axis images, during ED and end-systolic (ES) phases. The entire image acquisition duration averaged 30 min. The short- and long-axes views (or planes) derived from the MRI were utilized to carry out 3-D RV reconstruction (at ED and ES) using a customized software. The method of RV geometry reconstruction is detailed in Data processing and RV geometry reconstruction. A trueFISP cine was acquired in an oblique sagittal plane aligned with the RVOT before velocity mapping and short-axis cine acquisitions. Flow measurements were performed in the proximal main pulmonary artery with a retrospectively gated velocity-encoded cine MR pulse sequence. Regurgitant fraction was measured as diastolic reversed flow expressed as a percentage of forward flow. RVOT cines in the sagittal and short-axis cine images of the RV were assessed for akinesia or dyskinesia.
Fig. 1.
Sample segmented trueFISP two-dimensional cine MR images of short-axis (A) slices acquired at the base, middle, and apex (from top to bottom, respectively) and long axis (B) of the heart. End-diastolic (ED) and end-systolic (ES) phases are at left and right, respectively.
Data processing and RV geometry reconstruction.
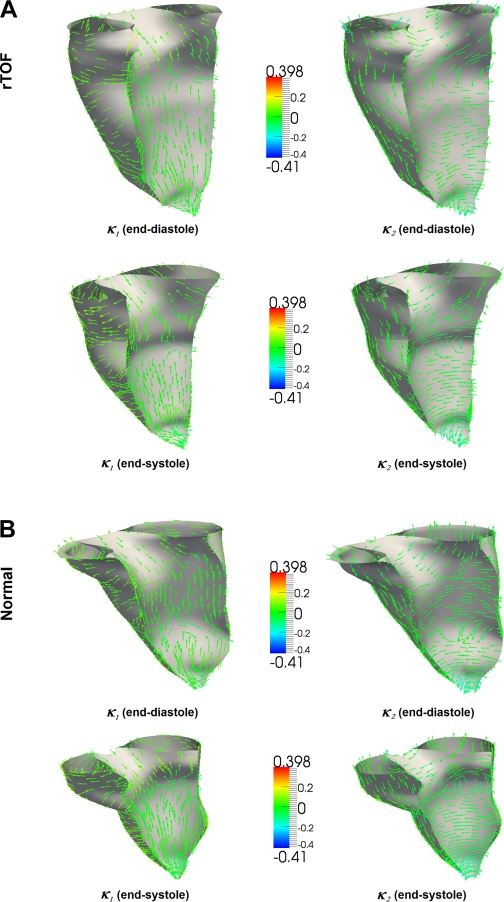
The methods of MRI data processing for LV have been developed and used in previous studies (35, 44, 47, 48). Briefly, the MRI data were processed using a semi-automatic technique provided in the CMRtools suite (Cardiovascular Solutions). Short- and long-axis images were displayed simultaneously such that segmentation in the two planes proceeded interactively to reduce registration errors. For each phase, every control point on the endocardium was constrained to lie on the intersection of the short- and long-axis views. The construction of long-axis planes (orthogonal to the short-axis planes oriented at regular angular intervals) enabled the fitting of a series of B-spline curves to represent the contours of the endocardial surface. This allowed the addition or manipulation of control points to obtain the desired boundary locations. The papillary muscles and trabeculae were included in the chamber volume to obtain smooth endocardial contours suitable for shape analysis. The 3-D reconstructions of a typical rTOF and normal RV during ED and ES phases are shown in Fig. 2. From the reconstructed RV, the chamber volume, stroke volume and EF were determined.
Fig. 2.
Plots represent principal curvature analysis done on the endocardial wall of the right ventricle. Arrowheads on the endocardial surface represent directions of maximum principal curvature (left) and minimum principal curvature (right) of the endocardial surface repaired tetralogy of Fallot (rTOF; A) and normal subjects (B).
3-D surface shape descriptors.
An in-house software was used to reconstruct the RV endocardial meshes at ED and ES as well as to calculate the surface shape descriptors, expressed in terms of local normal curvature and curvedness (35, 44, 47, 48). To evaluate the shape at a particular point on the mesh, a local surface geometry was fitted to the region and the normal curvature was then calculated as (6, 12):
| 1 |
where λ = dv/du such that u and v are geometric parameters and {E, F, G} and {L, M, N} are components of the first and second fundamental forms, respectively. The extreme values κ1 and κ2 of κ(λ) are the maximum and minimum principal curvatures, respectively, and they are obtained from the roots of the equation (6, 12):
| 2 |
The corresponding directions of κ1 and κ2 are the principal directions and are orthogonal to each other. Figure 2 presents typical principal curvature on the endocardial wall of the RV in rTOF and normal heart. The arrowheads represent the directions of the principal curvature on the surface of the endocardium.
The shape descriptor is characterized by the curvedness value (C) and is defined as (24):
| 3 |
The value of C indicates the magnitude of the curvedness at a point, which is a measure of how much a region deviates from flatness.
Area strain.
Strain is a dimensionless quantity that represents the change in dimension of a structure from rest to a deformed state following the application of a stress (force/area; Ref. 27). Conventional strain analysis (i.e., radial, circumferential, and longitudinal strain) has been limited by two-dimensional (2-D) MRI and echocardiography. Area strain (AS) based on 3-D approach has been recently introduced for the LV (31). Basically, area strain reflects deformation of the endocardial surface during contraction and relaxation and can be regarded as a parameter that integrates the regional consequence of deformation in longitudinal, circumferential, and radial directions. The change in ln(SA) or d(SA)/SA expresses a relative change in area (incremental area strain). The instantaneous area strain is given by the following equation:
| 5 |
where SA0 is the surface area corresponding to a state of zero stress. While definition of SA0 is required to obtain the complete strain variation, it is not required in the analysis of total area strain from ED to ES, as given by
| 6 |
The steps of the computation of area strain are summarized in appendix a.
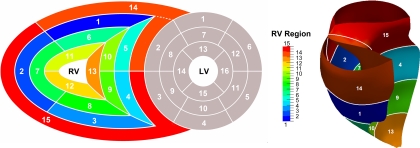
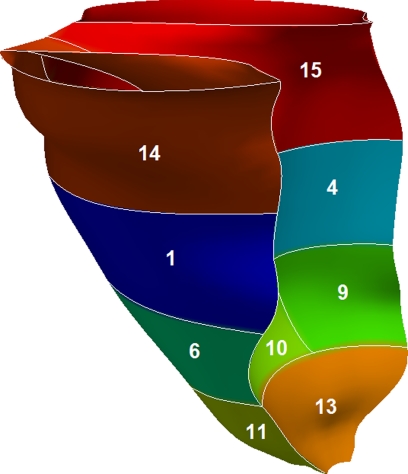
To determine regional RV properties of curvedness, surface area, and area strain, the RV was divided into a 13-segment model from apex to base (Fig. 3) and RV outlet and inlet as detailed in appendix b. The RVOT was considered to extend from the distal border of the middle level to the attachments of the leaflets of the pulmonary valve (segments 1, 2, 5 and 14) . The RV inflow tract (RVIT) was deemed to extend from the atrioventricular junction to the distal border of the middle level (segments 3, 4, and 15). The average values of all parameters (i.e., curvedness, surface area, and area strain) for each region were computed.
Fig. 3.
Standardized myocardial segmentation and nomenclature of right ventricle (RV). LV, left ventricle.
Statistical analysis.
Continuous variables were expressed as means ± SD. An unpaired t-test was used to compare the difference between variables of rTOF patients and normal subjects. Statistical significance for comparison of regional RV curvedness, surface area, and area strain was determined using ANOVA analysis. The difference in regional parameters between rTOF and normal subjects was determined using a two-tailed unpaired t-test. Univariate correlation was performed between LV and RV volume and function, between RV regional area strain and curvedness using Spearman's correlation coefficient. For all tests, P < 0.05 was considered statistically significant. All analyses were performed with a commercially available software (SPSS version 17.0; SPSS, Chicago, IL).
RESULTS
PR and RVOT aneurysm and akinesia in rTOF patients.
The age of patients at TOF repair ranged from 1 to 32 yr old (mean: 11.5 ± 10.3 yr). The PR fraction ranged from 14% to 63% (39 ± 14%); 57.1% (8/14) of patients had either RVOT aneurysm or akinesia.
Global LV and RV volume and function.
The hemodynamic and volumetric parameters of the subjects are summarized in Table 1. The rTOF patients had comparable age, gender and body surface area and diastolic and systolic blood pressure (all P > 0.05) compared with normal subjects. The rTOF patients had comparable LVED volume and mass, but significantly lower LVEF compared with normal subjects. The rTOF patients had significantly higher RVED and ES volumes and lower RVEF (all P < 0.001). The rTOF patients had severe pulmonary regurgitation (39 ± 14%).
Table 1.
Characteristics of normal subjects and rTOF patients
| Normal (n = 9) | rTOF (n = 14) | P Value | |
|---|---|---|---|
| Age, yr | 41 ± 16 | 33 ± 11 | 0.17 |
| Gender, male/female | 6/3 | 9/5 | 0.91 |
| Weight, kg | 68 ± 15 | 60 ± 12 | 0.17 |
| Height, cm | 168 ± 7 | 162 ± 11 | 0.20 |
| BSA, m2 | 1.77 ± 0.23 | 1.64 ± 0.20 | 0.16 |
| Diastolic pressure, mmHg | 76 ± 8 | 75 ± 13 | 0.83 |
| Systolic pressure, mmHg | 125 ± 13 | 124 ± 15 | 0.86 |
| RR interval, ms | 886 ± 116 | 809 ± 85 | 0.079 |
| LVEDVI, ml/m2 | 73 ± 10 | 75 ± 15 | 0.73 |
| LVESVI, ml/m2 | 25 ± 6 | 33 ± 8 | 0.035 |
| LV mass index, g/m2 | 56 ± 12 | 47 ± 11 | 0.083 |
| LVEF, % | 65 ± 5 | 56 ± 6 | 0.001 |
| RVEDVI, ml/m2 | 90 ± 21 | 166 ± 38 | <0.0001 |
| RVESVI, ml/m2 | 40 ± 13 | 95 ± 31 | <0.0001 |
| RVEF, % | 56 ± 7 | 44 ± 9 | 0.001 |
| PRF, % | 0 | 39 ± 14 | <0.0001 |
rTOF, repaired tetralogy of Fallot; BSA, body surface area; LV, left ventricular; RV, right ventricular; EDVI, end-diastolic volume index; ESVI, end-systolic volume index; EF, ejection fraction; PRF, pulmonary regurgitant fraction.
Variation of RV curvedness and area strain from base to apex in normal.
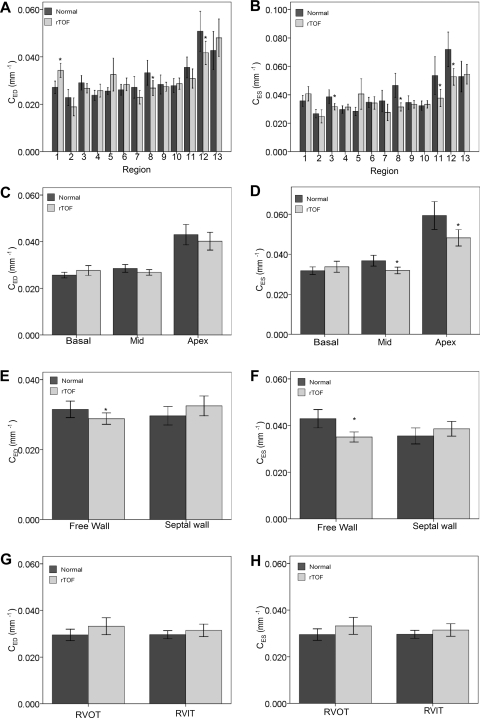
The calculated RV regional curvedness at ED and ES in normal and rTOF are summarized in Table 2. In general, normal hearts demonstrated the following regional differences: curvedness is highest at the apex, compared with the basal and middle levels (P < 0.0001, ANOVA; Fig. 4, C and D). The free wall had larger curvedness than the septal wall (CED: 0.031 ± 0.010 vs. 0.030 ± 0.0087 mm−1, P = 0.31; CES: 0.043 ± 0.016 vs. 0.036 ± 0.011 mm−1; P = 0.01; Fig. 4, E and F). The RVOT had smaller curvedness than the RVIT but was not statistically significant (Fig. 4, G and H).
Table 2.
RV regional curvedness analysis in normal and rTOF
| Normal (n = 9) |
rTOF (n = 14) |
|||
|---|---|---|---|---|
| Segment | CED, mm−1 | CES, mm−1 | CED, mm−1 | CES, mm−1 |
| 1. Basal anterior | 0.027 ± 0.0034 | 0.036 ± 0.0048 | 0.034 ± 0.0052a | 0.041 ± 0.0086a |
| 2. Basal lateral | 0.023 ± 0.0044 | 0.027 ± 0.0038 | 0.019 ± 0.0065 | 0.028 ± 0.0080 |
| 3. Basal inferior | 0.029 ± 0.0040 | 0.039 ± 0.0064 | 0.027 ± 0.0034 | 0.032 ± 0.0039a |
| 4. Basal inferior septal | 0.024 ± 0.0027 | 0.030 ± 0.0034 | 0.026 ± 0.0047 | 0.031 ± 0.0035 |
| 5. Basal anterior septal | 0.026 ± 0.0019 | 0.028 ± 0.0038 | 0.033 ± 0.0013 | 0.041 ± 0.019 |
| 6. Middle anterior | 0.026 ± 0.0030 | 0.035 ± 0.0046 | 0.028 ± 0.0047 | 0.034 ± 0.0075 |
| 7. Middle lateral | 0.027 ± 0.0059 | 0.036 ± 0.0098 | 0.023 ± 0.0050 | 0.028 ± 0.010 |
| 8. Middle inferior | 0.033 ± 0.0068 | 0.047 ± 0.011 | 0.027 ± 0.0054b | 0.031 ± 0.0050c |
| 9. Middle inferior septal | 0.028 ± 0.0052 | 0.035 ± 0.0061 | 0.027 ± 0.0033 | 0.033 ± 0.0046 |
| 10. Middle anterior septal | 0.028 ± 0.0039 | 0.032 ± 0.0043 | 0.029 ± 0.0041 | 0.033 ± 0.0046 |
| 11. Apical anterior | 0.036 ± 0.0057 | 0.054 ± 0.0170 | 0.031 ± 0.0070 | 0.038 ± 0.010a |
| 12. Apical inferior | 0.051 ± 0.011 | 0.072 ± 0.016 | 0.042 ± 0.0084a | 0.053 ± 0.010b |
| 13. Apical septal | 0.038 ± 0.0073 | 0.043 ± 0.0087 | 0.041 ± 0.0091 | 0.044 ± 0.0092 |
| RVOT | 0.029 ± 0.0032 | 0.035 ± 0.0027 | 0.033 ± 0.0062 | 0.038 ± 0.0088 |
| RVIT | 0.030 ± 0.0022 | 0.036 ± 0.0031 | 0.031 ± 0.0047 | 0.034 ± 0.0033 |
| Meansd | 0.030 | 0.040 | 0.029 | 0.036 |
| SDd | 0.0076 | 0.012 | 0.0065 | 0.0072 |
| CV = SD/means × 100 (%) | 25 | 30 | 22 | 20 |
CED, curvedness in end diastole; CES, curvedness in end systole; RVOT, RV outflow tract; RVIT, RV inflow tract; CV, coefficient of variation. aP < 0.05, bP < 0.01, cP < 0.001, for regional segments that are significantly different in rTOF compared with normal. dFor 13 segments.
Fig. 4.
Variation of curvedness (CED and CES) of the RV in normal subjects and in rTOF patients. A and B: CED and CES assessment in 13 segments. C and D: CED and CES assessment in 3 levels. E and F: CED and CES assessment in free wall and septal wall. G and H: CED and CES assessment in RV outflow tract (RVOT) and RV inflow tract (RVIT). Values are means ± SD. *Significant difference between rTOF vs. normal subjects.
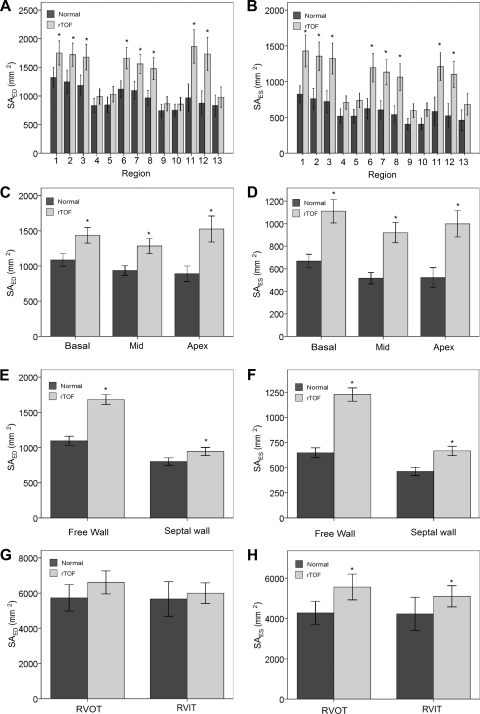
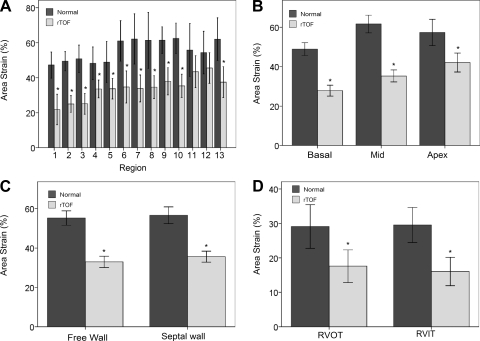
The regional surface area at ED and ES and area strain in normal and rTOF are summarized in Table 3. In general, normal hearts demonstrated comparable surface area among basal, middle and apex levels (P > 0.05, ANOVA; Fig. 5, C and D). The free wall had larger surface area than septal wall (SAED: 1,096 ± 271 vs. 800 ± 173 mm2, SAES: 648 ± 211 vs. 462 ± 138 mm2; both P < 0.0001; Fig. 5, E and 6F). Area strain was not significantly different, however, among the 13 segments and between free wall and septal wall (all P > 0.05; Fig. 6, A and C). This suggests that the normal hearts exhibit uniform deformation throughout the RV. The average global area strain was 56 ± 6%.
Table 3.
RV surface area and area strain in normal and rTOF
| Normal (n = 9) |
rTOF (n = 14) |
|||||
|---|---|---|---|---|---|---|
| Segment | SAED, mm2 | SAES, mm2 | AS, % | SAED, mm2 | SAES, mm2 | AS, % |
| 1. Basal anterior | 1,323 ± 224 | 825 ± 154 | 47 ± 10 | 1,751 ± 363a | 1,429 ± 385c | 22 ± 15c |
| 2. Basal lateral | 1,246 ± 268 | 762 ± 185 | 49 ± 7 | 1,722 ± 347b | 1,357 ± 344c | 25 ± 8b |
| 3. Basal inferior | 1,183 ± 237 | 721 ± 200 | 51 ± 10 | 1,679 ± 388b | 1,323 ± 373c | 25 ± 10c |
| 4. Basal inferior septal | 831 ± 162 | 517 ± 131 | 48 ± 12 | 990 ± 230 | 707 ± 163b | 36 ± 9b |
| 5. Basal anterior septal | 843 ± 178 | 518 ± 126 | 49 ± 15 | 1,029 ± 175 | 738 ± 175b | 34 ± 10c |
| 6. Middle anterior | 1,118 ± 197 | 623 ± 181 | 61 ± 15 | 1,659 ± 323c | 1,195 ± 343c | 35 ± 16c |
| 7. Middle lateral | 1,095 ± 197 | 605 ± 169 | 62 ± 19 | 1,561 ± 292c | 1,133 ± 309c | 34 ± 13c |
| 8. Middle inferior | 966 ± 169 | 539 ± 157 | 61 ± 20 | 1,477 ± 331c | 1,064 ± 320c | 35 ± 11c |
| 9. Middle inferior septal | 744 ± 144 | 406 ± 102 | 61 ± 10 | 863 ± 215 | 596 ± 168b | 38 ± 13c |
| 10. Middle anterior septal | 751 ± 135 | 407 ± 109 | 62 ± 11 | 859 ± 198 | 618 ± 159b | 35 ± 11 |
| 11. Apical anterior | 967 ± 315 | 582 ± 262 | 56 ± 20 | 1,864 ± 506c | 1,211 ± 338c | 43 ± 16 |
| 12. Apical inferior | 870 ± 285 | 523 ± 218 | 54 ± 16 | 1,732 ± 49c | 1,102 ± 315c | 46 ± 15 |
| 13. Apical septal | 832 ± 239 | 461 ± 187 | 62 ± 16 | 977 ± 313 | 684 ± 256a | 37 ± 15a |
| RVOT | 5,726 ± 969 | 4,280 ± 758 | 29 ± 8 | 6,605 ± 1,122 | 5,569 ± 1112 | 18 ± 8b |
| RVIT | 5,662 ± 1,274 | 4,237 ± 1,077 | 30 ± 6 | 5,990 ± 1,018 | 5,108 ± 910 | 16 ± 7c |
| Meansd | 982 | 576 | 56 | 1,397 | 1,012 | 34 |
| SDd | 192 | 130 | 6 | 387 | 301 | 7 |
| SD/means, % | 20 | 23 | 11 | 28 | 30 | 21 |
SAED, surface area in end diastole; SAES, surface area in end systole; AS, area strain [=ln(SAES/SAED)]. aP < 0.05, bP < 0.01, cP < 0.001, for regional segments that are significantly different in rTOF compared with normal. dFor 13 segments.
Fig. 5.
Variation of surface area (SAED and SAES) of the right ventricle in normal subjects and in rTOF patients. A and B: SAED and SAES assessment in 13 segments. C and D: SAED and SAES assessment in 3 levels. E and F: SAED and SAES assessment in free wall and septal wall. G and H: SAED and SAES assessment in RV outflow tract RVOT and RVIT. Values are means ± SD. *Significant difference between rTOF vs. normal subjects.
Fig. 6.
Variation of area strain (AS) of the RV in normal subjects and in rTOF patients in 13 segments (A), 3 levels (B), between free wall and septal wall (C) and between RVOT and RVIT (D). Values are means ± SD. *Significant difference between rTOF vs. normal subjects.
Comparison of RV curvedness, surface area and area strain in rTOF and normal.
In rTOF, the RV curvedness was highest at the apex (Fig. 4, A and B). Compared with normal, rTOF had lower value of curvedness at ED and ES at the free wall (P < 0.05) but, surprisingly, had nonsignificantly higher value of curvedness in the septal wall (P > 0.05; Fig. 4, E and F). This suggests that the ventricular septum may be affected by LV and RV interaction in rTOF.
In rTOF, the surface area was highest at apex (P < 0.05 ANOVA), which suggests a broadening apex (Fig. 5, C and D). This may be an indication that the apex was the first region with dilation in rTOF. Compared with normal, rTOF had larger regional surface area at both free wall and septal wall at ED and ES (Fig. 5, E and F). More importantly, differences in regional surface area were more pronounced at the apex level and free wall.
In rTOF, area strain was lowest at the basal level (in particular, at the basal free wall; P < 0.05 ANOVA). Compared with the free wall and septal wall, the free wall deformation was lower than in the septal wall, but not significantly. Compared with normal subjects, rTOF patients had lower area strain at all regions (Fig. 6, A-D). The impairment of RV strain was more at the basal level than at the mid and apex levels (Fig. 6B). This may be due to the impairment of RVOT, i.e., early surgical repair of TOF impaired the RV outflow tract muscle (2).
Comparison of RVOT curvedness, surface area, and area strain in rTOF and normal.
rTOF had larger values of curvedness at ED and ES for RVOT (Fig. 4, G and H) but not significantly. Similarly, rTOF had higher values of surface area at ED and ES (Fig. 5, G and H) and significantly impaired area strain (18 ± 8 vs. 29 ± 8%; P < 0.0001; Fig. 6D).
LV and RV interactions in rTOF and normal hearts.
There were significant statistical interactions between LV and RV. Firstly, there was significant correlation between LV and RVED volume index (r = 0.55, P < 0.01) and EF (r = 0.72, P < 0.0001), which implies ventricular interdependence. Secondly, regional RV strain was correlated with curvedness (for CED, r = 0.12, P < 0.05; for CES, r = 0.22, P < 0.001), which suggests less curved RV geometry impaired RV regional deformation.
DISCUSSION
The major findings of this study are that the RV of rTOF patients undergoes significant changes in shape and area strain; i.e., broadens at the free wall, larger apex, and impaired basal and RVOT deformation. To our knowledge, the present study is the first 3-D shape and area strain analysis of the entire RV (i.e., including RVOT and RVIT). This approach yields new insights into the geometry and function of the 3-D RV, which are unattainable from 2-D analysis or simplified geometrical modeling.
Curvedness and area strain in normal hearts.
The radius of curvature of the RV is usually estimated from the short- and long-axis diameters (2-D analysis). These parameters, however, do not necessarily represent the radii of curvature at a particular point, especially when local pathology is present (38, 47). In this study, we compared the difference in RV curvedness among 13 segments, 3 levels, and between the free wall and septal wall from patient-specific reconstruction of 3-D RV model. The curvedness at ED and ES tends to vary from base to apex, with the biggest value at the apex, which suggests inhomogeneous shape distribution (Fig. 4, A–D). The area strain is fairly uniform from the base to apex (P > 0.05, ANOVA) and between the free wall and septal wall (P > 0.05, t-test; Fig. 6, B and C), which suggests uniformity of RV deformation in normal hearts.
rTOF.
RV remodeling in rTOF due to chronic pulmonary regurgitation and ventricular fibrosis is a multistep process, which has been investigated in numerous studies (17). Indeed, RV dilation from PR has previously been considered benign in the 1970s and 1980s (22). Recent studies (11, 13, 30) have found that continued RV volume load is associated with an accelerated rate of progressive symptoms, however, and incomplete functional recovery of RV systolic and diastolic functions if left untreated. In rTOF, relief of RVOT obstruction typically involves incision of the infundibular free wall, resection of obstructive muscle bundles, disruption of the pulmonary valve with partial or complete excision, and placement of an outflow patch. This often extends across the plane of the pulmonary valve into the main pulmonary artery. These procedures often lead to akinesis or dyskinesis of the RVOT and fibrosis of the RV free wall in the long term, as documented by a study (2) conducted using late gadolinium enhancement cardiac MRI. Geometrically, the increase of RV volume results in a corresponding decrease of local curvedness, in particular at the free wall, as observed in our present study. These findings agree with the observations of Sheehan et al. (34). Also, there was pronounced broadening at the apex of the RV, as evidenced by the measured surface area, which is a well-known sign of RV overload in angiographic, echocardiographic and MRI observation of an “apex forming RV” (34, 43, 45). The phenomenon of increased RV dilatation at the apex could be due to the additional circumferential fibers acting like a girdle to confine dilation to the apical region (32). Not only did the free wall enlarge, but so did the interventricular septum (Fig. 6, E and F), albeit to a smaller extent. This localized dilation may be attributed to the relative thinness of the myocardium in that location compared with the rest of the free wall (1).
The changes in RV shape are accompanied by a decrease of RV function (e.g., lower RVEF and area strain). In the present study, we observed that area strain decreases more in the basal and RVOT regions, which may be due to more RVOT dyskinesis in rTOF. Nonetheless, regional differences were also observed in other segments (Fig. 6A), including mid and apex levels, free wall, and septum wall. This apparently complex pattern may be related to inhomogeneity of myocardial fibrosis in these patients, as documented by late gadolinium enhancement cardiac MRI (2). Since RV dilation results in regional inhomogeneity of shape and regional deformation may vary between different zones of RV, the effects of RV dilation should be examined regionally.
Regional RV curvature.
The importance of shape characteristics of ventricular chambers has been appreciated for many years. Previous works, however, had been either of a qualitative nature or based on assumptions regarding ideal geometry of the ventricle. Our 3-D geometrical methodology uses an analytical approach to extract local differential properties and curvature information by means of local surface fitting (35, 44, 47, 48). This approach was proven to be robust and produces accurate results, as shown by Garimella and Swartz (12) and Cazals and Pouget (6). Our approach is also quantitative in providing specific regional information, which can be extended to the characterization of 3-D RV, as demonstrated in the present study.
The common shape-related differential properties of surfaces are the Gaussian curvature (K = κ1κ2) and the mean curvature [H = (κ1 + κ2)/2; Ref. 47]. The Gaussian curvature is considered to be the most widely used index of surface shape, and it depends only on the intrinsic geometry of the surface albeit it does not describe the extent of surface bending. Koenderink and van Doom (24) have also shown that K is not very indicative of the local shape and have introduced a more significant measure of local shape known as curvedness (C). The curvedness value describes the magnitude of the curvature at a surface point. Since we are interested in the magnitude or extent of curvature locally, we chose parameter C as the curvature metric for analyzing RV regional shape. Our results show that the RV in a TOF patient has significantly lower surface curvedness compared with a normal RV from basal to apical levels. This is explicitly demonstrated by the lower systolic function (i.e., RVEF and area strain).
Regional RV area strain.
The rationale for using area strain [i.e., ln(SAES/SAED)] to quantify RV deformation is as follows: 1) since area is the product of length and width, area strain can be regarded as a parameter that integrates the regional consequences of deformation in longitudinal, circumferential, and radial dimensions; and 2) several definitions have been employed like Lagrangian strain and natural strain (27). Lagrangian strain is defined as (SA-SA0)/SA0, where SA is the instantaneous area and SA0 is the area corresponding to a state of zero stress. Natural strain is defined as ln(SA/SA0). If the strains are small, natural strain, and Lagrangian strain are approximately equal. For large deformations (as may occur during the ejection phase of the cardiac cycle), however, the difference between natural and Lagrangian strain is significant and the natural strain definition is preferred (27). Since surface area at zero-stress state is practically difficult to measure, SA0 is generally replaced by a preload area. Here, we measured the total strain during ejection phase, given by ln(SAES/SAED), so that SA0 can be omitted. The 3-D area strain may provide more accurate endocardial information because 3-D area strain coupled with both 3-D longitudinal and circumferential directions is considered to be most sensitive to changes in myocardial function (26, 31).
Limitations of study.
This cohort does not represent the entire spectrum of patients with rTOF, at least in part due to lack of patients with mild PR. Due to clinical constraints, only patients with moderate to severe longstanding PR are generally recommended for MR scan. Furthermore, the small number of subjects in this study does not allow a range of evaluation of these changes over a period of time postoperatively and over a wider range of RV volume overload. Until now, the MR velocity mapping is the only imaging technique that provides practical quantification of PR volume and multisection gradient-echo cine MRI is used to obtain accurate measurements of biventricular size, EF, and wall mass to quantify RV function. The present study goes one step further: to present a new method for 3-D shape and area strain analysis of the entire RV and provide new insights into the geometry and function of the RV. In addition to the well-known ED volume, this novel MRI-based approach describes the decrease in wall surface curvedness and area strain, which may demonstrate RV remodeling and may help to aid optimal timing for RV repair.
The evaluation of the surface curvature depends on factors such as image resolution and the surface reconstruction process (47). The spacing between short-axis image slices for cardiac MRI in clinical practice is typically ∼5–10 mm. Therefore, a considerable amount of interpolation between image slices has been used, and this may affect the accuracy of the curvature evaluation. The accuracy of the surface curvature also depends on the mesh quality and sampling density of the RV models, since the geometrical properties of each surface point are computed using additional information from the neighboring vertices. Due to the resolution of MRI and a more intricate shape of the apical region, segmentation of RV contours is often more difficult in the apical region than in the mid and basal regions. This may affect the evaluation of the regional curvedness at the apical region, especially at end systole. There are several parameters developed to quantify regional myocardial function, such as circumferential or radial strain. Indeed, traditional techniques of regional ventricular function parameters (i.e., regional circumferential or radial strain) depend on assumptions about the coordinates, reference, and uniformity of ventricular contraction. The present method of area strain was developed to allow quantification of regional deformation and is independent of these assumptions. Furthermore, circumferential and radial strains are also affected by axis rotation during the cardiac cycle. The comparison of these strains with area strain remains a task for the future.
Summary and conclusions.
A new MRI-based approach was introduced for assessing the RV shape using curvedness and deformation (i.e., area strain). In rTOF patients, a decrease of ED and ES curvedness and area strain was observed, compared with normal subjects. This decrease in wall surface curvature and area strain may be an important prognostic marker of RV remodeling.
APPENDIX A: COMPUTATION OF AREA STRAIN USING 3-D ANALYSIS
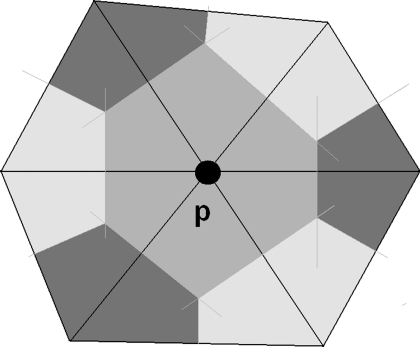
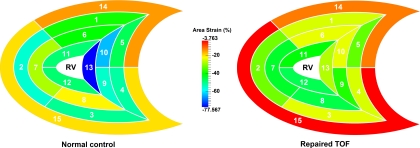
Area strain, based on 3-D wall motion tracking, was recently introduced for use in clinical (31) studies. Here, we extend this concept to determine area strain of the RV using a 3-D approach. To calculate the area strain experienced by a particular region of the RV, it is necessary to collect the vertices that lie within this region of the RV surface meshes at both ED and ES. These vertices are determined by following the procedure specified in appendix b. The regional surface area is then derived from the sum of Voronoi areas subtended by all the vertices in this region. In Fig. A1, the Voronoi area subtended by vertex p is the area in gray, which is the area around point p bounded by perpendicular lines that bisect the edges corresponding to the point p (5). In Fig. A2, area strain mapping in 15 segments of RV in a rTOF and a normal heart is shown.
Fig. A1.
Voronoi areas subtended by a vertex p.
Fig. A2.
Area strain mapping in 15 segments of RV in a rTOF and a normal heart. Color coding of the magnitude of area deformation is more uniform in the normal than that in rTOF. Value of area strain is lower in rTOF.
APPENDIX B: RV NOMENCLATURE AND SEGMENTATION
RV nomenclature.
We classified the RV surface into 15 regions, comprising 5 horizontal segments each on the basal and mid levels, 3 horizontal segments on the apical level, and RV outlet (segment 14) and RV inlet (segment 15) as depicted in Fig. 3. Note that the resolution of the partitions at the septal wall is consistent with the standardized LV nomenclature (7). The classification is defined empirically based on an approximated ratio of horizontal circumference of the septal to the lateral walls (i.e., 2:3 for the basal and mid levels and 1:2 for the apical level). The anterior intersection point of the LV epicardial border and the RV septal wall at the basal layer marks the start of region 1 of the RV. As a result, the RV segments are named as follows (see Fig. 3): 1) basal anterior, 2) basal lateral, 3) basal inferior, 4) basal inferoseptal, 5) basal anteroseptal, 6) midanterior, 7) midlateral, 8) midinferior, 9) midinferoseptal, 10) midanteroseptal, 11) apical anterior, 12) apical inferior, 13) apical septal, 14) RV outlet, and 15) RV inlet.
RV segmentation.
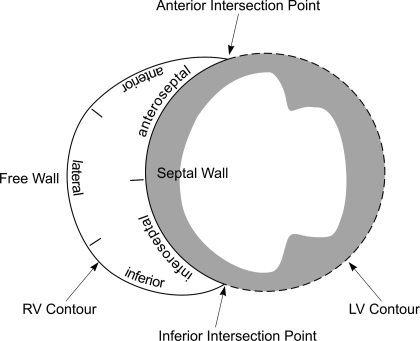
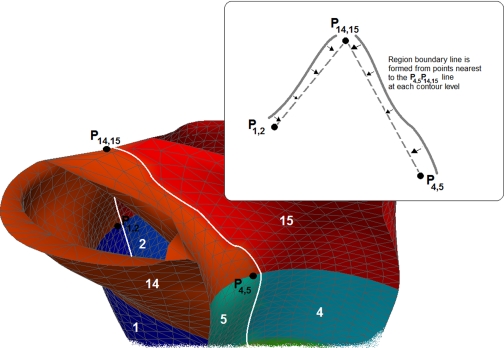
The RV surface is reconstructed from contours that are manually segmented from MRI scans. To obtain the RV contours, we used two sets of intersecting contours to mark the anterior and inferior intersection points at each RV contour (see Figs. B1 and B2). These intersection points line up to form two boundaries on the RV mesh separating the septal wall and the free wall (see Fig. B3).
Fig. B1.
Schematic drawing of RV segmentation. Two sets of intersecting contours were traced to mark the anterior and inferior intersection points at each RV contour. These intersection points line up to form two boundaries on the RV mesh separating 2 walls: the septal wall and the free wall.
Fig. B2.
Segments of the RV. The 3 longitudinal levels were termed basal, mid, and apical. In the basal and mid levels, the horizontal regions were termed anterior, lateral, and inferior for free wall, and inferior and anterior for septal wall based on the 2:3 ratio of circumference. In the apical level, the horizontal regions were termed anterior and inferior for the free wall and septal (for the septal wall based on 1:2 ratio of circumference). RV outlet (segment 14) component was deemed to extend from the distal border of basal section to the attachments of the leaflets of the pulmonary valve. RV inlet (segment 15) was deemed to extend from the atrioventricular junction to the distal border of basal section.
Fig. B3.
P14,15 is a midpoint separating RV inlet and RV outlet when it starts branching up, while P1,2 and P4,5 are the points that mark the boundary between segments 1 and 2 and the boundary between segments 4 and 5, respectively. The 2 boundary lines between RV Inlet and RV outlet (segments 14 and 15) are formed nearby the lines P1,2P14,15 and P4,5P14,15. Each of these lines is determined by nearest points on the mesh at each level of RV inlet and RV outlet contours.
GRANTS
This work was supported in part by research grants from the SingHealth Foundation SHF/FG408/2009, the Agency for Science, Technology and Research (A*STAR), SERC Grant 0921480071, and National Heart, Lung, and Blood Institute Grant HL-084529.
DISCLOSURES
No conflicts of interest, financial or otherwise, are declared by the author(s).
AUTHOR CONTRIBUTIONS
Author contributions: L.Z., L.G., Y.S., J.-L.T., D.N.G., T.C., R.-S.T., and G.S.K. conception and design of research; L.Z., L.G., and Y.S. performed experiments; L.Z., L.G., Y.S., J.-L.T., D.N.G., T.C., R.-S.T., and G.S.K. analyzed data; L.Z., L.G., J.-L.T., D.N.G., T.C., R.-S.T., and G.S.K. interpreted results of experiments; L.Z. prepared figures; L.Z. drafted manuscript; L.Z., L.G., Y.S., J.-L.T., D.N.G., T.C., R.-S.T., and G.S.K. edited and revised manuscript; L.Z., L.G., Y.S., J.-L.T., D.N.G., T.C., R.-S.T., and G.S.K. approved final version of manuscript.
REFERENCES
- 1.Anderson RH, Becker AE. The Morphologically Right Ventricle Cardiac anatomy. London: Gower Medical, 1980, p. 3.12–3.24 [Google Scholar]
- 2.Babu-Narayan SV, Kilner PJ, Li W, Moon JC, Goktekin Davlouros PA O, Khan M, Ho SY, Pennell DJ, Gatzoulis MA. Ventricular fibrosis suggested by cardiovascular magnetic resonance in adults with repaired tetralogy of Fallot and its relationship to adverse markers of clinical outcome. Circulation 113: 405–413, 2006 [DOI] [PubMed] [Google Scholar]
- 3.Bacha EA, Scheule AM, Zurakowski D, Erickson LC, Hung J, Lang P, Mayer JE, Jr, del Nido PJ, Jonas RA. Long-term results after early primary repair of tetralogy of Fallot. J Thorac Cardiovasc Surg 122: 154–161, 2001 [DOI] [PubMed] [Google Scholar]
- 4.Bellenger NG, Francis JM, Davies CL, Coats A, Pennell DJ. Establishment and performance of a magnetic resonance cardiac function clinic. J Cardiovasc Magn Reson 2: 15–22, 2000 [DOI] [PubMed] [Google Scholar]
- 5.Bowyer A. Computing Dirichlet tessellations. Comput J 24: 162–166, 1981 [Google Scholar]
- 6.Cazals F, Pouget M. Estimating differential quantities using polynomial fitting of osculating jets. Comput Aided Geom Des 22: 121–146, 2005 [Google Scholar]
- 7.Cerqueira MD, Weissman NJ, Dilsizian V, Jacobs AK, Kaul S, Laskey WK, Pennell DJ, Rumberger JA, Ryan T, Verani MS. Standardized myocardial segmentation and nomenclature for tomographic imaging of the heart: A statement for healthcare professionals from the Cardiac Imaging Committee of the Council on Clinical Cardiology of the American Heart Association. Circulation 105: 539–542, 2002 [DOI] [PubMed] [Google Scholar]
- 8.Cheung MM, Konstantinov IE, Redington AN. Late complications of repair of tetralogy of Fallot and indications for pulmonary valve replacement. Semin Thorac Cardiovasc Surg 17: 155–159, 2005 [DOI] [PubMed] [Google Scholar]
- 9.D'Andrea Caso P A, Sarubbi B, Russo MG, Ascione L, Scherillo M, Cobrufo M, Calabro P. Right ventricular myocardial dysfunction in adult patients late after repair of tetralogy of Fallot. Int J Cardiol 94: 213–220, 2004 [DOI] [PubMed] [Google Scholar]
- 10.Debatin J, Nadel SN, Sostman HD, Spritzer CE, Evans AJ, Grist TM. Magnetic resonance imaging-cardiac ejection fraction measurements. Phantom study comparing four different methods. Invest Radiol 27: 198–204, 1992 [PubMed] [Google Scholar]
- 11.Folino AF, Daliento L. Arrhythmias after tetralogy of Fallot repair. Indian Pacing Electrophysiol J 5: 312–324, 2005 [PMC free article] [PubMed] [Google Scholar]
- 12.Garimella RV, Swartz BK. Curvature Estimation for Unstructured Triangulations of Surfaces. Los Alamos, NM: Los Alamos National Library, 2003 [Google Scholar]
- 13.Gatzoulis MA, Balaji S, Webber SA, Siu SC, Hokanson JS, Polie C, Rosenthal M, Nakazawa M, Moller JH, Gillette PC, Webb GS, Redington AN. Risk factors for arrhythmia and sudden cardiac death late after repair of tetralogy of Fallot: a multicentre study. Lancet 356: 975–981, 2000 [DOI] [PubMed] [Google Scholar]
- 14.Gaudio C, Tanzilli G, Mazzarotto P, Motolese M, Romeo F, Marino B, Reale A. Comparison of left ventricular ejection fraction by magnetic resonance imaging and radionuclide ventriculography in idiopathic dilated cardiomyopathy. Am J Cardiol 67: 411–415, 1991 [DOI] [PubMed] [Google Scholar]
- 15.Gengsakul A, Harris L, Bradley TJ, Webb GD, Williams WG, Siu SC, Merchant N, McCrindle BW. The impact of pulmonary valve replacement after tetralogy of Fallot repair: a matched comparison. Eur J Cardiothorac Surg 32: 462–468, 2007 [DOI] [PubMed] [Google Scholar]
- 16.Germain P, Roul G, Kastler B, Mossard J, Bareiss P, Sacrez A. Inter-study variability in left ventricular mass measurement. Comparison between M-mode echocardiography and MRI. Eur Heart J 13: 1011–1019, 1992 [DOI] [PubMed] [Google Scholar]
- 17.Geva T. Repaired tetralogy of Fallot: the roles of cardiovascular magnetic resonance in evaluating pathophysiology and for pulmonary valve replacement decision support. J Cardiovasc Magn Reson 13: 9, 2011 [DOI] [PMC free article] [PubMed] [Google Scholar]
- 18.Geva T. Indications and timing of pulmonary valve replacement after tetralogy of Fallot repair. Semin Thorac Cardiovasc Surg Pediatr Card Surg Annu 9: 11–22, 2006 [DOI] [PubMed] [Google Scholar]
- 19.Helbing WA, de Roos A. Clinical applications of cardiac magnetic resonance imaging after repair tetralogy of Fallot. Pediatr Cardiol 21: 70–79, 2000 [DOI] [PubMed] [Google Scholar]
- 20.Helbing WA, de Roos A. Optimal imaging in assessment of right ventricular function in tetralogy of Fallot with pulmonary regurgitation. Am J Cardiol 82: 1561–1572, 1998 [PubMed] [Google Scholar]
- 21.Henkens IR, van Straten A, Schalij MJ, Hazekamp MG, de Roos A, van der Wall EF, Vliegen HW. Predicting outcome of pulmonary valve replacement in adult tetralogy of Fallot patients. Ann Thorac Surg 83: 907–911, 2007 [DOI] [PubMed] [Google Scholar]
- 22.Katz NM, Blackstone EH, Kirklin JW, Pacifico AD, Bargeron LM., Jr Late survival and symptoms after repair of tetralogy of Fallot. Circulation 65: 403–410, 1982 [DOI] [PubMed] [Google Scholar]
- 23.Knauth AL, Gauvreau K, Powell AJ, Landzber g MJ, Walsh EP, Lock JE, Delnido PJ, Geva T. Ventricular size and function assessed by cardiac MRI predict major adverse clinical outcomes late after tetralogy of Fallot. Heart 94: 211–216, 2008 [DOI] [PubMed] [Google Scholar]
- 24.Koenderink JJ, Van Doom AJ. Surface shape and curvature scales. Image Vision Comput 10: 557–565, 1992 [Google Scholar]
- 25.Lessick J, Sideman S, Azhari H, Shapiro E, Weiss JL, Beyar R. Evaluation of regional load in acute ischemia by three-dimensional curvature analysis of the left ventricle. Ann Biomed Eng 21: 147–161, 1993 [DOI] [PubMed] [Google Scholar]
- 26.Li S, Wong SJ, Cheung YF. Novel area strain based on three-dimensional wall motion analysis for assessment of global left ventricular performance after repair of tetralogy of Fallot. J Am Soc Echocardiogr 4: 819–825, 2011 [DOI] [PubMed] [Google Scholar]
- 27.Mirsky I, Parmley WW. Assessment of passive elastic stiffness for isolated heart muscle and the intact heart. Circ Res 33: 233–243, 1973 [DOI] [PubMed] [Google Scholar]
- 28.Murphy JG, Gersh BJ, Mair DD, Fuster V, McGoon M, Strup DM, II, DC McGoon Kirklin JW, Danielson GK. Long-term outcome in patients undergoing surgical repair of tetralogy of Fallot. N Engl J Med 329: 593–599, 1993 [DOI] [PubMed] [Google Scholar]
- 29.Nollert G, Fischlein T, Bouterwek S, Bohmer C, Klinner W, Reichart B. Long-term survival in patients with repair of tetralogy of Fallot: 36-year follow-up of 490 survivors of the first year after surgical repair. J Am Coll Cardiol 30: 1374–1383, 1997 [DOI] [PubMed] [Google Scholar]
- 30.Oosterhof T, Vliegen HW, Meijboom FJ, Zwinderman AH, Bouma B, Mulder BJ. Long-term effect of pulmonary valve replacement on QRS duration in patients with corrected tetralogy of Fallot. Heart 93: 506–509, 2007 [DOI] [PMC free article] [PubMed] [Google Scholar]
- 31.Perez de Isla L, Balcones DV, Fernandez-Golfin C, Marcos-Alberca P, Almeria C, Rodrigo JL, Macaya C, Zamorano J. Three-dimensional-wall motion tracking: a new and faster tool for myocardial strain assessment: comparison with two-dimensional-wall motion tracking. J Am Soc Echocardiogr 22: 325–330, 2009 [DOI] [PubMed] [Google Scholar]
- 32.Sanchez-Quintana D, Anderson RH, Ho SY. Ventricular myoarchitecture in tetralogy of Fallot. Heart 76: 280–286, 1996 [DOI] [PMC free article] [PubMed] [Google Scholar]
- 33.Semelka R, Tomei E, Wagners S, Mayo J, Kondo C, Suzuki J, Caputo G, Higgins C. Normal left ventricular dimensions and function: reproducibility of measurements with cine MR imaging. Radiology 174: 763–768, 1990 [DOI] [PubMed] [Google Scholar]
- 34.Sheehan FH, Ge SP, Wesley Vick G, III, Urnes K, Kerwin WS, Bolson EL, Chung T, Kovalchin JP, Sahn DJ, Jerosch-Herold M, Stolpen AH. Three-dimensional shape analysis of right ventricular remodeling in repaired Tetralogy of Fallot. Am J Cardiol 101: 107–113, 2008 [DOI] [PubMed] [Google Scholar]
- 35.Su Y, Zhong L, Lim CW, Ghista DN, Chua T, Tan RS. A computational geometrical approach for evaluating left ventricular remodeling in myocardial infarct patients. Comput Methods Programs Biomed 2011 Apr 18 [Epub ahead of print] [DOI] [PubMed] [Google Scholar]
- 36.Tang D, Yang C, Geva T, del Nido PJ. Patient-specific MRI-based 3D FSI RV/LV/patch models for pulmonary valve replacement surgery and patch optimization. J Biomech Eng 130: 130–140, 2008 [DOI] [PMC free article] [PubMed] [Google Scholar]
- 37.Therrien J, Siu SC, McLaughlin PR, Liu PP, Williams WG, Webbb GD. Pulmonary valve replacement in adults late after repair of tetralogy of Fallot: are we operating too late? J Am Coll Cardiol 36: 1670–1675, 2000 [DOI] [PubMed] [Google Scholar]
- 38.Tsujioka K, Ogasawara O, Mito K, Haramatsu O, Wada Y, Goto M, Matsuoka S, Kagiyama M, Kajiya F. Piezoelectric polymer curvature sensor for measurement of regional curvature radius of LV wall. Am J Physiol Heart Circ Physiol 254: H1010–H1016, 1988 [DOI] [PubMed] [Google Scholar]
- 39.van Straten A, Vliegen HW, Hazekamp MG, Bax JJ, Schoof PH, Ottenkamp J, van der Wall EE, de Roos A. Right ventricular function after pulmonary valve replacement in patients with tetralogy of Fallot. Radiology 233: 824–829, 2004 [DOI] [PubMed] [Google Scholar]
- 40.Vliegen HW, van Straten A, de Roos A, Roest AAW, Schoof PH, Zwinderman AH, Ottenkamp J, van der Wall EE, Hazekamp MG. Magnetic resonance imaging to assess the hemodynamic effects of pulmonary valve replacement in adults late after repair of tetralogy of Fallot. Circulation 106: 1703–1707, 2002 [DOI] [PubMed] [Google Scholar]
- 41.Vogel M, Gutberlet M, Dittrich S, Hosten N, Lange PE. Comparison of transthoracic three dimensional echocardiography with magnetic resonance imaging in the assessment of right ventricular volume and mass. Heart 78: 127–130, 1997 [DOI] [PMC free article] [PubMed] [Google Scholar]
- 42.Warner KG, Anderson JE, Fulton DR. Restoration of the pulmonary valve reduces right ventricular volume overload after previous repair of tetralogy of Fallot. Circulation 88: II189–II197, 1993 [PubMed] [Google Scholar]
- 43.Weyman AE, Wann S, Feigenbaum H, Dillon JC. Mechanism of abnormal septal motion in patients with right ventricular overload: a cross section echocardiographic study. Circulation 54: 179–186, 1976 [DOI] [PubMed] [Google Scholar]
- 44.Yeo SY, Zhong L, Su Y, Tan RS, Ghista DN. A Curvature-based approach for left ventricular shape analysis from cardiac magnetic resonance imaging. Med Biol Eng Comput 47: 313–322, 2009 [DOI] [PubMed] [Google Scholar]
- 45.Yim PJ, Ha B, Ferreiro JI, Henry GW, Branch CA, Johnson TA, Lucas CL. Diastolic shape of the right ventricle of the heart. Ana Rec 250: 316–324, 1998 [DOI] [PubMed] [Google Scholar]
- 46.Zhong L, Ghista DN, Ng EYK, Lim ST, Chua T, Lee CN. Left ventricular shape-based contractility index. J Biomech 39: 2397–2409, 2006 [DOI] [PubMed] [Google Scholar]
- 47.Zhong L, Su Y, Yeo SY, Tan RS, Ghista DN, Kassab GS. Left ventricular regional wall curvedness and wall stress in patients with ischemic dilated cardiomyopathy. Am J Physiol Heart Circ Physiol 296: H573–H584, 2009 [DOI] [PMC free article] [PubMed] [Google Scholar]
- 48.Zhong L, Su Y, Gobeawan L, Srikanth S, Tan RS, Kurra V, Navia JL, Ghista DN, Guccione J, Kassab G. Impact of surgical ventricular restoration on ventricular shape, wall stress and function in heart failure patients. Am J Physiol Heart Circ Physiol 300: H1653–H1660, 2011 [DOI] [PMC free article] [PubMed] [Google Scholar]


