Abstract
Interleukin (IL)-1β is involved in several brain functions, including sleep regulation. It promotes non-rapid eye movement (NREM) sleep via the IL-1 type I receptor. IL-1β/IL-1 receptor complex signaling requires adaptor proteins, e.g., the IL-1 receptor brain-specific accessory protein (AcPb). We have cloned and characterized rat AcPb, which shares substantial homologies with mouse AcPb and, compared with AcP, is preferentially expressed in the brain. Furthermore, rat somatosensory cortex AcPb mRNA varied across the day with sleep propensity, increased after sleep deprivation, and was induced by somnogenic doses of IL-1β. Duration of NREM sleep was slightly shorter and duration of REM sleep was slightly longer in AcPb knockout than wild-type mice. In response to lipopolysaccharide, which is used to induce IL-1β, sleep responses were exaggerated in AcPb knockout mice, suggesting that, in normal mice, inflammation-mediated sleep responses are attenuated by AcPb. We conclude that AcPb has a role in sleep responses to inflammatory stimuli and, possibly, in physiological sleep regulation.
Keywords: brain-specific accessory protein knockout, interleukin-1, lipopolysaccharide, immune response, cytokines, growth hormone-releasing hormone
interleukin (IL)-1β is well characterized for its role in sleep regulation (15). Injection of IL-1β into the brain or systemically induces excess non-rapid eye movement (NREM) sleep. Conversely, inhibition of IL-1β by using anti-IL-1β antibodies (29), the IL-1 receptor (IL-1R) antagonist (41), or the IL-1 soluble receptor (12) inhibits sleep. Brain IL-1β mRNA varies with the time of day, with high levels when duration of NREM sleep is long. Furthermore, sleep loss, a condition leading to sleepiness and excessive sleep if subjects are allowed to sleep, is associated with enhanced IL-1β mRNA in brain (37). IL-1β is produced by various cells, including neurons and glia, and acts on the IL-1 type I receptor (IL-1R) to elicit sleep (8, 15). Mice lacking the IL-1R have less spontaneous sleep and do not have sleep responses if given exogenous IL-1β (8).
The IL-1R requires receptor adaptor proteins for manifestation of IL-1β activity. One of these adaptor proteins is the IL-1R accessory protein (AcP), which binds to the IL-1/IL-1R complex, triggering a signaling cascade (7). Recently, an alternatively spliced isoform of IL-1R AcP, the brain-dominant IL-1R AcP (IL-1R AcPb), was cloned and characterized (34). Although the function of IL-1R AcPb remains unknown, Smith et al. (34) provide evidence suggesting that AcPb protects against neuronal loss induced by inflammatory stimuli.
The IL-1R AcP associates with the IL-1R and modulates the activity of IL-1 family members, including IL-1β (34). A 70% reduction in IL-1β binding has been reported in mice lacking IL-1R AcP (5). The IL-1R AcPb seems to bind to the IL-1R/IL-1 complex in the presence of IL-1R AcP and alters the subsequent signaling response (34). However, the specific pathway by which IL-1R AcPb alters IL-1β signaling remains unknown. Regardless, the IL-1R/IL-1/IL-1R AcP complex leads to recruitment of intracellular signaling molecules, which underlies the ability of IL-1 to regulate host defense and tissue homeostasis (34). The IL-1β/IL-1R/IL-1R AcP complex then activates NF-κB intracellularly, leading to changes in cellular functions, some of which enhance sleeplike states (18, 20).
LPS, a component of the outer membrane of gram-negative bacteria, promotes inflammation and sleep (16). LPS activates Toll-like receptor 4, which leads to the activation of many proinflammatory cytokines, including brain IL-1β (4). Intraperitoneal, intracerebroventricular, or intravenous injection of LPS enhances NREM sleep and attenuates rapid eye movement (REM) sleep in rabbits (16, 23), rats (3, 13, 21), mice (25), and humans (26, 33).
In the present study, we 1) cloned AcPb for another rodent species, the rat, 2) compared AcPb mRNA expression in rat tissues with that reported in the mouse, 3) determined if rat AcPb mRNA expression varied with sleep propensity, and 4) showed that sleep responses to LPS in mice lacking AcPb are exaggerated, suggesting a normal inhibitory role for AcPb in IL-1β signaling in the brain.
MATERIALS AND METHODS
All experimental protocols were approved by the Washington State University Animal Care and Use Committee and were in compliance with the National Institutes of Health guidelines.
Experiments 1–4: Tissue Samples and Total RNA Isolation From Rats
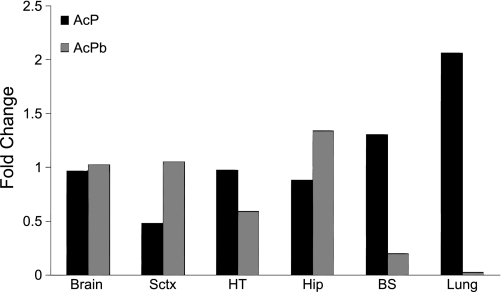
Male Sprague-Dawley rats (280–350 g) were purchased from Taconic Farms (Germantown, NY) and acclimated to a 12:12-h light-dark cycle at 23°C. Separate groups of rats were used in experiments 1–4. In experiments 2–4, we used rat mRNA/cDNA samples previously generated and analyzed for different purposes (18, 39). In experiment 1, brain samples were taken from four rats and pooled. One-half of the brain was not dissected further and used as a comparison for other tissue samples. The hypothalamus, somatosensory cortex (Sctx), hippocampus, brain stem, and lung were harvested from each rat and pooled, and RNA was extracted to compare relative AcPb tissue expression with that described previously for mice (34). Pooled tissue samples were kept separate to determine the distribution of AcP and AcPb mRNAs (Fig. 1). In experiments 2–4, groups of rats (n = 10 each) were used. In experiment 2, rats were allowed to sleep normally (control group) or sleep-deprived by gentle handling for 6 h during the first 6 h of the light period (18). The rats were killed 6 h after lights were turned on, and tissue samples were collected. In experiment 3, one of six groups of rats was killed at 4-h intervals across the 24-h day, and brain samples were collected (18). In experiment 4, six groups of ketamine-xylazine-anesthetized rats were implanted with an intracerebroventricular cannula. After recovery, human recombinant IL-1β (0, 2.5, or 25 ng) was injected intracerebroventricularly at 1 h before dark onset, and the animals were killed 5 h later (39). The Sctx was quickly dissected and frozen in liquid nitrogen and stored at −80°C until processed. Total RNA was extracted using TRIzol reagent (Invitrogen, Carlsbad, CA) and treated with DNase I (Applied Biosystems, Foster City, CA) for 90 min at 37°C according to the product manual, as described elsewhere (39). The RNAs were stored at −80°C until they were used.
Fig. 1.
Expression of accessory protein (AcP) and brain-specific AcP (AcPb) mRNAs in rat brain [somatosensory cortex (Sctx), hypothalamus (HT), hippocampus (Hip), and brain stem (BS)] and lung samples. AcP and AcPb mRNA levels in pooled samples of rat tissues are expressed relative to levels in whole brain. Data are expressed as fold change normalized to cyclophilin A. Because tissue samples were pooled before RNA extraction, error bars are absent.
Generation and Screening of a Rat cDNA and Rapid Amplification of cDNA Ends
Generation of 5′ and 3′ RACE-Ready cDNA and rapid amplification of 5′ and 3′ cDNA ends (RACE) were performed using the Smart RACE cDNA amplification kit (Clontech Laboratories, Mountain View, CA). Rat brain RNA (1 μg total from various brain regions) was used as starting material to synthesize first-strand cDNA according to the manufacturer's instructions.
Rat AcPb cDNA was screened with two gene-specific primers (GSP) with 5′ or 3′ RACE-Ready cDNA used as a template in the subsequent PCR with universal primer mix (SMART RACE kit) according to the manufacturer's instructions. The primers were designed from mouse nucleotide sequences of AcPb (GenBank accession no. NM_001159318): GSP1 [5′-CAGACTCTTGGAGAGGAGGCTTACAGG-3′ (reverse)] and GSP2 [5′-TCCTATGCAAGAAATGTGGAAGAAGAGG-3′ (forward)]. The PCR products were analyzed with 1.2% agarose-ethidium bromide gels.
Sequencing analysis.
To obtain the full-length rat AcPb cDNA, forward and reverse primers (Table 1) were designed on the basis of the sequence obtained from the 5′ and 3′ RACE and used to amplify the full-length rat AcPb with 5′ or 3′ RACE cDNA as a template. The PCR consisted of 35 cycles of denaturation for 30 s at 94°C, annealing for 30 s at 68°C, and extension for 2 min at 72°C. A final extension step was performed for 10 min at 72°C. The appropriate sizes of the PCR products were confirmed with 1.2% agarose-ethidium bromide gel and then purified with a gel extraction kit (MinElute, Qiagen, Valencia, CA) and sequenced from the 5′ and 3′ ends using an automated DNA sequencer (model 377, Applied Biosystems) in the bioscience laboratory at Washington State University.
Table 1.
Primers used to amplify rat AcPb
| Primer | Sequence (5′-3′) | Position |
|---|---|---|
| AcPb-1 | CCTGTGCACTGGGAGTCTCATGG | 627–605 |
| AcPb-2 | GCTTGGACCAGGGCGCTGAAG | 93–113 |
| AcPb-3 | GCTCAGGACAACAATCATCCTTCGG | 1590–1566 |
| AcPb-4 | CCTATGCAAGAAATGTAGAAGAAGAGG | 1412–1438 |
| AcPb-5 | CAGACTCTTGGAGATCAGGCTTACAG | 2128–2103 |
| AcPb-6 | CTGTCGCTGCTGTGTCACCTACTGT | 2007–2031 |
AcPb, brain-specific accessory protein.
Expression of mRNA in Rat and Mouse Tissues
RNA was extracted with TRIzol reagent, first-strand cDNA was synthesized using SuperScript III (Invitrogen), and real-time RT-PCR was performed as previously described (40). Table 2 lists the primer sequences for rat AcP and AcPb and mouse AcPb, IL-1β, IL-1R, TNF-α, growth hormone-releasing hormone (GHRH) receptor (GHRHR), and cyclophilin A mRNA; the primer sequences for rat IL-1β and cyclophilin A mRNA are reported elsewhere (38). All the reactions were performed in duplicate or triplicate for each sample. Each reported cycle threshold (Ct) value was an average of these values. Then gene expression was evaluated using a comparative Ct method, as previously described (38).
Table 2.
Primers used in semiquantitative RT-PCR for mouse and rat samples
| Sequence (5′-3′) |
|||||
|---|---|---|---|---|---|
| Accession No. | Gene | Forward | Reverse | Size, bp | Tm, °C |
| NM_012968 | AcP | GGGCAACATCAACGTCATTTTAG | CAGCTCTTTCACCTTCATGTCCTT | 64 | 60 |
| NM_001167840 NM_001159318 | AcPb | GGAGTTTAAGCTGGGTGTCATGT | TGCTCAAGCGGACGGTACT | 80 | 60 |
| NM_008361 | IL-1β | CAACCAACACGTGATATTCTCCATG | GATCCACACTCTCCAGCTGCA | 152 | 60 |
| NM_013693 | TNFα | GGGACAGTGACCTGGACTGT | GCTCCAGTGAATTCGGAAAG | 77 | 58 |
| NM_001123382 | IL-1R1 | AACGTGAGCTTCTTCGGAGT | CCGGAACGTATAGGACATAC | 100 | 58 |
| NM_001003685 | GHRHR | CTGGCCTTGACATCCGTGTAC | GTCGAGCTGGCAGAAGTTCAG | 153 | 58 |
| NM_008907 | Cyclophilin A | AATGCTGGACCAAACACAAA | TCATGCCTTCTTTCACCTTC | 107 | 58 |
AcP, accessory protein; IL-1R1, IL-1 type I receptor; GHRHR, growth hormone-releasing hormone receptor; Tm, melting temperature.
Experiment 5: Mouse Sleep Experiments
Animals and surgery.
Male C57BL/6 mice (control strain), acquired from Taconic Farm, and male IL-1R AcPb knockout (KO) mice (experimental strain), provided by Amgen (Seattle, WA) via Taconic Farm, were bred for three to five generations at Washington State University. Subsequent homozygotic offspring were utilized in the experiments. Mice were maintained on a 12:12-h light-dark cycle (dark onset = time 0) in ventilated chambers (24°C). Mice were housed individually in standard caging with ad libitum access to food and water. Every animal was genotyped from tail snips by Transnetyx (Cordova, TN).
Surgery was performed at 7–10 wk of age on 19 wild-type (WT; 19–26 g body wt) and 20 AcPb KO (17–27 g body wt) mice. The animals were injected intraperitoneally with a ketamine-xylazine mixture (8.7 and 1.3 mg/ml, respectively), and lidocaine was applied locally to the surgical area. Five electroencephalographic (EEG) electrodes were implanted in each mouse (2 over the right parietal cortex, 2 over the left parietal cortex, and 1 over the cerebellum, serving as the ground), and one electromyographic (EMG) electrode was implanted into the dorsal neck muscles. Electrodes were electrically insulated and secured to the skull with dental cement, forming a pedestal. At least 7 days were allowed for surgical recovery and acclimation to the environmental changes.
Experimental procedure.
Polysomnographic recording cables were attached to the pedestals and tethered to minimize strain on the mice. After acclimation, mice were given saline injections (0.2 ml ip) prior to dark onset, and sleep was recorded for the next 24 h. On the next day, prior to dark onset, mice were injected intraperitoneally with one of three doses of LPS [0.05 μg (n = 6 for WT, n = 7 for KO), 0.1 μg (n = 6 for WT, n = 7 for KO), and 1 μg (n = 7 for WT, n = 6 for KO)], and 24-h sleep data were recorded. LPS doses were chosen on the basis of the literature (13, 21, 25) and the sleep responses of WT mice to LPS. Separate groups of mice were used for each dose of LPS.
Sleep recording data.
Recording cables were connected to commutators, which led to amplifiers. Amplified signals were digitalized (128-Hz sampling rate) and recorded by an analog-to-digital converter (National Instruments, Austin, TX). EEG signals <0.1 Hz and >100 Hz were filtered. Polysomnographic analysis was completed using Sleep Sign software (Kissei Comtec). EEG signals were analyzed in 10-s epochs. Each epoch was characterized as one of three vigilance states: NREM sleep, REM sleep, and wakefulness (W), as previously described (18). Succinctly, high-amplitude EEG signals and low-amplitude EMG activity are characteristic of NREM sleep. Low-amplitude EEG signals and minimal EMG activity are characteristic of REM sleep. W is characterized by low-amplitude fast EEG signals and high-amplitude EMG activity. Total vigilance state duration was calculated in 2-h time blocks, while vigilance state episode durations were calculated in 12-h time blocks.
EEG signals (μV2) were analyzed by fast Fourier transformation. NREM sleep EEG delta (0.5–4 Hz) power values [i.e., slow-wave activity (SWA)] were determined within each epoch. The means of the 24-h EEG SWA control values for each mouse were used as a reference value to normalize the data for the control and experimental treatment days, as previously described (18). EEG SWA values for each animal were determined in 2-h time bins and are presented as a percentage of the 24-h averaged saline reference values. Power spectrum analysis was performed in Sleep Sign using a Hanning window. EEG power spectra (μV2) were calculated in 0.5-Hz bins in the frequency range of 0.5–20 Hz for 24-h periods. Thus, a fractional percentage of the total power after saline injections was used for each animal. This value was the sum of the power in the 0.5- to 20-Hz frequency bands in 0.5-Hz bins from 2-h blocks averaged over 24 h and was used as a denominator to adjust individual differences in absolute power following LPS treatment. The time blocks used to assess cortical EEG power spectra were the first 12 h after LPS (hour 12 to hour 0), when EEG SWA during NREM sleep is attenuated (11, 18, 25).
Statistical analyses.
Two- and three-way mixed ANOVAs were used to assess strain, treatment, and time or frequency differences in NREM sleep, the amount of time spent in REM sleep, NREM sleep SWA, and NREM sleep spectral power. Post hoc comparisons were made with independent or paired t-tests when appropriate for the sleep data. A significance level of P < 0.05 was accepted.
Experiment 6: mRNA Responses to LPS in WT and AcPb KO Mice
Male C57BL/6NTac and AcPb KO mice were intraperitoneally injected with saline (0.2 ml) or LPS (0.1 μg in 0.2 ml of saline) at dark onset. Mice were killed 3 h after the injections, brains were excised, and Sctx and hypothalamus were dissected. The tissue was flash-frozen in liquid nitrogen and stored at −80°C until mRNA expression analysis, as described above for rats. Mouse primers are shown in Table 2. Independent t-tests were used to compare values obtained after saline injection with those obtained after LPS injection or the responses to LPS between strains.
RESULTS
Sequencing of AcPb cDNA
The rat AcPb cDNA construct was amplified by PCR with the RACE method and then sequenced as described in materials and methods. The cDNA was 2,852 bp long and contained a 2,058-bp open reading frame encoding 686 amino acids. The complete DNA sequence was deposited in GenBank (accession no. GU123169). The DNA sequence is located on chromosome 11q22. The deduced amino acid sequence for the putative rat AcPb showed a predicted signal peptide sequence (20 amino acids), an extracellular domain (339 amino acids), a single transmembrane domain (24 amino acids), and a long intracellular domain (302 amino acids) with 80%, 94%, 100%, and 98% homology to mouse AcPb, respectively.
Experiment 1: Expression of AcPb and AcP mRNA in Various Tissues
Rat AcPb and AcP mRNA were expressed in all normal tissues (hypothalamus, Sctx, hippocampus, brain stem, and lung tissues). AcPb mRNA expression was much lower in lung than brain tissue samples. AcP mRNA expression was higher in lung than brain (Fig. 1).
Experiment 2: Effect of Sleep Loss on AcP and AcPb mRNAs
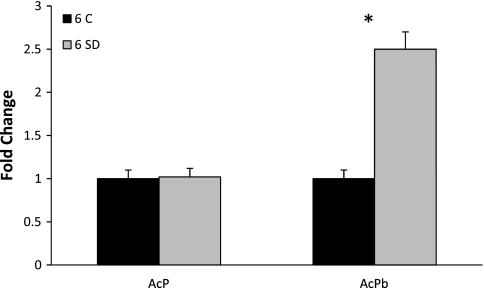
After 6 h of sleep deprivation, AcPb mRNA levels in the Sctx were elevated by twofold compared with time-matched rats allowed to sleep spontaneously (t = 7.26, P < 0.001; Fig. 2). In contrast, sleep deprivation did not affect AcP mRNA levels.
Fig. 2.
Sleep loss enhances AcPb expression. Rats were allowed normal sleep [control (6 C), n = 10] or were stroked with a soft paint brush when attempting to sleep [6 h of sleep deprivation (6 SD), n = 10]. In Sctx, AcPb mRNA increased 2-fold after 6 h of sleep deprivation relative to control group. AcP mRNA was not affected by sleep deprivation. Data are expressed as fold change relative to controls and normalized to cyclophilin A. *P < 0.05 (by Student's t-test).
Experiment 3: Diurnal Variation in AcPb mRNA Expression
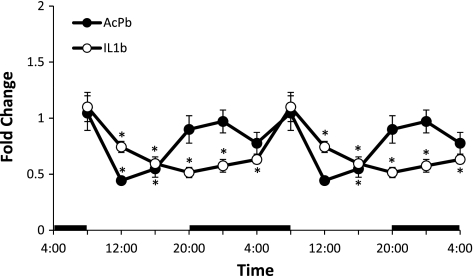
Diurnal variations in the relative levels of AcPb and IL-1β mRNAs in the Sctx were significant [AcPb: F(5,47) = 5.35, P < 0.001; IL-1β: F(5,47) = 8.28, P < 0.001]. In the Sctx, AcPb mRNA levels were higher at night and lower during daylight hours. In contrast, IL-1 mRNA levels were higher during the daytime and lower at night, confirming previous findings (36) (Fig. 3).
Fig. 3.
Real-time RT-PCR determination of diurnal variations in relative amounts of AcPb and IL-1β mRNAs in Sctx. Horizontal black bars indicate dark period. Relative levels of AcPb and IL-1β determined over one 24-h experimental period are double plotted. Values are means ± SE (n = 8) for each time point. Statistical comparisons were made using 1-way ANOVA followed by a post hoc analysis (Tukey's test) where applicable (*P < 0.05).
Experiment 4: Effect of IL-1β Treatment on AcP and AcPb mRNA
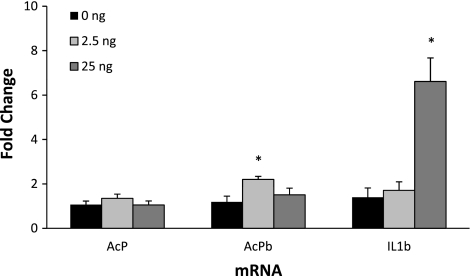
Intracerebroventricular injection of 25 ng of IL-1β stimulated Sctx IL-1β mRNA expression [F(2,23) = 13.10, P < 0.001; Fig. 4]. AcPb mRNA was significantly enhanced at 5 h after a lower dose (2.5 ng) of IL-1β [F(2,23) = 4.6, P < 0.02]. Sctx AcP mRNA was unaltered 5 h after intracerebroventricular injection of IL-1β (Fig. 4).
Fig. 4.
Effect of intracerebroventricular treatment with IL-1β (2.5 and 25 ng) on AcP, AcPb, and IL-1β mRNA expression after 5 h. AcPb mRNA was significantly increased 5 h after 2.5 ng of IL-1β, and IL-1β mRNA was upregulated 5 h after 25 ng of IL-1β. Values are means ± SE (n = 8) for each group. *P < 0.05 vs. saline (0 ng).
Experiment 5: Spontaneous Sleep and Sleep Responses to LPS in Mice
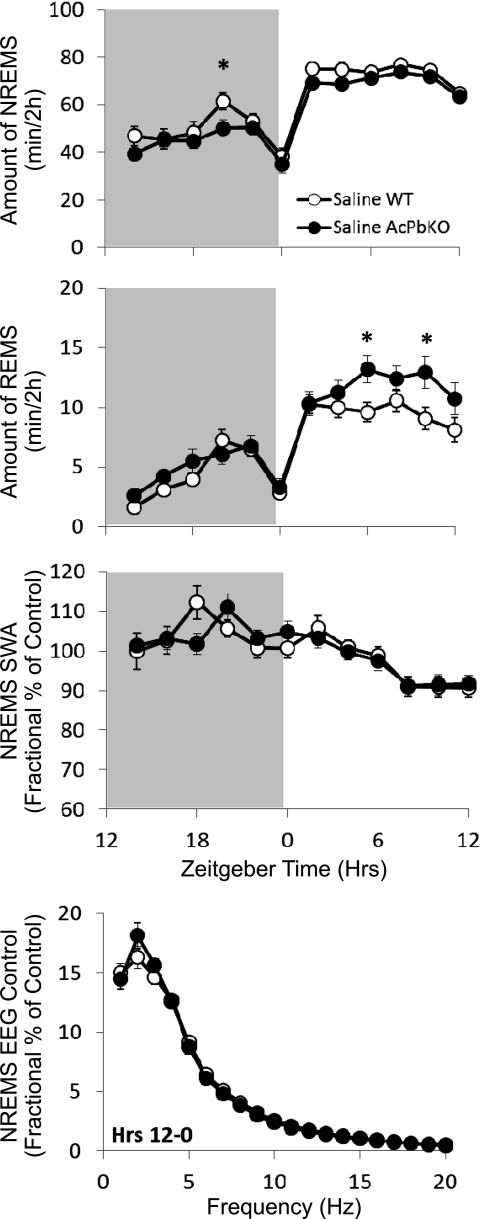
AcPb KO mice manifest less spontaneous NREM sleep [strain: F(1,37) = 4.81, P < 0.05] and more REM sleep [time × strain: F(11,770) = 2.02, P < 0.05] than WT mice. Overall, AcPb KO mice spent 20 min less time in NREM sleep and 3 min more time in REM sleep during the dark period and 23 min less time in NREM sleep and 12 min more time in REM sleep in the light period. No strain differences were detected in NREM sleep EEG SWA or NREM sleep power spectrum (Fig. 5).
Fig. 5.
Spontaneous sleep is altered in AcPb knockout (KO) mice. Strain differences between wild-type (WT) and AcPb KO mice in spontaneous NREM sleep (NREMS), REM sleep (REMS), NREM sleep EEG slow-wave activity (NREMS SWA), and NREM sleep EEG power. Spontaneous NREM sleep, REM sleep, and NREM sleep EEG SWA are represented as 2-h means across a 24-h period (shaded areas indicate dark period). NREM sleep EEG power is expressed as percentage of saline control in 1-Hz bin averages (±SE) extracted from the 12-h dark period. *P < 0.05.
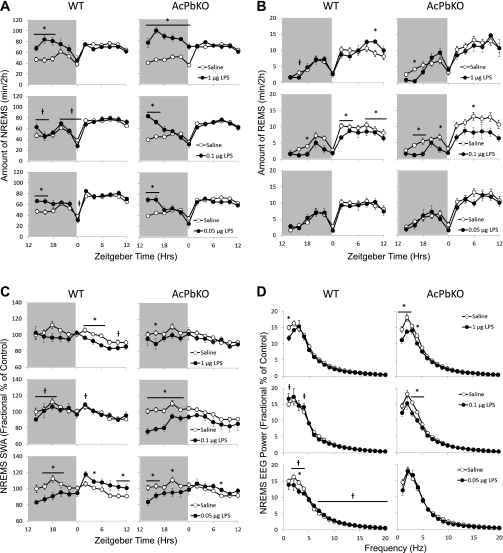
The magnitude of NREM sleep responses to LPS was higher in AcPb KO than WT mice across doses [treatment × strain: F(3, 70) = 4.36, P < 0.01], suggesting that AcPb is integral to mediating LPS-induced sleep responses. NREM sleep after the high LPS dose lasted twice as long in AcPb KO as in WT mice. At the intermediate LPS dose, no differences were detected in WT mice, while duration of NREM sleep in AcPb KO mice was increased during the first 4 h postinjection. The low LPS dose induced increases in NREM sleep duration over the first 4 h postinjection in both strains, although the difference from saline injection was larger in AcPb KO than WT mice (Fig. 6A).
Fig. 6.
AcPb KO mice are hypersensitive to LPS. Polysomnographic differences in NREM sleep (A), REM sleep (B), NREM sleep EEG SWA (C), and NREM sleep EEG power (D) were recorded in WT and AcPb KO mice injected intraperitoneally with saline and LPS (1, 0.1, and 0.05 μg). Data in A–C represent 2-h means across a 24-h period (shaded area indicates dark period). Data in D are expressed as percentage of saline control in 1-Hz bin averages (±SE) extracted from the 12-h dark period. *P < 0.05, saline vs. LPS. †P < 0.05, WT vs. AcPb KO.
REM sleep responses to LPS were more labile across doses [treatment: F(3, 70) = 5.60, P < 0.01]. After the high LPS dose, duration of REM sleep in the light period increased in WT mice, while AcPb KO mice spent almost no time in REM sleep in the early dark period. After the intermediate LPS dose, REM sleep was suppressed in both strains across the light and dark periods at multiple time points. No differences in REM sleep were evident in either strain following the low dose of LPS (Fig. 6B).
Heterogeneous NREM sleep EEG SWA effects were observed across LPS doses [treatment × strain: F(3, 70) = 5.34, P < 0.01]. After injection of the high dose of LPS, SWA in AcPb KO mice was significantly lower at 2–4 h, while SWA in WT mice was significantly higher at 20–22 h. Strain differences in SWA following the intermediate LPS dose were robust, such that SWA markedly decreased during the dark period in AcPb KO mice but no LPS-induced SWA response was observed in WT mice. After the low LPS dose, SWA was suppressed during the light and dark periods; however, the decrease was attenuated during the light period in AcPb KO mice (Fig. 6C).
The 12–0 h power spectra in WT mice decreased in the low-frequency range after high or low LPS doses compared with saline [treatment × strain: F(3, 70) = 5.74, P < 0.01]. In AcPb KO mice, the high and intermediate doses induced decreases in a broader low-frequency range (1, 2, and 4 Hz after the high dose and 3–4 Hz after the intermediate dose), while spectral power following the low dose of LPS was unchanged. However, the higher-frequency (7–20 Hz) bands were elevated after the low dose in WT mice compared with AcPb KO mice (Fig. 6D).
Experiment 6: mRNA Responses to LPS in WT and AcPb KO Mice
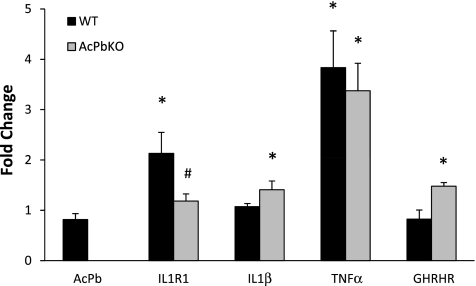
In response to 0.1 μg of LPS, IL-1R and TNF mRNAs were elevated in the Sctx of WT mice compared with saline-injected WT mice (Fig. 7). In the Sctx of AcPb KO mice, IL-1, TNF, and GHRHR mRNAs were elevated compared with saline-injected AcPb KO mice. There were differences between strains in the expression of IL-1R (P < 0.05) and GHRHR (P = 0.051) mRNAs: IL-1R mRNA was lower, while GHRHR mRNA was higher, in the AcPb KO than WT mice.
Fig. 7.
Sctx mRNA responses to LPS (0.1 μg ip) in WT and AcPb KO mice. AcPb mRNA was detected in WT, but not AcPb KO, mice. Somatosensory cortical IL-1 type I receptor (IL-1R1) and growth hormone-releasing hormone receptor (GHRHR) mRNA levels were different between strains after LPS (0.1 μg ip) treatment. *P < 0.05 vs. saline. #P < 0.05 vs. WT.
DISCUSSION
The major findings of this study are as follows. 1) The rat AcPb shares considerable sequence homology with the mouse AcPb, and its mRNA expression is higher in brain than in peripheral tissue. 2) Rat AcPb mRNA varies with sleep propensity in brain. 3) Sleep responses in AcPb KO mice differ from those in WT mice. 4) NREM sleep responses to LPS are exaggerated in AcPb KO mice. 5) The LPS-induced changes in IL-1R and GHRHR mRNAs in WT mice are different from those in AcPb KO mice. Collectively, these data indicate a role for AcPb in sleep responses to sleep loss and inflammatory signals.
The signaling function of AcPb is considerably different from that of AcP, despite the fact that it contains a Toll-IL-1R (TIR) domain, which usually mediates intracellular signaling in the IL-1 pathway (34). The slightly altered TIR structure in AcPb may prevent it from recruiting key signaling molecules and promoting cytokine induction. Smith et al. (34) report that the expression of only certain genes (e.g., Atf3, Icam1, and Cebpd) induced by IL-1 is inhibited when AcPb is coexpressed with AcP in the IL-1R signaling complex. Therefore, AcPb in the IL-1 signaling pathway is not an all-or-nothing inhibitor of AcP (and, thereby, IL-1 activity) but, rather, a protein that alters the quality of the IL-1 response by modifying gene expression patterns typically observed with AcP activity alone (34). Smith et al. posited that AcPb may inhibit IL-1 responses via competition with AcP and, consequently, the recruitment of MyD88 and IRAK4 into the intracellular complex (both molecules are within the IL-1 signaling pathway). Varying levels of AcPb activity may be needed to change expression of individual genes with different induction thresholds. This process was previously described for Erk-dependent activation of IL-1 and TNF genes (32). Furthermore, the signaling function initiated by AcPb may be insufficient for gene induction on its own but might be necessary for full induction of some genes, possibly in association with novel adaptor proteins expressed in the brain (14, 35). The current study sheds little light on the mechanisms of AcPb actions; thus, this issue remains unresolved. Regardless, AcPb may play a role in sleep regulation.
We analyzed Sctx samples for mRNA expressions, including rat AcPb mRNA responses to changes in sleep propensity, for several reasons. Previously, we showed that Sctx IL-1β mRNA and IL-1β protein levels are enhanced in response to increased afferent activity from whisker stimulation (10). Furthermore, sleep loss enhances cortical IL-1β mRNA expression (see Fig. 3 for IL-1β mRNA expression in the Sctx), and cortical IL-1 mRNA levels vary with the time of day, with higher levels during the sleep period (36, 37). Functionally, if IL-1β is applied directly to the Sctx, local EEG delta wave power is enhanced during NREM sleep, but not during REM sleep or W (43).
In contrast to IL-1 mRNA, Sctx expression of AcPb mRNA was greater during the active period (dark hours; Fig. 3), although, similar to IL-1β mRNA, levels were highest at the onset of light hours, suggesting that AcPb mRNA accumulated in the Sctx over the course of the active period and dissipated during the sleep period. This interpretation is consistent with the sleep loss-induced AcPb mRNA increase (Fig. 2). Cortical neuronal activity is higher during W and sleep deprivation than during periods of sleep (42). The higher neuronal activity would be associated with greater release of ATP into the extracellular space and its subsequent activation of caspase-1 and production of mature IL-1 (1, 9). Enhancement of Sctx AcPb mRNA by the lower dose (2.5 ng) of IL-1β (Fig. 4) is consistent with the interpretation that IL-1β and AcPb affect each other's expression and activity, although the specific mechanisms and timing of these interactions remain to be clarified. The low dose of IL-1 used in this study promotes sleep, while the higher dose inhibits sleep, in rats (30).
Current data are consistent with the hypothesis that sleep is a local use-dependent process (17, 19). Specifically, we posited that ATP, released from glia and neurons as a consequence of cell activity, enhances the production of mature IL-1β via the purine type 2 receptor (P2X7) and caspase-1 (18). IL-1, in turn, acts to change receptor populations for neuromodulators and neurotransmitters within nearby local networks. As a consequence, the receptivity of the local networks is dynamic and results in network state oscillations. Thus, for example, IL-1β is involved in glutamatergic (44) and GABAergic (2) neurotransmission, and it affects the expression of the adenosine purine type I receptor A2a (24). Glutamate, GABA, and adenosine are involved in sleep regulation (for review see Ref. 17).
The spontaneous sleep in AcPb KO mice was different from that observed in WT mice. The differences were small and became statistically significantly different only after all three groups in the LPS study were combined. Regardless, the duration of NREM sleep was shorter in the AcPb KO than WT mice, while the duration of REM sleep was longer in the AcPb KO mice. The finding that these results are just the opposite of those observed after LPS treatment, where the duration of NREM sleep was longer and the duration of REM sleep was shorter in AcPb KO than WT mice, suggests that there may be some biological relevance to the small spontaneous sleep differences between AcPb KO and WT mice. Furthermore, in mice lacking the IL-1R, the duration of REM sleep is shorter (8), and in the AcPb KO mice, where presumably IL-1 signaling is enhanced, the duration of REM sleep is longer. Nevertheless, since the functions of AcPb remain mostly unknown, the small differences in spontaneous sleep may simply be a consequence of disturbance of a physiological process that secondarily affects sleep.
The differences in sleep responses to LPS between the two strains of mice were very robust. AcPb KO mice had exaggerated increases in NREM sleep duration, larger decreases in REM sleep duration, and amplified reductions in EEG SWA in response to LPS compared with WT mice. Enhanced EEG SWA [also called delta (0.5–4 Hz) power] is often considered a measure of sleep intensity, because it is enhanced during the sleep that immediately follows sleep deprivation (31). Although AcPb mRNA varied with sleep propensity, it apparently plays little role in spontaneous EEG SWA, because NREM sleep EEG SWA was similar in WT and AcPb KO mice. However, intraperitoneal injection of LPS is associated with decreases in NREM sleep EEG SWA, and these responses are exaggerated in the AcPb KO mice, suggesting that AcPb is serving to limit sleep responses to inflammation, likely by inhibition of IL-1β signaling. Furthermore, these results are consistent with the prior suggestion that AcPb is neuroprotective during LPS-induced inflammation (34).
In response to LPS, there were strain differences in the expressions of the IL-1R1 and GHRHR mRNAs. Both of these receptors are involved in sleep regulation (8, 27). In fact, decreasing GHRH prior to IL-1 injections in rats blocks IL-1-induced increases in NREM sleep (28). Functional GHRHRs are found in the Sctx (22). Furthermore, individual neurons within the hypothalamus are responsive to IL-1 and GHRH, suggesting a common sleep cellular mechanism for these two molecules (6). However, WT and AcPb KO mice had differential IL-1R and GHRHR mRNA responses to LPS. IL-1R mRNA increased in WT, but not AcPb KO, mice. Furthermore, GHRHR mRNA increased in the AcPb KO, but not WT, mice in response to LPS. Because IL-1 induces GHRHR expression (39), this latter observation is consistent with a role of AcPb in limiting the actions of IL-1.
In conclusion, AcPb has a role in inflammatory sleep responses: it provides a break on LPS-enhanced NREM sleep and LPS inhibition of REM sleep. AcPb mRNA varies with spontaneous sleep propensity, although its role in physiological sleep regulation remains to be fully characterized.
GRANTS
This work was supported in part by National Institutes of Health Grants NS-025378, NS-031453, and HD-036520 (to J. M. Krueger).
DISCLOSURES
No conflicts of interest, financial or otherwise, are declared by the authors.
AUTHOR CONTRIBUTIONS
P.T., C.J.D., O.B., M.R.Z., F.L., and J.M.C. performed the experiments; P.T., C.J.D., O.B., and M.R.Z. analyzed the data; P.T., C.J.D., M.R.Z., D.E.S., and J.M.K. interpreted the results of the experiments; P.T., C.J.D., O.B., and M.R.Z. prepared the figures; P.T., C.J.D., M.R.Z., F.L., J.M.C., D.E.S., and J.M.K. edited and revised the manuscript; P.T., C.J.D., O.B., M.R.Z., F.L., J.M.C., D.E.S., and J.M.K. approved the final version of the manuscript; D.E.S. and J.M.K. are responsible for conception and design of the research; J.M.K. drafted the manuscript.
ACKNOWLEDGMENTS
We thank Andrew M. Elmer for technical help with surgeries, injections, and data analysis.
REFERENCES
- 1. Bianco F, Pravettoni E, Colombo A, Schenk U, Moller T, Matteoli M, Verderio C. Astrocyte-derived ATP induces vesicle shedding and IL-1β release from microglia. J Immunol 174: 7268–7677, 2005 [DOI] [PubMed] [Google Scholar]
- 2. Brambilla D, Franciosi S, Opp MR, Imeri L. Interleukin-1 inhibits firing of serotonergic neurons in the dorsal raphe nucleus and enhances GABAergic inhibitory post-synaptic potentials. Eur J Neurosci 26: 1862–1869, 2007 [DOI] [PubMed] [Google Scholar]
- 3. Bull DF, Exton MS, Husband AJ. Acute-phase immune response: lipopolysaccharide-induced fever and sleep alterations are not simultaneously conditionable in the rat during the inactive (light) phase. Physiol Behav 56: 143–149, 1994 [DOI] [PubMed] [Google Scholar]
- 4. Chow JC, Young DW, Golenbock DT, Christ WJ, Gusovsky F. Toll-like receptor-4 mediates lipopolysaccharide-induced signal transduction. J Biol Chem 274: 10689–10692, 1999 [DOI] [PubMed] [Google Scholar]
- 5. Cullinan EB, Kwee L, Nunes P, Shuster DJ, Ju G, McIntyre KW, Chizzonite RA, Labow MA. IL-1 receptor accessory protein is an essential component of the IL-1 receptor. J Immunol 161: 5614–5620, 1998 [PubMed] [Google Scholar]
- 6. De A, Churchill L, Obál F, Jr, Simasko SM, Krueger JM. GHRH and IL1β increase cytoplasmic Ca2+ levels in cultured hypothalamic GABAergic neurons. Brain Res 949: 209–212, 2002 [DOI] [PubMed] [Google Scholar]
- 7. Dinarello CA. Immunological and inflammatory functions of the interleukin-1 family. Annu Rev Immunol 27: 519–550, 2009 [DOI] [PubMed] [Google Scholar]
- 8. Fang J, Wang Y, Krueger JM. The effects of interleukin-1β on sleep are mediated by the type I receptor. Am J Physiol Regul Integr Comp Physiol 274: R655–R660, 1998 [DOI] [PubMed] [Google Scholar]
- 9. Ferrari D, Pizzirani C, Adinolfi E, Lemoli R, Curti A, Idzko M, Panther E, Di Virgilio F. The P2X7 receptor: a key player in IL-1 processing and release. J Immunol 176: 3877–3883, 2006 [DOI] [PubMed] [Google Scholar]
- 10. Hallett H, Churchill L, Taishi P, De A, Krueger JM. Whisker stimulation increases expression of nerve growth factor- and interleukin-1β-immunoreactivity in the rat somatosensory cortex. Brain Res 1333: 48–56, 2010 [DOI] [PMC free article] [PubMed] [Google Scholar]
- 11. Jhaveri KA, Trammell RA, Toth LA. Effect of environmental temperature on sleep, locomotor activity, core body temperature and immune responses of C57BL/6J mice. Brain Behav Immun 21: 975–987, 2007 [DOI] [PMC free article] [PubMed] [Google Scholar]
- 12. Imeri L, Opp MR, Krueger JM. An IL-1 receptor and an IL-1 receptor antagonist attenuate muramyl dipeptide- and IL-1-induced sleep and fever. Am J Physiol Regul Integr Comp Physiol 265: R907–R913, 1993 [DOI] [PubMed] [Google Scholar]
- 13. Kapás L, Hansen MK, Chang HY, Krueger JM. Vagotomy attenuates but does not prevent somnogenic and febrile effects of lipopolysaccharide in rats. Am J Physiol Regul Integr Comp Physiol 274: R406–R411, 1998 [DOI] [PubMed] [Google Scholar]
- 14. Kim Y, Zhou P, Qian L, Chuang JZ, Lee J, Li C, Iadecoia C, Nathan C, Ding A. MyD88-5 links mitochondria, microtubules, and JNK3 in neurons and regulates neuronal survival. J Exp Med 204: 2063–2074, 2007 [DOI] [PMC free article] [PubMed] [Google Scholar]
- 15. Krueger JM. The role of cytokines in sleep regulation. Curr Pharm Des 14: 3408–3416, 2008 [DOI] [PMC free article] [PubMed] [Google Scholar]
- 16. Krueger JM, Kubillus S, Shoham S, Davenne D. Enhancement of slow-wave sleep by endotoxin and lipid A. Am J Physiol Regul Integr Comp Physiol 251: R591–R597, 1986 [DOI] [PubMed] [Google Scholar]
- 17. Krueger JM, Rector DM, Sandip R, Van Dongen HPA, Belenky G, Panksepp J. Sleep as a fundamental property of neuronal assemblies. Nat Rev Neurosci 9: 910–919, 2008 [DOI] [PMC free article] [PubMed] [Google Scholar]
- 18. Krueger JM, Taishi P, De A, Davis C, Winters BD, Clinton J, Szentirmai E, Zielinski MR. ATP and the purine type 2X7 receptor affect sleep. J Appl Physiol 109: 1318–1327, 2010 [DOI] [PMC free article] [PubMed] [Google Scholar]
- 19. Krueger JM, Tononi G. Local use-dependent sleep: synthesis of the new paradigm. Curr Top Med Chem 11: 2490–2492, 2011 [DOI] [PMC free article] [PubMed] [Google Scholar]
- 20. Kubota T, Kushikata T, Fang J, Krueger JM. A nuclear factor-κB (NFκB) inhibitor peptide inhibits spontaneous and interleukin-1β-induced sleep. Am J Physiol Regul Integr Comp Physiol 279: R404–R413, 2000 [DOI] [PubMed] [Google Scholar]
- 21. Lancel M, Cronlein J, Muller-Preuss P, Holsboer F. Lipopolysaccharide increases EEG delta activity within non-REM sleep and disrupts sleep continuity in rats. Am J Physiol Regul Integr Comp Physiol 268: R1310–R1318, 1995 [DOI] [PubMed] [Google Scholar]
- 22. Liao F, Taishi P, Churchill L, Urza JM, Krueger JM. Localized suppression of cortical growth hormone releasing hormone receptors state-specifically attenuates EEG delta waves. J Neurosci 30: 4151–4159, 2010 [DOI] [PMC free article] [PubMed] [Google Scholar]
- 23. Majde JA, Krueger JM. Links between the innate immune system and sleep. J Allergy Clin Immunol 116: 1188–1198, 2005 [DOI] [PubMed] [Google Scholar]
- 24. Morello S, Ito K, Yamamura S, Lee KY, Jazrawi E, Desouza P, Barnes P, Cicala C, Adcock IM. IL-1β and TNF-α regulation of the adenosine receptor A2A expression: differential requirement of NF-κB binding to the proximal promoter. J Immunol 177: 7173–7183, 2006 [DOI] [PubMed] [Google Scholar]
- 25. Morrow JD, Opp MR. Diurnal variation of lipopolysaccharide-induced alterations in sleep and body temperature of interleukin-6-deficient mice. Brain Behav Immun 19: 40–51, 2005 [DOI] [PubMed] [Google Scholar]
- 26. Mullington J, Korth C, Hermann DM, Orth A, Galanos C, Holsboer F, Pollmacher T. Dose-dependent effects of endotoxin on human sleep. Am J Physiol Regul Integr Comp Physiol 278: R947–R955, 2000 [DOI] [PubMed] [Google Scholar]
- 27. Obál F, Jr, Alt J, Taishi P, Gardi J, Krueger JM. Sleep in mice with non-functional growth hormone (GH)-releasing hormone (GHRH) receptors. Am J Physiol Regul Integr Comp Physiol 284: R131–R139, 2003 [DOI] [PubMed] [Google Scholar]
- 28. Obál F, Jr, Fang J, Payne LC, Krueger JM. Growth hormone-releasing hormone (GHRH) mediates the sleep promoting activity of interleukin-1 (IL1) in rats. Neuroendocrinology 61: 559–565, 1995 [DOI] [PubMed] [Google Scholar]
- 29. Opp MR, Krueger JM. Anti-interleukin-1β reduces sleep and sleep rebound after sleep deprivation in rats. Am J Physiol Regul Integr Comp Physiol 266: R688–R695, 1994 [DOI] [PubMed] [Google Scholar]
- 30. Opp MR, Obál F, Jr, Krueger JM. Interleukin-1 alters rat sleep: temporal and dose-related effects. Am J Physiol Regul Integr Comp Physiol 260: R52–R58, 1991 [DOI] [PubMed] [Google Scholar]
- 31. Pappenheimer JR, Koski G, Fencl V, Karnovsky ML, Krueger JM. Extraction of sleep-promoting factor S from cerebrospinal fluid and from brains of sleep-deprived animals. J Neurophysiol 38: 1299–1311, 1975 [DOI] [PubMed] [Google Scholar]
- 32. Papoutsopoulou S, Symons A, Tharmalingham T, Belich MP, Kaiser F, Kioussis D, O'Garra A, Tybulewicz V, Ley SC. ABIN-2 is required for optimal activation of Erk MAP kinase in innate immune responses. Nat Immunol 7: 606–615, 2006 [DOI] [PubMed] [Google Scholar]
- 33. Pollmacher T, Mullington J, Korth C, Hinze-Selch D. Influence of host defense activation on sleep in humans. Adv Neuroimmunol 5: 155–169, 1995 [DOI] [PubMed] [Google Scholar]
- 34. Smith DE, Lipsky BP, Russell C, Ketchem RR, Kirchner J, Hensley K, Huang Y, Friedman WJ, Boissonneault V, Plante MM, Rivest S, Sims JE. A central nervous system-restricted isoform of the interleukin-1 receptor accessory protein modulates neuronal responses to interleukin-1. Immunity 30: 817–831, 2009 [DOI] [PMC free article] [PubMed] [Google Scholar]
- 35. Su J, Richter K, Zhang C, Gu Q, Li L. Differential regulation of interleukin-1 receptor associated kinase 1 (IRAK1) splice variants. Mol Immunol 44: 900–905, 2007 [DOI] [PubMed] [Google Scholar]
- 36. Taishi P, Bredow S, Guha-Thakurta N, Obál F, Jr, Krueger JM. Diurnal variations of interleukin-1β mRNA and β-actin mRNA in rat brain. J Neuroimmunol 75: 69–74, 1997 [DOI] [PubMed] [Google Scholar]
- 37. Taishi P, Chen Z, Obál F, Jr, Zhang J, Hansen M, Fang J, Krueger JM. Sleep-associated changes in interleukin-1β mRNA in the brain. J Interferon Cytokine Res 18: 793–798, 1998 [DOI] [PubMed] [Google Scholar]
- 38. Taishi P, Churchill L, Wang M, Kay D, Davis CJ, Guan X, De A, Yasuda T, Liao F, Krueger JM. TNFα siRNA reduces brain TNF and EEG delta wave activity in rats. Brain Res 1156: 125–132, 2007 [DOI] [PMC free article] [PubMed] [Google Scholar]
- 39. Taishi P, De A, Alt J, Gardi J, Obál F, Jr, Krueger JM. Interleukin-1β stimulates GHRH receptor mRNA expression in the rat hypothalamus in vitro and in vivo. J Neuroendocrinol 16: 113–118, 2004 [DOI] [PubMed] [Google Scholar]
- 40. Taishi P, Sanchez C, Wang Y, Fang J, Harding JW, Krueger JM. Conditions that affect sleep alter the expression of molecules associated with synaptic plasticity. Am J Physiol Regul Integr Comp Physiol 281: R839–R845, 2001 [DOI] [PubMed] [Google Scholar]
- 41. Takahashi S, Kapás L, Fang J, Seyer JM, Wang Y, Krueger JM. An interleukin-1 receptor fragment inhibits spontaneous sleep and muramyl dipeptide-induced sleep in rabbits. Am J Physiol Regul Integr Comp Physiol 271: R101–R108, 1996 [DOI] [PubMed] [Google Scholar]
- 42. Vyazovskiy VV, Olcese U, Lazimy YM, Faraquna U, Esser SK, Williams JC, Cirelli C, Tononi G. Cortical firing and sleep homeostasis. Neuron 63: 865–878, 2009 [DOI] [PMC free article] [PubMed] [Google Scholar]
- 43. Yasuda K, Churchill L, Yasuda T, Blindheim K, Falter M, Krueger JM. Unilateral cortical application of interleukin-1β (IL1β) induces asymmetry in Fos- and IL1β-immunoreactivity: implications for sleep regulation. Brain Res 1131: 44–59, 2007 [DOI] [PubMed] [Google Scholar]
- 44. Zhang R, Sun L, Hayashi Y, Liu X, Koyama S, Wu Z, Nakanishi H. Acute p38-mediated inhibition of NMDA-induced outward currents in hippocampal CA1 neurons by interleukin-1β. Neurobiol Dis 38: 68–77, 2010 [DOI] [PubMed] [Google Scholar]


