Abstract
This report details a comprehensive study of inertial focusing dynamics and particle behavior in low aspect ratio (h/w ∼ 1/1 to 1/8) spiral microchannels. A continuum of particle streak behavior is shown with longitudinal, cross-sectional, and velocity resolution, yielding a large analyzed parameter space. The dataset is then summarized and compared to prior results from both straight microchannels and other low aspect ratio spiral microchannel designs. Breakdown of focusing into a primary and secondary fluorescent streak is observed in the lowest aspect ratio channels at high average downstream velocities. Streak movement away from the theoretically predicted near inner wall equilibrium position towards the center of the channel at high average downstream velocities is also detailed as a precursor to breakdown. State diagrams detail the overall performance of each device including values of the required channel lengths and the range of velocities over which quality focusing can be achieved.
INTRODUCTION
Inertial focusing is a counterintuitive phenomenon where suspended particles can migrate across streamlines and order deterministically at equilibrium positions within a confined flow. This behavior occurs as a result of inertial forces usually neglected in microfluidics as part of the low Reynolds number or Stokes flow approximation and can be tuned by altering the flow conditions and channel geometry. Briefly, this phenomenon in straight channels is caused by the balance of two forces: a shear gradient lift force directed towards the walls of a channel (due to the curvature of the velocity profile) and a lift force directed away from the wall (due to the interaction between a particle and an adjacent wall).1, 2 The phenomenon was originally discovered in larger circular cross section pipes (∼11 mm diameter) with larger particles (∼1 mm diameter).3 With the advent of microfluidics, the observation of the same phenomenon in microchannels has sparked the study of the alignment and ordering of particle suspensions in finite Reynolds number flows.4, 5, 6 A review of the field of finite Reynolds number flows and its applications is available from Di Carlo.7 Applications of these phenomena have grown in number as well and include devices designed for separation of bacteria8 and platelets9 from blood, cell cycle synchronization,10 single cell encapsulation for secretion analysis,11 water filtration,12 and cytometric signal enhancement.13
Inertial focusing represents one passive technique used to manipulate and separate cells on the microscale without an externally applied force or field, in addition to hydrophoresis,14 deterministic lateral displacement,15 and gravitational methods.16 There are also a plethora of active techniques including dielectrophoresis,17, 18, 19 magnetophoresis,20 and acoustophoresis.21 Several reviews comparing these different techniques are also available in the literature.22, 23, 24, 25 Inertial focusing combines the benefits of a passive technique with extremely high throughput (milliters per minute), which distinguishes it from other hydrodynamic mechanisms for cell manipulation.
Although inertial focusing in straight channels has been very well characterized,6, 26, 27 curved channels have received less scientific attention, despite their promise for enhancing particle focusing. The addition of curvature enables the development of a secondary flow, which enhances the lateral motion of particles across the channel by imposing a drag force on the particles and alters the equilibrium positions by redistributing the velocity profile. The magnitude of this secondary flow is characterized by the non-dimensional Dean number (De = ReC(Dh/2R)0.5) where R is the average radius of curvature of the channel, ReC is the channel Reynolds number (ReC = 3ρUAvgDh/2μ) in which ρ is the fluid density, UAvg is the average downstream fluid velocity, μ is the dynamic viscosity of the fluid, and Dh is the hydraulic diameter (Dh = 2hw/(h+w)), where h and w are the height and width of the channel, respectively. Most of the previous work in the area of inertial focusing in curved channels is based on spiral geometries (one direction of curvature) as a means of separating differently sized species based on the large difference in Dean drag on the particles.10, 28, 29, 30 However, these reports only investigate a single channel geometry. Other types of curved channels described in the literature incorporate an alternating curvature which complicates the flow patterns and velocity redistribution to a level yet to be understood in terms of its effects on inertial focusing behavior.31, 32
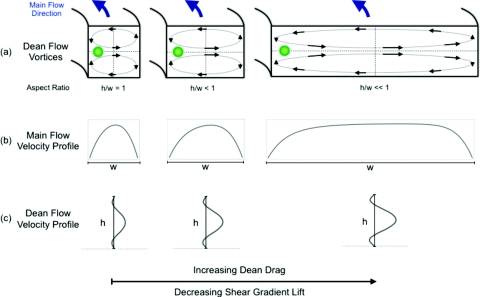
This paper presents an investigation of inertial focusing in spiral microchannels of varying widths providing missing pieces to the overall inertial focusing parameter space. Figure 1 contains (a) cartoon representations of the flow conditions within curved microchannels of different widths, (b) the velocity profile for the main channel flow, and (c) the secondary Dean flow velocity profile. These flow profiles are representative of the competing mechanisms that affect inertial focusing behavior in curved channels and how each mechanism depends on the channel width. First, the inertial lift decreases as Dh increases, since the velocity profile becomes flattened and the shear gradient decreases as seen in Figure 1b. Next, the wall effect component of the lift force has a more complicated dependence on Dh, but it is a shorter ranged effect that is not the primary cause of transverse particle motion across any of the channel widths.1 Finally, the Dean drag on a particle increases with Dh1.5 and becomes stronger as the width increases which is apparent in Figure 1c. At some critical channel width, the motion of particles across the channel will be dominated by Dean drag rather than inertial lift forces. This switch in dominant means of particle transport across the channel should become apparent in the focusing dynamics along the channel.
Figure 1.
Schematics of the different flow profiles and associated forces in curved channels of differing widths at inertial focusing velocities. Theoretical particle equilibrium positions are presented along with the directions and magnitudes of the secondary flow velocity (vectors and streamlines). The main flow velocity profile at the center of the channel height or the horizontal cross section going into the page is given as well as the Dean flow velocity (components tangent to the main channel flow) at the midline of the channel width or the vertical cross section. Note the slightly off center main flow velocity profiles are due to the Dean flow transferring the momentum of the faster moving fluid in the center of the channel towards the outer wall.
By direct visualization and measurement of inertial focusing behavior in such devices, it is possible to elucidate the underlying fluid physics. Expanding our understanding of inertial focusing in curved channels will assist in the development of basic design rules for future high-throughput biomedical devices. Moreover, the functional limitations of these devices and the driving mechanisms for inertial focusing in spiral microchannels can be understood by examining the dynamics at the device outlet as well as along each channel.
METHODS
Microchannel design
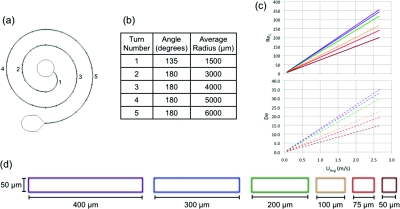
The devices were designed by setting a radius for each consecutive turn for all of the different channel widths. These radii were chosen based on geometric requirements for the inlet and outlet as well as having at least 1.5 times the channel width in bonded area between adjacent curves. Full 180° sections of curvature were added to a shorter first turn needed to create enough bonded area around the inlet until the device was approximately 6 cm long. The device design as well as the turn radii and their corresponding Reynolds and average Dean number values for each cross section can be found in Figure 2. Since both Reynolds number and Dean number are implicated in inertial focusing in curved channels, results will be presented versus UAvg, or the average downstream velocity for ease of viewing. Plots versus Dean number, channel Reynolds number and particle Reynolds number are available in the supplemental material.34
Figure 2.
This is (a) a schematic of the device design and its (b) dimensions. The (c) channel Reynolds number and average Dean number are given as a function of average downstream velocity. Each line represents a different channel width increasing from bottom to top (50 μm bottom line to 400 μm top line). (d) Cross-sectional views of the channels utilized are also shown.
Microchannel fabrication
Standard SU8 photolithography and soft lithography were used to fabricate the master mold and the polydimethylsiloxane (PDMS) microchannels, respectively. Briefly, negative photoresist SU8-50 (Microchem Corp., Massachusetts) was spun at 2650 rpm to a thickness of ∼50 μm, exposed to UV light through a mylar emulsion printed photomask (Fineline Imaging, Colorado) and developed in BTS-220 SU8-Developer (J.T. Baker, New Jersey). A 10:1 ratio mixture of Sylgard 184 elastomer base and curing agent (Dow Corning, Michigan) was then poured over the raised mold, allowed to cure in an oven at 65°C for 8 h and then removed from the silicon/SU8 master. Inlet and outlet holes were punched using custom sharpened needle tips. The devices were then cleaned of particulate using low-residue tape and oxygen plasma bonded to pre-cleaned 1 mm thick glass microscope slides. Due to the high driving pressures required for the smaller channels (50 and 75 μm widths), 0.06 in. outer diameter Tygon tubing (Greene Rubber, Massachusetts) otherwise press fit into the inlet and outlet were chemically bonded to the PDMS using a Loctite® Medical Grade epoxy.
Particle suspensions
A 250,000 beads/ml concentrated solution was created using Thermo Scientific 10 μm diameter green fluorescent aqueous microspheres (ρP = 1.050 g/ml) added to a solution of equivalent density comprising 5.4 parts deionized water (ρW = 1.000 g/ml) and 1 part Optiprep® density gradient solution (ρI = 1.32 g/ml) (Sigma-Aldrich). Tween 20 was added to prevent particle aggregation at a volume percentage of 0.1%. This suspension was mixed and filtered using Beckton Dickinson 40 μm Cell Strainers® to remove PDMS debris and any dust particulate. These solutions were then loaded into syringes and injected into the devices using a Harvard Apparatus PHD Ultra syringe pump. The devices were primed with a 1% v/v Tween 20 solution in deionized water prior to each experiment.
Fluorescent imaging
Using an automated Nikon TiE inverted microscope with a Retiga 2000R monochromatic camera, multi-position long exposure streak images were taken at 38 different positions along each spiral microchannel using Nikon NIS-Elements AR 3.10 software. Exposure times were varied to account for the magnification being used and the number of events per second at a given flow rate for each device ranging from 250 ms to 1 s. Three consecutive images were taken at each position at each flow rate then averaged together. Approximately 30 s were allowed between each flow rate for pressure stabilization. Each averaged fluorescent streak image gathers positional data from over 1000 individual particles.
Data analysis
Five distinct cross-sectional intensity profiles were measured per imaging position (38 positions along channel) in a custom MATLAB program, which were then averaged. The cross-sectional intensity profiles were analyzed for the streak width and position within the channel using dual thresholds (50% and 5% of maximum intensity). Streak width was determined by measuring the distance between the points where the intensity profile crossed the 5% threshold. Focusing was considered achieved when the streak width became lower than 3.8 times the particle diameter, a, equivalent to two particle diameters at the 50% threshold except that it captures the lower intensity secondary streaks when present. Streak position was taken as the middle of the 50% threshold detected streak, nominally the position of the peak intensity in each cross-sectional intensity profile. These analyses were completed for each position on each device at 19 different flow rates per device.
Straightened image generation
To investigate and compare the dynamics of inertial focusing behavior between different width devices, it was necessary to create a representation of the focusing behavior along the channel. This was accomplished by stacking the intensity profiles from each of the 38 imaging positions and converting the resulting matrix to an image format which was smoothed and scaled in each dimension separately accounting for the increasing spacing between imaging positions along the channel and for the different channel widths.
Flow simulations
COMSOL Multiphysics finite element software was used to simulate the Newtonian fluid flow conditions within different aspect ratio channels without any particle approximations. Each model was solved using the FGMRES iterative solver. The element size and quality was adapted based upon computer memory restrictions and the actual size of the model for each width. Maximum element size at the outlet was kept constant at 5 μm. An array of vectors for velocity was exported and then the average magnitude of the fluid velocity in the transverse direction to the channel, UDean,Avg, was calculated.
RESULTS AND DISCUSSION
Inertial focusing behavior at device outlets
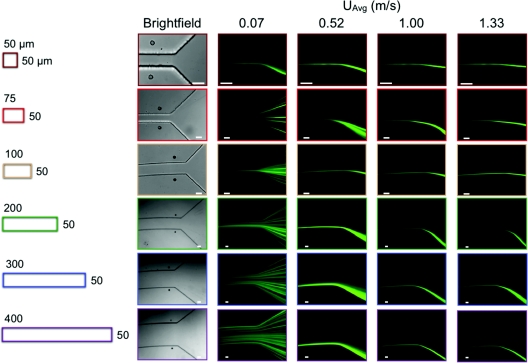
Inertial focusing behavior was first classified by the position and width of the particle distribution at the outlet of a device, where particles have been exposed to the inertial lift and Dean drag forces for the longest amount of time. Figure 3 presents the raw images at the outlet of each of the devices over a select range of flow conditions. A cross-sectional view of each spiral device is given on the left with adjacent brightfield images of the outlet of each device. The same imaging position was used for the next four fluorescent streak images at different average downstream velocities increasing from left to right. In each fluorescent streak image, the flow is from left to right into the diverging section where the outlet tubing opening is located. In general, the devices exhibit similar trends, with a critical threshold velocity for inertial focusing that scales as ∼1/Dh. This inertial focusing behavior tends to remain stable over some range of flow conditions, which is consistent with previous results.7
Figure 3.
Brightfield and fluorescent images of the outlet of each device at select flow conditions are grouped by channel width (horizontal) and flow rate or image type (vertical). Cross-sectional views are given for comparison (left). Image scale bars are 50 μm. Note that these images were acquired at different magnifications to optimize spatial resolution, so the channel sizes appear to be similar in the images.
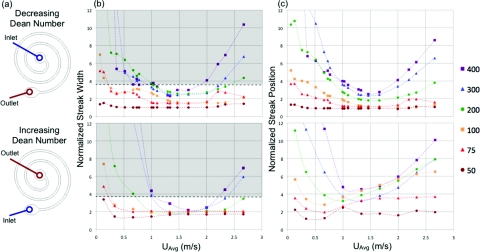
Although these images are helpful for qualitatively visualizing trends at different UAvg and channel widths, they are not sufficient for assessing more subtle quantitative differences in streak width and position. Thus, these values were measured from the images in Figure 3 and other similar ones for all channel widths and velocities. The results of these measurements are presented in Figure 4 where both streak width and position normalized by particle diameter are plotted versus the average downstream velocity. These plots show streak width on the left (Fig. 4b) and streak position within the channel cross section on the right (Fig. 4c) measured from the inside wall of each curve. Each point on the plots describes a single measurement at the outlet of a device at a given downstream velocity. The points are grouped by channel width. In order to investigate the parameter space further with the same devices, each was run backwards from largest radius to smallest radius turn, in other words, increasing in Dean number, whereas the previously discussed cases describe a decreasing Dean number situation. The top row of plots in Figure 4 presents the results from the decreasing Dean number case and the bottom row presents the increasing Dean number case. Since the plots are only describing outlet behavior, the main difference between the two cases at the same average downstream velocity is the instantaneous Dean number at the position of measurement. The history of Dean flow along the device may also have an effect on the outlet behavior, but since the overall behavior was quite similar it was believed that the upstream flow field had a greater effect on focusing dynamics rather than the outlet behavior.
Figure 4.
Device schematics (a) with arrows indicating the difference between the increasing and decreasing Dean number cases (inlet and outlet reversed). Quantitative comparison of normalized streak width (b) and normalized streak position (c) or the distance from the inside wall normalized by the particle diameter for cases of both decreasing (top) and increasing (bottom) Dean number along the device. The gray area indicates that the streak width is greater than 3.8 particle diameters at the 5% threshold.
The quantitative measurement of streak width and position in Figure 4 reveals that the stable range of inertial focusing is narrower for the wider devices as the streak tends to shift away from the inner wall at higher average downstream velocities. The streak movement away from the wall has been previously observed and explained through Dean drag increasing faster than inertial lift at higher Reynolds numbers.1, 29, 31 Unexpectedly, at much higher downstream velocities (∼2 m/s) in the wider devices, the focusing behavior breaks down causing an increase in streak width. There is also a strong correlation between streak position and width, since the minimum streak width occurs at or near the closest approach to the wall. This result can be explained by the dominance of inertial lift forces, which vary most strongly at the equilibrium positions and would cause tighter focusing when this position is close to the wall. Finally, it should be noted that the Dean flow will alter the velocity profile across the channel, but the Dean flow velocities are considerably slower near the equilibrium positions than they are elsewhere in the channel cross section. As a result, inertial lift forces should dominate the behavior.
When comparing the outlet behavior between decreasing and increasing Dean number cases, presented in Figure 4, the streak width and position generally follow the same trends but exhibit several key differences. First, for the increasing Dean number case, the streak position shifts towards the center of the channel and the magnitude of this shift grows with increasing downstream velocity. The shift in streak position is similar to data for a 500 μm wide spiral device in the literature, although the constant and linear streak position versus Dean number relationships separated by a critical Dean number are not as apparent in the current devices.29 This may be due to differences in flow patterns as their devices were taller (90–170 μm). Second, the minimum streak width varies less in the increasing Dean number case (standard deviation = 0.27a, mean = 1.85a) versus the decreasing Dean number case (standard deviation = 0.67a, mean = 1.87a). This change could indicate that the stronger Dean drag forces at the outlet of the devices in the increasing Dean number case create more steeply varying force field around the equilibrium position causing a lower streak width. Finally, when comparing the decreasing to increasing Dean number cases, there is a shift in the velocity at which minimum streak width is achieved for the larger width devices, from 1.48 m/s to 1.73 m/s for the 400 μm wide device and 1.60 m/s to 1.70 m/s for the 300 μm wide device. This may be due to the Dean number at the outlet or upstream effects of initially focusing at lower Dean numbers, which suggests there may be an optimal Dean flow for focusing performance in a given cross section.
Ratio of forces threshold for achieving quality focusing
Other investigators have provided a non-dimensional factor as a possible means of characterizing inertial focusing flows in curved channels defined as the ratio of shear gradient lift to Dean drag forces, Rf. Different approximations have been used for this factor due to the complex relationship among position in the channel, velocity and the inertial lift, and Dean drag forces.26 Of the two main formulations, the first ignores velocity variation altogether in order to make the value more accessible as a design parameter,31 and the other uses an approximation of the secondary Dean flow velocity only valid for a single device cross section (170 μm tall and 200 μm wide).29 Both approximations accurately predict that each width spiral used in the current experiment is capable of focusing 10 μm particles, but only the second attempts to predict the velocity at which focusing will initially occur. However, the Rf value at which focusing is initially predicted varies with width based upon the second approximation. In an attempt to decrease the variability of this threshold value, COMSOL simulations were completed to get the average Dean flow velocities, UDean,Avg, for each device width. A power fit of UDean,Avg versus Dean number similar to previous scalings was generated with an exponent of approximately 1.4 for all the devices simulated.33 This plot is available in the supplemental material34 as well as the calculated power fits. These more accurate values for UDean,Avg are incorporated into the second approximation of Rf defined in Eq. 1, where the shear rate G = UMax/Dh, where UMax is approximated as , and CL is a lift coefficient which is a function of cross-sectional position and Reynolds number,1
| (1) |
The more accurate Dean velocities reduced the variability of the threshold between the different width devices drastically as shown in Table 1, which compares the second approximation with the new adjusted one.
Table 1.
The Rf threshold values for initially achieving focusing (lowest velocity at which the streak width is less than 3.8 particle diameters) in the decreasing Dean number case for the different width devices assuming CL = 0.5.
| Width | ||
|---|---|---|
| (μm) | Second approximation29 | Adjusted second approximation |
| 400 | 1.31 | 0.83 |
| 300 | 1.54 | 1.16 |
| 200 | 2.17 | 1.53 |
| 100 | 3.36 | 1.81 |
| 75 | 5.37 | 2.73 |
| 50 | 7.24 | 1.91 |
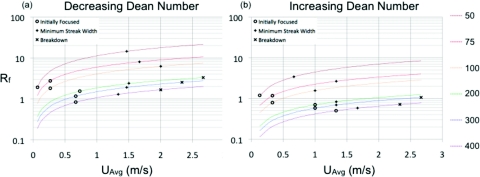
While the new adjusted parameter gives a single threshold (Rf ∼ 1) for achieving focusing, a useful value in device design, it still cannot accurately predict the minimum streak width in the different width devices. Figure 5 presents the calculated Rf values for the different width devices versus UAvg. Along each line are all of the tested Rf values for each device width. Certain Rf values are marked for each device when focusing is initially achieved (circles), the minimum streak width is achieved (plus signs), and where breakdown occurs, in other words, when the streak width goes back above 3.8 particle diameters (×s).
Figure 5.
Rf versus UAvg for the different device widths in both the (a) decreasing and (b) increasing Dean number cases. The symbols along each device line are indicative of when the streak width initially goes below the 3.8 particle diameter threshold (circles), the minimum streak width (plus signs) and the streak breaks down or when the streak width goes above the 3.8 particle diameter threshold (×s). The channel width for each line increases from the top line (50 μm width) to bottom line (400 μm width) as in the legend.
The widely varying Rf values for the minimum streak width may indicate that a different balance between forces is required in each device cross section to achieve optimal focusing. It is also interesting that the minimum streak width does not occur at the highest values of Rf where the inertial lift forces are strongest. While the ratio Rf has been useful in the design of single devices for particle-size-based separation, in its current cross-sectional averaged form, it is not specific enough to account for the range of streak width and position behaviors between devices of different widths even with the simulated Dean flow velocities, for both the increasing and decreasing Dean number cases.
In order to determine the most appropriate parameter for comparing and predicting the performance of curved inertial focusing devices, it will be necessary to examine the constituent parts of Rf more closely. For example, the dominant forces that control inertial focusing behavior are governed by several other non-dimensional parameters such as particle Reynolds number, ReP, and Dean number. The particle Reynolds number incorporates the confinement of a particle within the channel, ReP = ReC(a2/Dh2), where a is the particle diameter. The specialized Reynolds number along with channel aspect ratio are the main factors determining the number and location of equilibrium positions. As these equilibrium positions change, the Dean flow velocities that particles at those positions are exposed to also change. Since Dean number changes linearly with ReC, changing the velocity of a fluid is insufficient for decoupling the effects of De and ReP. To this end, a brief investigation into decoupling the effects of arguably the two most important non-dimensional values for inertial focusing in curved channels can be accomplished comparing the increasing and decreasing Dean flow cases. At each Reynolds number, two different Dean number values at the outlets of the devices could be compared. While the sample size is very small, the predicted streak positional shift towards the center of the channel is present, but overall the streak behavior throughout the devices is very similar. It is possible that decoupling these effects is more important in some regimes than others depending on the equilibrium positions and the relative effects of Dean flow as those positions change. Therefore, addressing the change in curvature as a means of isolating the effects of Dean number on focusing behavior should be one of the next steps towards understanding and predicting inertial focusing behavior in all curved channels.
Inertial focusing dynamics
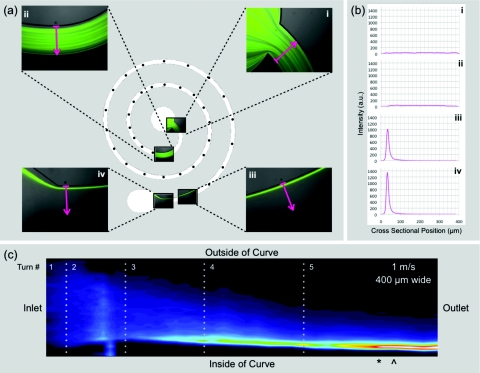
Understanding the dynamics of inertial focusing requires going beyond the equilibrium streak behavior at the outlet to characterize the particle distribution throughout the device. The spiral geometry can be more easily visualized by straightened images clearly showing the streak width and position along the entire channel as well as the channel length required for focusing. Figure 6 shows the steps for generating a straightened image detailed in Sec. 2 with example positional images, intensity profiles, and the resultant straightened image for a 400 μm wide device at an average downstream velocity of 1 m/s.
Figure 6.
(a) A device schematic with imaging positions marked by dots along the channel with the first and last two positions highlighted with the actual images and the cross-sectional lines used to generate (b) the intensity profiles which are then stacked, smoothed, and converted to (c) image form effectively a straightened image of the focusing behavior in the spiral device which is labeled with points of importance separating the different behavior regimes (*: focusing achieved; ^: point of closest wall approach). There is no breakdown in this example image. The dotted lines demarcate where the channel curvature changes or, in other words, the interface between turns.
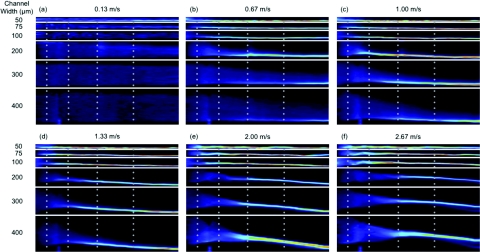
Figure 7 presents comparative straightened images for six different average downstream velocity conditions increasing from left to right for all six different width devices in the decreasing Dean number case. The same plots are given for the increasing Dean number case in the supplemental material.34
Figure 7.
Straightened images for similar flow conditions to those presented in Figure 2 for all channel widths. Dark blue is low intensity and red/white is high intensity seen when a focused streak is formed. All images are for decreasing Dean number devices.
These straightened images clearly illustrate the previously described dynamic behaviors where focusing is achieved at lower velocities and shorter distances in the narrower devices. The streak movement away from the wall can also be seen to increase with increasing velocity in the wider channels. Despite the motion of the streak away from the wall, the position of closest approach to the inner wall remains stable near the outlet of the device. Movies showing the complete set of straightened images for each width at all of the different average downstream velocities tested are available in the supplemental material.34 These movies also show the streak breakdown occurring at higher average downstream velocities for the 300 and 400 μm wide devices, which can also be seen statically in Figure 7f.
Other interesting observations include that the streak breakdown seems to begin when the streak initially focuses to the center of the channel rather than the inner wall. Perhaps even more interesting is comparing these straightened images between the decreasing and increasing Dean number cases, as the behavior is strikingly similar. The increasing Dean number case straightened images are available in the supplemental material.34 Despite lower Dean number values during the initial focusing, the channel length required is very similar. This may indicate that both Dean number values are within a range that is above a critical value causing the single equilibrium position but not yet to the value where Dean mixing is stronger than the inertial forces. From these images it appears that there is a large change qualitatively in the focusing between the 100 μm and 200 μm wide devices possibly indicating the critical width at which Dean forces become more important in terms of achieving a quality focused streak. Unexpectedly, in the increasing Dean number case, the streak still moves towards the inner wall for the 200 μm and wider channels. This is the opposite of the expected result given the increase in Dean number toward the outlet of the device. One possible explanation is that there is substantial deformation of the channel near the inlet of the device causing different cross-sectional shapes and therefore different equilibrium positions. Alternatively, the Dean flow may not be fully developed over this distance in the wider channels causing this difference.
Stability versus particle confinement
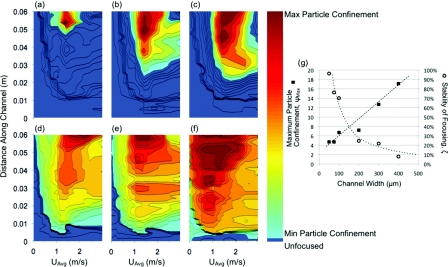
Since streak width and position are strongly correlated, the compiled dataset can be mapped as a state diagram of velocity, distance along the channel, and a measure of streak width relative to the channel width. These are given in Figure 8, for the decreasing Dean number case, for each channel width (a)–(f). The increasing Dean number case state diagrams can be found in the supplemental material.34 The streak width is presented as the channel width divided by the streak width as a measure of the particle confinement within each channel cross section, ψ. Each state diagram shows two regions, one, where the streak width is less than 3.8 particle diameters (unfocused – bottom of colorbar), and two, the area of the parameter space where focusing is achieved (min particle confinement to max particle confinement – light to dark on colorbar above unfocused threshold). The size of this area is used as a measure of the stability of the focusing, ζ. The maximum confinement, ψMax, indicative of the minimum streak width for each device, and stability values, ζ, are presented in a summary plot (Fig. 8g).
Figure 8.
State diagrams for each decreasing Dean number device whose shading indicates the particle confinement (dark gray (red online) maximum – light gray (cyan online) minimum – medium gray areas next to light gray (dark blue online) unfocused) over the length of the device in the vertical direction and the different average downstream velocities in the horizontal direction for the different width channels (a) 400 μm, (b) 300 μm, (c) 200 μm, (d) 100 μm, (e) 75 μm, and (f) 50 μm. A plot (g) of the actual maximum particle confinement for each device and the corresponding amount of the parameter space where focusing was achieved. Guidelines for the maximum particle confinement (dashed) and focusing stability (dotted) are given as well.
The performance of these devices with increasing width is subject to two competing mechanisms. First, the confinement increases with increasing width. This is an extremely important performance metric for lab-on-a-chip applications, such as sample concentration and volume reduction. However, the stability, defined as the operating range of lengths and flow rates where the quality focusing can be achieved, decreases with increasing width. Achieving robust focusing is also important given the complex nature of biological fluids and the sample-to-sample variability based upon health and age of the patient. This issue will be investigated further in future studies, using multiple sizes of particles for a single device to determine the ideal operating regime for polydisperse samples.
Although the maximum particle confinement is linear over the range of device widths tested, the slight increase in the measured streak width and steady decrease in stability suggests that there may be a maximum width for a given length device at which focusing can no longer be achieved. The stark transition in behavior between the 100 μm and 200 μm wide devices can also be seen in these state diagrams again indicating the transition to Dean flow dominated focusing behavior.
The breakdown of focusing is also visible in these plots at higher velocities (decrease in particle confinement moving left to right after the point of maximum particle confinement, especially at the end of the device or the top of each diagram) as well as the channel length required for each width and flow rate in order to achieve focusing (minimum distance up the vertical axis to a particle confinement equivalent to the channel width divided by 3.8 particle diameters marked by the end of the unfocused region in Figure 8). This distance decreases with increasing downstream velocity similar to the expression for straight channels presented by Di Carlo7 but must be adjusted in order to incorporate effects of Dean flow, as the secondary flow assists the focusing in the larger channels where the inertial lift driven migration would be much slower without the additional Dean drag force component. A comparison of the previously reported scaling for straight channels compared to the data from the current experiments is available in the supplemental material.34
Inertial focusing breakdown at high UAvg
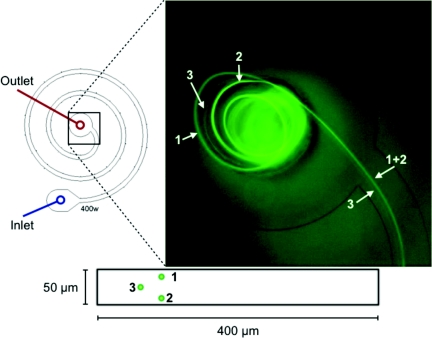
A common thread throughout the results is the breakdown of the focusing at higher average downstream velocities. A closer inspection of this occurrence shows that the breakdown appears as the formation of two separate streaks after moving away from the wall. One of these two streaks remains at a seemingly constant position, while the other (actually two streaks mirrored across the center of the channel height) moves toward the center of the channel. Figure 9 presents an image of this breakdown within the 400 μm wide channel in the increasing Dean number condition with the different streaks labeled and matched with their approximate cross-sectional positions in a diagram of the cross section. A movie showing that the behavior is highly reproducible is given in the supplemental material.34
Figure 9.
Device schematic for streak breakdown image. This specific video frame is from a increasing Dean number experiment (flow from outside to inside of spiral as labeled from inlet to outlet). UAvg = 2.667 m/s. A video of the repeatability of this behavior can be found in the supplemental material.34
It should be noted that the multiple streaks are treated as a single wide streak in our analysis. In actuality, although the single streak formation breaks down, each individual streak retains a low but discrete streak width. It is also clear, based upon relative streak intensities, that more particles remain in the two vertically mirrored streaks rather than the one closer to the wall indicating that this position is less stable or simply encompasses a smaller area of the cross section with respect to initial positions of the particles. A more detailed investigation of this breakdown and its corresponding spatial structure is necessary to determine the specific mechanism causing the behavior.
CONCLUSION
Inertial focusing dynamics and streak behavior in different width spiral microchannels are presented over a large parameter space. The rich inertial focusing dynamics observed in curved channels will be advantageous for future generations of medical and scientific devices but also merit further study to elucidate the underlying physical mechanisms and their associated limitations. This initial report lays a foundation for a deeper quantitative analysis of inertial focusing in curved channels as well as establishing the framework for the parameter search. Ultimately, unraveling the complexities of these behaviors in curved channels will require the decoupling of Reynolds and Dean numbers in these microfluidic geometries as well as the equilibrium position behavior in the different aspect ratio channels.
ACKNOWLEDGMENTS
Joseph M. Martel is a National Science Foundation Graduate Research Fellow. This work was supported in part by the National Institute of Biomedical Imaging and Bioengineering (BioMEMS Resource Center, P41 EB002503). The authors thank Octavio Hurtado for microfabrication training, Bryan Hassel for his help generating straightened images, as well as Anh Hoang, Ian Wong, Daniel Irimia, and Dino Di Carlo for their assistance in editing the paper.
References
- Asmolov E., “The inertial lift on a spherical particle in a plane Poiseuille flow at large channel Reynolds number,” J. Fluid Mech. 381, 63 (1999). 10.1017/S0022112098003474 [DOI] [Google Scholar]
- Schonberg J. and Hinch E., “Inertial migration of a sphere in Poiseuille flow,” J. Fluid Mech. 203, 517 (1989). 10.1017/S0022112089001564 [DOI] [Google Scholar]
- Segre G. and Silberberg A., “Behaviour of macroscopic rigid spheres in Poiseuille flow Part 1. Determination of local concentration by statistical analysis of particle passages through crossed light beams,” J. Fluid Mech. 14(1), 115 (1962). 10.1017/S002211206200110X [DOI] [Google Scholar]
- Matas J., Glezer V., Guazzelli É., and Morris J., “Trains of particles in finite-Reynolds-number pipe flow,” Phys. Fluids 16, 4192 (2004). 10.1063/1.1791460 [DOI] [Google Scholar]
- Humphry K. J., Kulkarni P. M., Weitz D. A., Morris J. F., and Stone H. A., “Axial and lateral particle ordering in finite Reynolds number channel flows,” Phys. Fluids 22(8), 081703 (2010). 10.1063/1.3478311 [DOI] [Google Scholar]
- Di Carlo D., Irimia D., Tompkins R., and Toner M., “Continuous inertial focusing, ordering, and separation of particles in microchannels,” Proc. Natl. Acad. Sci. U.S.A. 104(48), 18892 (2007). 10.1073/pnas.0704958104 [DOI] [PMC free article] [PubMed] [Google Scholar]
- Di Carlo D., “Inertial microfluidics,” Lab Chip 9(21), 3038 (2009). 10.1039/b912547g [DOI] [PubMed] [Google Scholar]
- Mach A. J. and Di Carlo D., “Continuous scalable blood filtration device using inertial microfluidics,” Biotechnol. Bioeng. 107(2), 302 (2010). 10.1002/bit.22833 [DOI] [PubMed] [Google Scholar]
- Di Carlo D., Edd J., Irimia D., Tompkins R., and Toner M., “Equilibrium separation and filtration of particles using differential inertial focusing,” Anal. Chem. 80(6), 2204 (2008). 10.1021/ac702283m [DOI] [PubMed] [Google Scholar]
- Lee W. C., Bhagat A. A. S., Huang S., Van Vliet K. J., Han J., and Lim C. T., “High-throughput cell cycle synchronization using inertial forces in spiral microchannels,” Lab Chip 11, 1359 (2011). 10.1039/C0LC00579G [DOI] [PubMed] [Google Scholar]
- Edd J., Di Carlo D., Humphry K., Köster S., Irimia D., Weitz D., and Toner M., “Controlled encapsulation of single cells into monodisperse picoliter drops,” Lab Chip 8(8), 1262 (2008). 10.1039/b805456h [DOI] [PMC free article] [PubMed] [Google Scholar]
- Seo J., Lean M., and Kole A., “Membrane-free microfiltration by asymmetric inertial migration,” Appl. Phys. Lett. 91, 033901 (2007). 10.1063/1.2756272 [DOI] [Google Scholar]
- Oakey J., R. W.Applegate, Jr., Arellano E., Carlo D. Di, Graves S. W., and Toner M., “Particle focusing in staged inertial microfluidic devices for flow cytometry,” Anal. Chem. 82(9), 3862 (2010). 10.1021/ac100387b [DOI] [PMC free article] [PubMed] [Google Scholar]
- Choi S. and Park J., “Continuous hydrophoretic separation and sizing of microparticles using slanted obstacles in a microchannel,” Lab Chip 7(7), 890 (2007). 10.1039/b701227f [DOI] [PubMed] [Google Scholar]
- Loutherback K., Chou K. S., Newman J., Puchalla J., Austin R. H., and Sturm J. C., “Improved performance of deterministic lateral displacement arrays with triangular posts,” Microfluid. Nanofluid. 9, 1143 (2010). 10.1007/s10404-010-0635-y [DOI] [Google Scholar]
- Huh D., Bahng J., Ling Y., Wei H., Kripfgans O., Fowlkes J., Grotberg J., and Takayama S., “A gravity-driven microfluidic particle sorting device with hydrodynamic separation amplification,” Anal. Chem. 79(4), 1369 (2007). 10.1021/ac061542n [DOI] [PMC free article] [PubMed] [Google Scholar]
- Kralj J., Lis M., Schmidt M., and Jensen K., “Continuous dielectrophoretic size-based particle sorting,” Anal. Chem. 78(14), 5019 (2006). 10.1021/ac0601314 [DOI] [PubMed] [Google Scholar]
- Zhu J., Tzeng T.-R. J., and Xuan X., “Continuous dielectrophoretic separation of particles in a spiral microchannel,” Electrophoresis 31(8), 1382 (2010). 10.1002/elps.200900736 [DOI] [PubMed] [Google Scholar]
- Voldman J., “Electrical forces for microscale cell manipulation,” Annu. Rev. Biomed. Eng. 8(1), 425 (2006). 10.1146/annurev.bioeng.8.061505.095739 [DOI] [PubMed] [Google Scholar]
- Miltenyi S., Müller W., Weichel W., and Radbruch A., “High gradient magnetic cell separation with MACS,” Cytometry 11(2), 231 (1990). 10.1002/cyto.990110203 [DOI] [PubMed] [Google Scholar]
- Petersson F., Åberg L., Swärd-Nilsson A. M., and Laurell T., “Free flow acoustophoresis: microfluidic-based mode of particle and cell separation,” Anal. Chem. 79(14), 5117 (2007). 10.1021/ac070444e [DOI] [PubMed] [Google Scholar]
- Lenshof A. and Laurell T., “Continuous separation of cells and particles in microfluidic systems,” Chem. Soc. Rev. 39(3), 1203 (2010). 10.1039/b915999c [DOI] [PubMed] [Google Scholar]
- Gossett D. R., Weaver W. M., Mach A. J., Hur S. C., Tse H. T. K., Lee W., Amini H., and Di Carlo D., “Label-free cell separation and sorting in microfluidic systems,” Anal. Bioanal. Chem. 397(8), 3249 (2010). 10.1007/s00216-010-3721-9 [DOI] [PMC free article] [PubMed] [Google Scholar]
- Kang J. and Park J., “Cell separation technology,” Asia Pacific Biotech News. 9(21), 1135 (2005). [Google Scholar]
- Tsutsui H. and Ho C.-M., “Cell separation by non-inertial force fields in microfluidic systems,” Mech. Res. Commun. 36(1), 92 (2009). 10.1016/j.mechrescom.2008.08.006 [DOI] [PMC free article] [PubMed] [Google Scholar]
- Di Carlo D., Edd J., Humphry K., Stone H., and Toner M., “Particle segregation and dynamics in confined flows,” Phys. Rev. Lett. 102(9), 094503 (2009). 10.1103/PhysRevLett.102.094503 [DOI] [PMC free article] [PubMed] [Google Scholar]
- Bhagat A., Kuntaegowdanahalli S., and Papautsky I., “Enhanced particle filtration in straight microchannels using shear-modulated inertial migration,” Phys. Fluids 20, 101702 (2008). 10.1063/1.2998844 [DOI] [Google Scholar]
- Russom A., Gupta A., Nagrath S., Carlo D., Edd J., and Toner M., “Differential inertial focusing of particles in curved low-aspect-ratio microchannels,” New J. Phys. 11, 075025 (2009). 10.1088/1367-2630/11/7/075025 [DOI] [PMC free article] [PubMed] [Google Scholar]
- Kuntaegowdanahalli S. S., Bhagat A. A. S., Kumar G., and Papautsky I., “Inertial microfluidics for continuous particle separation in spiral microchannels,” Lab Chip 9(20), 2973 (2009). 10.1039/b908271a [DOI] [PubMed] [Google Scholar]
- Bhagat A., Kuntaegowdanahalli S., and Papautsky I., “Continuous particle separation in spiral microchannels using dean flows and differential migration,” Lab Chip 8(11), 1906 (2008). 10.1039/b807107a [DOI] [PubMed] [Google Scholar]
- Gossett D. R. and Carlo D. D., “Particle focusing mechanisms in curving confined flows,” Anal. Chem. 81(20), 8459 (2009). 10.1021/ac901306y [DOI] [PubMed] [Google Scholar]
- Vriend H., “Velocity redistribution in curved rectangular channels,” J. Fluid Mech. 107, 423 (2006). 10.1017/S0022112081001833 [DOI] [Google Scholar]
- Ookawara S., Higashi R., Street D., and Ogawa K., “Feasibility study on concentration of slurry and classification of contained particles by microchannel,” Chem. Eng. J. 101(1–3), 171 (2004). 10.1016/j.cej.2003.11.008 [DOI] [Google Scholar]
- See supplemental material at http://dx.doi.org/10.1063/1.3681228 for additional plots from the increasing Dean number data set, a plot of the channel length required to achieve focusing as well as graphs from the paper plotted versus the non-dimensional values Reynolds number and Dean number.


