

Abstract
2,3,7,8-tetrachlorodibenzo-p-dioxin (TCDD) is an environmental toxicant known to inhibit antibody secretion and Ig expression. Inhibition of Ig expression may be partially mediated through repression of the 3’Igh regulatory region (3’IghRR). TCDD inhibits mouse 3’IghRR activation and induces aryl hydrocarbon receptor (AhR) binding to dioxin response elements (DREs) within the 3’IghRR enhancers: hs1,2 and hs4. The human hs1,2 enhancer (hu-hs1,2) is polymorphic due to the presence of one to four invariant sequences (IS), which have been correlated with several autoimmune diseases. The IS also contains a DRE-core motif. Therefore, the objective was to determine if hu-hs1,2 activity is sensitive to TCDD. Utilizing a mouse B-cell line (CH12.LX), we compared the effects of TCDD on mouse (mo-hs1,2) versus hu-hs1,2 activity. TCDD inhibited mo-hs1,2 similar to the mouse 3’IghRR. In contrast, hu-hs1,2 was activated by TCDD and antagonist studies supported an AhR-dependent activation, which was replicated in a human B-cell line (IM-9). Absence of Pax5 binding sites is a major difference between the human and mouse hs1,2 sequence. Insertion of the high affinity Pax5 site in hu-hs1,2 markedly blunted reporter activity but did not alter TCDD’s effect (i.e. no shift from activation to inhibition). Additionally, deletional analysis demonstrated a significant IS contribution to hu-hs1,2 basal activity but TCDD-induced activity was not strictly IS number-dependent. Taken together our results suggest that hu-hs1,2 is a significant target of TCDD and support species differences in hs1,2 regulation. Therefore, sensitivity of hu-hs1,2 to chemical-induced modulation may influence the occurrence and/or severity of human diseases associated with hu-hs1,2.
INTRODUCTION
Regulation of the mouse Igh locus is governed through a complex interaction of several regulatory elements. One such element, the 3’Igh regulatory region (3’IghRR), appears to mediate processes late in B-cell differentiation such as up-regulation of Igh expression and class switch recombination (1–3). The 3’IghRR is a large, approximately 40 kb region that lies downstream of the Igh constant regions and is most often associated with four enhancer domains (hs3A; hs1,2; hs3B; and hs4) (Fig. 1A). The 3’IghRR has been previously identified as a sensitive target of various chemicals including ligands for the aryl hydrocarbon receptor (AhR) such as the prototypical ligand, 2,3,7,8-tetrachlorodibenzo-p-dioxin (TCDD) (4–7). TCDD is a potent and persistent environmental toxicant, which produces a variety of biological effects in animal and cellular models (reviewed in 8). Immune suppression such as inhibition of B-lymphocyte differentiation into antibody secreting cells is one of the most sensitive consequences of TCDD exposure (reviewed in 9).
FIGURE 1. Schematic of the human and mouse Igh locus.

A, Schematic of the rearranged human and mouse Igh gene locus including the variable (VDJ) and constant regions and the transcriptional regulators: variable heavy chain promoter (VH), intronic enhancer (Eµ), germline promoters upstream of each constant region (open rectangles), and the enhancers of the 3’Igh regulatory region(s). B, Alignment of human and mouse hs1,2 enhancers (EMBL AF013723 and X96607; 34, 69) with predicted transcription factor binding sites. C, Sequence analysis of the human hs1,2 reporters for the human hs1,2 alleles (α1A, α1B, and α1C). Similar to previous sequence analysis (EMBL AJ298015, AJ298016, AJ298017 for α1A, α1B, and α1C, respectively; 29), transcription factor binding sites (Sp1, DRE, AP-1, NF1, NF-κB) have been identified (represented by increased font size with italicizing and/or bolding). The polymorphic region containing varying repeats of the invariant sequence is underlined. Human samples (buccal cells) were also analyzed for the polymorphic hs1,2 enhancer. Following allelic assignment, human samples were sequenced (several individual samples for α1A and α1B; one for α1C due to low frequency) and compared to the reporter plasmids. Asterisks (*) denote differences between the human samples and reporter. The Sp1 and DRE binding sites in parentheses for the α1C plasmid were not conserved; however these binding sites were conserved in the α1C human sample.
The biological effects of TCDD appear to be mediated by the AhR signaling pathway in which the AhR and its dimerization partner, AhR nuclear translocator (ARNT), regulate transcription by binding dioxin response elements (DREs, i.e. DNA consensus sequences containing a 5’-GCGTG-3’ core binding motif) in transcriptional regulatory regions of dioxin-sensitive genes (reviewed in 10, 11). Though DREs and TCDD-induced transcriptional regulation have been identified in many genes (12–14), the role of the AhR or the link between these genes (and those yet to be identified) and the biological effects of TCDD have not been entirely elucidated. In mouse B lymphocytes, inhibition of Ig expression (both heavy and light chain genes) and secretion has been well-documented and several studies support the involvement of the AhR signaling pathway but the specific molecular targets remain unclear (4, 9, 15–18). The detection of a DRE-core binding site within the hs1,2 and hs4 enhancers of the 3’IghRR as well as TCDD-induced binding of the AhR/ARNT nuclear complex to these sites identified the 3’IghRR as a possible transcriptional target of the AhR and TCDD (4). Indeed, 3’IghRR activation was markedly inhibited by diverse AhR ligands, which mirrored their inhibitory effect on the upregulation of endogenous Ig expression in stimulated mouse B-cells (5–7, 17, 18). Additionally, inhibition of the AhR by a chemical antagonist or expression of shRNA against the AhR demonstrated a reversal of TCDD-induced inhibition of both 3’IghRR activation and upregulated Ig expression in stimulated B-cells (published abstracts: 19, 20; manuscripts in preparation). Taken together, these results support an AhR-mediated mechanism involving inhibition of the 3’IghRR and Igh expression in the B-cell dysfunction induced by TCDD and other AhR ligands. Furthermore, AhR protein expression is markedly upregulated in activated mouse and human B cells suggesting the potential for enhanced susceptibility of activated B cells to TCDD toxicity (15, 21, 22).
Interestingly, the human 3’IghRR has been associated to date with several human immune-related disorders including Burkitt’s lymphoma, Celiac disease, IgA nephropathy, and more recently systemic sclerosis, plaque psoriasis, psoriatic arthritis, dermatitis herpetiformis, and rheumatoid arthritis (23–28). With the exception of Burkitt’s lymphoma (which was not evaluated), incidence and/or severity of these diseases appears to correlate with a polymorphism within the human hs1,2 (hu-hs1,2) enhancer of the α1 3’IghRR. This polymorphism is characterized by an approximately 38 bp invariant sequence (IS) that is repeated in tandem up to three times and contains potential binding sites for NF-κB, AP-1, Sp1 and NF1 (29–32) (Fig. 1B). Using an electrophoretic mobility shift assay (EMSA) with a NF-κB consensus oligo and antibodies against Sp1 as competitors, Frezza et al. (33) verified binding of NF-κB and Sp1 within the IS of hu-hs1,2. Additionally, we have identified a DRE-like site within the IS that contains the DRE-core motif and is well-conserved with the functional DRE previously evaluated by EMSA in the mouse hs1,2 (4). Therefore, the objective of the current study was to determine if, like the mouse 3’IghRR, the polymorphic hu-hs1,2 enhancer is sensitive to TCDD-induced modulation.
Utilizing stable expression of a transgene or transient expression of luciferase reporter constructs in a well-characterized mouse B-cell line model (CH12.LX), we identified a marked difference in the effects of TCDD on human versus mouse hs1,2 activity. TCDD significantly inhibited LPS-induced activation of the mouse hs1,2 enhancer (mo-hs1,2). This is consistent with the inhibitory effect of TCDD on mouse 3’IghRR activation. In contrast, hu-hs1,2 was significantly activated by TCDD and this activation was enhanced with LPS stimulation. Additionally, we observed a similar TCDD-induced activation of hu-hs1,2 in a human B-cell line (IM-9). A major difference between the human and mouse hs1,2 enhancers is the presence of a high affinity Pax5 binding site within mo-hs1,2 that is not present in hu-hs1,2 (34). In our study, insertion of the high affinity Pax5 binding site within hu-hs1,2 suppressed basal reporter activity and overall activity induced by TCDD and/or LPS but did not change TCDD’s effect (i.e. no shift from activation to inhibition). Furthermore, utilizing deletional analysis, we found that the IS significantly contributed to hu-hs1,2 activity but TCDD-induced hs1,2 activation was not strictly dependent on IS number. Moreover, the AhR appears to play a prominent role in the effects of TCDD on hu-hs1,2 activity based on the antagonism of TCDD-induced activity with pre-treatment of an AhR antagonist. Taken together our results suggest that hu-hs1,2 is a significant target of TCDD and support species differences in regulation of the hs1,2 enhancer. Since TCDD represents a large class of AhR ligands found in the environment, diet, and pharmaceuticals, potential exposure to a broad range of chemicals could modulate hu-hs1,2 activity and influence the occurrence and/or severity of human diseases associated with the hu-hs1,2.
MATERIALS AND METHODS
Human Buccal Cell Genomic DNA Isolation, Nested PCR, and Sequence Analysis for hs1,2 Allelic Determination
Genomic DNA from buccal cells (approved by the Wright State University Institutional Review Board under protocol SC# 3584) was extracted using the GenElute Mammalian Genomic DNA Kit according to the manufacturer’s instructions (Sigma-Aldrich, St. Louis, MO). Genomic DNA (1 µg) was used as the template in the first round of a two-round nested PCR assay, which allows for selective amplification within the α1 rather than α2 3’IghRR (Fig. 1A), as previously described (32). Briefly, the 5.4-kb fragment of α1 3’IghRR was selectively amplified by the hu - α1 3’IghRR primers (Table 1). The first round PCR reaction conditions were: 1.5 units of Taq Platinum High Fidelity (Invitrogen, Carlsbad, CA, USA), 1× Platinum High Fidelity Buffer, 0.2 mM dNTPs, 1.5 mM MgCl2, 15 pmol primers, and water to a final volume of 50 µL. The reaction cycles were 94°C for 2 min followed by 10 cycles at 94°C for 30 s, 59°C for 30 s, 68°C for 5 min, followed by 20 more cycles at 94°C for 30 s, 57°C for 30 s, 68°C for 5 min and one final extension at 72°C for 10 min. The second round, nested PCR selectively amplified the polymorphic region of the α1 hs1,2 enhancer using the hu - α1 hs1,2 primers as previously identified (32) (Table 1). For the nested PCR, the template was 10 µL from the first round PCR reaction and the reaction conditions were: 1 unit of HotMaster Taq DNA polymerase (5 PRIME, Gaithersburg, MD), 1× reaction buffer, 0.2 mM dNTPs, 15 pmol primers, and water to a final volume of 50 µL. The reaction cycles were 94°C for 2 min followed by 30 cycles at 94°C for 30 s, 56°C for 30 s, 72°C for 1 min followed by a final extension at 72°C for 5 min. The second round PCR products (30 µL) were separated on an 8% polyacrylamide gel, stained with SYBR Green I Nucleic Acid for 40 min and visualized using a LAS3000 Fuji imager (Fujifilm Medical Systems U.S.A., Inc., Stamford, CT). The α1A, α1B, α1C, and α1D alleles produce PCR product sizes of 297 bp, 350 bp, 403 bp, and 456 bp, respectively. Allele assignments were confirmed by sequencing (Retrogen Inc., San Diego, CA).
Table I.
Primers used for real-time PCR, two-round nested PCR and site-directed mutagenesis.
| Targeta | Forward (F) and Reverse (R) Primer Sequences |
|---|---|
| Igh-Cα | F: 5’-TGACTCTAACCCCGTCCAAG-3’ R: 5’-CTCCCAGGTGAAGACAGCTC-3’ |
| Igl-Cκ | F: 5’-GGAAGATTGATGGCAGTGAAC-3’ R: 5’-ACTCGTCCTTGGTCAACGTGAG-3’ |
| β-actin | F: 5’-GCTACAGCTTCACCACCACA-3’ R: 5’-TCTCCAGGGAGGAAGAGGAT-3’ |
| hu - α1 3’IghRR |
F: 5’-CCTGATTACTGAGCCCTGATCCT-3’ R: 5’-TTCTCTCTGTACAGTGGGGACCA-3’ |
| hu - α1 hs1,2 |
F: 5’-GACTCATTCTGGGCAGATTG-3’ R: 5’-GTCCTGGTCCCAAAGATGG-3’ |
| α1AΔIS1 | F: 5’-CAGGATTCTCCCCCCCCCTCCCCC-3’ R: 5’-GGGGGAGGGGGGGGGAGAATCGTG-3’ |
| α1BΔIS1 | F: 5’-GGGGGAGGGGGCGGGAGAATCGTG-3’ R: 5’-CACGATTCTCCCGCCCCCTCCCCC-3’ |
| α1A + Pax5 |
F: 5’-GTGGTCCCAGTGTCAGCCCTGGGGTGTTGAGCCACCCATCCTTGCCCTAACCCAAGTGGGCCT-3’ R: 5’-AGGCCCACTTGGGTTAGGGCAAGGATGGGTGGCTGCACACCCCAGGGCTGACACTGGGACCAC-3’ |
Primer targets for real-time PCR analysis (Igh-Cα and Igl-Cκ, endogenous Ig heavy- and light- chain gene expression; β-actin, housekeeping gene), two-round nested PCR analysis (hu - α1 3’IghRR, first-round PCR; hu - α1 hs1,2, second-round), site-directed mutagenesis (α1AΔIS1, deletion of IS1 in α1A; α1BΔIS1, deletion of IS1 in α1B; α1A + Pax5, insertion of Pax5 binding site in α1A).
Chemicals and Reagents
TCDD, in 100% DMSO, was purchased from AccuStandard Inc. (New Haven, CT). The certificate of product analysis stated the purity of TCDD to be 99.1%, as determined by AccuStandard using gas chromatography/mass spectrometry. The previously characterized AhR antagonist CH-223191 (35) was purchased from Calbiochem (San Diego, CA) and dissolved in 100% DMSO. DMSO and LPS (Escherichia coli) were purchased from Sigma-Aldrich. LPS was dissolved in 1× PBS.
Cell Lines
The CH12.LX B-cell line was derived from the mouse CH12 B-cell lymphoma (36), which arose in B10.H-2aH-4bp/Wts mice (B10.A × B10.129). The CH12.LX cell line was characterized by Bishop and Haughton (37) and was generously donated by Dr. Geoffrey Haughton (University of North Carolina, Chapel Hill, NC). Since its initial characterization, the CH12.LX cell line has been extensively utilized to study a variety of cellular processes specific to B cells and has provided a useful model in studying the effects of TCDD on B-cell function since it expresses a functional AhR signaling pathway and exhibits TCDD-induced effects on Ig expression that mirror effects seen in vivo and in primary B lymphocytes (4, 6, 18, 38). Additionally, the CH12.LX cell line is known to spontaneously class switch (39) and the CH12.LX clone utilized in these studies is an IgA-expressing variant of the original line as verified by flow cytometry and ELISA (7). Utilizing these cells and employing the γ2b mini-locus model, developed and generously provided by Dr. Laurel Eckhardt (Hunter College, The University of New York City, New York, NY) (40), we also generated the CH12.γ2b-3’Igh cell line, which stably expresses a single copy of an inducible γ2b Igh transgene under the regulation of the 3’IghRR with loxP sites flanking the hs3B and hs4 enhancer pair (7, 40). Since the CH12.LX cells have class switched to IgA, the CH12.γ2b-3’Igh cells do not endogenously express γ2b Igh or secrete IgG2b (7). As described by Shi et al. (40), we transiently transfected a CRE recombinase-GFP expression plasmid in the CH12.γ2b-3’IgH cells, sorted the cells for GFP expression, and isolated deletional derivative clones (CH12.γ2b-hs3A/hs1,2) that only expressed a γ2b transgene regulated by the hs3A and hs1,2 enhancer pair (Fig. 2B). The hs3A and hs1,2 enhancers originated from a 1.1-kb XbaI fragment containing the hs3A enhancer and a 3.6-kb XbaI-HindIII fragment containing the hs1,2 enhancer both of which were isolated from the λ phage clone M2 containing BALB/c genomic DNA (40). Clones were characterized by PCR analysis for successful recombination and deletion of the hs3B and hs4 enhancer pair (data not shown). The CH12.γ2b-hs3A/hs1,2 and CH12.LX cell lines were grown as previously described (7).
FIGURE 2. TCDD inhibits LPS-induced mo-hs1,2 enhancer activity.

A, CH12.LX cells were transiently transfected with the mo-hs1,2 reporter plasmid. Cells were either cultured for 24 h with media alone (NA, naive) or with varying concentrations of TCDD (0 – 10.0 nM) in the presence of LPS (1.0 µg/mL) stimulation. Luciferase enzyme activity (mean ± SEM, n=3) is represented on the y-axis as relative light units (RLUs). B, CH12.γ2b-hs3A/hs1,2 cells which express a γ2b transgene under the regulation of the hs3A/hs1,2 enhancer pair were either cultured for 48 h in media alone (NA) or treated with various concentrations of TCDD (0 – 10.0 nM) in the presence of LPS (1.0 µg/mL) stimulation. γ2b protein expression (mean ± SEM, n=3) in the cell lysate was determined by sandwich ELISA and standardized to ng/1 µg of total protein as shown on the y-axis. “C” denotes LPS stimulation alone. Significance was determined by a 1-way ANOVA followed by a Dunnett’s post-hoc test: “**”, significance from the corresponding vehicle control (0.01% DMSO, denoted 0 nM TCDD) at p<0.01. Results are representative of at least three independent experiments.
The human IM-9 B-cell line originated from an Epstein-Bar virus-transformed B lymphoblast isolated from a Caucasian female patient with multiple myeloma and was purchased from American Type Culture Collection (ATCC Number CCL-159; Manassas, VA). The IM-9 cells have previously been shown to express a functional AhR signaling pathway (41), which is an important characteristic for an appropriate cellular model to study the effects of TCDD on B-cell function. IM-9 cells were grown in RPMI 1640 media (Mediatech, Herndon, VA) supplemented with 10% bovine calf serum (Hyclone, Logan, UT), 10 mM HEPES, 20 mM sodium bicarbonate, 100 units/mL penicillin, 100 µg/mL streptomycin, 2 mM L-glutamine, 4.5 g/L glucose, 1.0 mM sodium pyruvate, and 50 µM β-mercaptoethanol. All cells were maintained at 37°C in an atmosphere of 5% CO2. Additionally, cell viability for all cell lines was measured by trypan blue exclusion and was minimally affected by LPS, DMSO, or TCDD treatment (data not shown).
Protein Isolation for γ2b Analysis
CH12.γ2b-hs3A/hs1,2 cells in media alone (naive, denoted NA) or stimulated with LPS (1 µg/mL, LPS alone control denoted C) and treated with varying concentrations of TCDD (0–10 nM) or the vehicle control (0.01% DMSO, denoted 0 nM TCDD) were plated into 12-well plates at a concentration of 2.5×10⁴ cells/well and incubated for 48 h. Protein isolation and ELISA analysis for γ2b protein levels was performed as previously described (7). Briefly, cells were centrifuged at 3000 rpm and lysed with mild lysis buffer (1% NP-40, 150 mM NaCl, 10 mM NaPO4, 2 mM EDTA) containing freshly added protease inhibitors (Complete Mini Protease Inhibitor Cocktail; Roche Diagonostics, Indianapolis, IN). Cell lysates were centrifuged at 14,000 rpm then supernatants were collected and stored at −80°C until analysis. To measure γ2b, cell lysates were thawed on ice and protein concentrations were determined by a Bradford assay (Bio-Rad Laboratories, Hercules, CA). Samples were then diluted to the lowest sample concentration and 1 µg of total protein was analyzed for γ2b by ELISA as described (4) and colorimetric detection was performed every minute over a 1 h period using a Spectramax plus 384 automated microplate reader with a 405-nm filter (Molecular Devices, Sunnyvale, CA). The concentration of γ2b in each sample was calculated using SOFTmax PRO analysis software (Molecular Devices) using a standard curve generated from the kinetic rate of absorption for known γ2b concentrations. Results are represented as the mean ng of γ2b IgH per 1 µg of total protein ± S.E. (n=3 to 4).
RNA Isolation, cDNA Synthesis, and Real-Time PCR
CH12.LX cells in media alone (naive, denoted NA) or stimulated with LPS (1 µg/mL, LPS alone control denoted C) and treated with 10 nM TCDD or the vehicle control (0.01% DMSO, denoted 0 nM TCDD) were plated into 12-well plates at a concentration of 2.5×10⁴ cells/well and incubated for 0, 24, 36, or 48 h. Total RNA was isolated using TRI Reagent (Sigma-Aldrich) according to the manufacturer’s protocol. The RNA concentration was determined using a NanoDrop (Thermo Scientific, Wilmington, DE) and 200 ng total RNA was reverse transcribed to cDNA using the Taqman Reverse Transcription Reagents kit (Applied Biosystems, Foster City, CA) in a 10 µl reaction volume. The reaction cycles were 25°C for 10 min, 48°C for 30 min and 95°C for 5 min. The expression of β-actin (endogenous control to normalize cDNA concentrations) and the endogenous heavy- and light-chain (i.e. α constant region, Cα and κ constant region, Cκ, respectively) genes were quantified by real-time PCR using SYBR Green PCR Master Mix (Applied Biosystems) as previously described (42). Primers for Cα, Cκ, and β-actin span an intron and are listed in Table 1. The results of the PCR amplification were analyzed using the 7500 system SDS software to determine relative quantification values (i.e. fold-change).
Reporter Plasmids
The mo-hs1,2 luciferase reporter plasmid was kindly provided by Dr. Robert Roeder (Rockefeller University, New York, NY) and consisted of the variable heavy chain (VH) promoter upstream and mo-hs1,2 enhancer downstream of the luciferase gene (43) (Fig. 2A). The mo-hs1,2 enhancer insert has been previously described as a 4-kb XbaI fragment containing the hs1,2 enhancer (approximately an 1.3-kb region located 700 bp from the 5’ end of the 4-kb XbaI fragment) (44). Human α1 hu-hs1,2 luciferase reporter plasmids were generously provided by Dr. Michel Cogné (Laboratoire d’Immunologic, Limoges, France) and included the VH promoter alone and the α1A, α1B, and α1C polymorphic hu-hs1,2 plasmids. The hu-hs1,2 reporters contained the VH promoter (181-bp) 5’ of the luciferase gene and the hu-hs1,2 enhancer with either one (α1A), two (α1B), or three (α1C) IS 3’ of the luciferase gene (29) (Fig. 4A). Sequencing of the hu-hs1,2 enhancer inserts (approximately 542-bp depending on the number of IS repeats) verified the presence of the 302-bp sequence previously identified by Mills et al. as the hu-hs1,2 enhancer (EMBL AF013723), which includes a 135-bp sequence with core homology to the mo-hs1,2 enhancer (34). All reporter plasmids consisted of a 4.818-kb pGL3 basic luciferase reporter backbone (Promega, Madison, WI). Additionally, the hu-hs1,2 plasmids unexpectedly contained a transcriptionally active DRE core motif in the multiple cloning site of the pGL3 backbone which was deleted by site-directed mutagenesis to eliminate any potential influence on transcriptional activity (data not shown, submitted for publication).
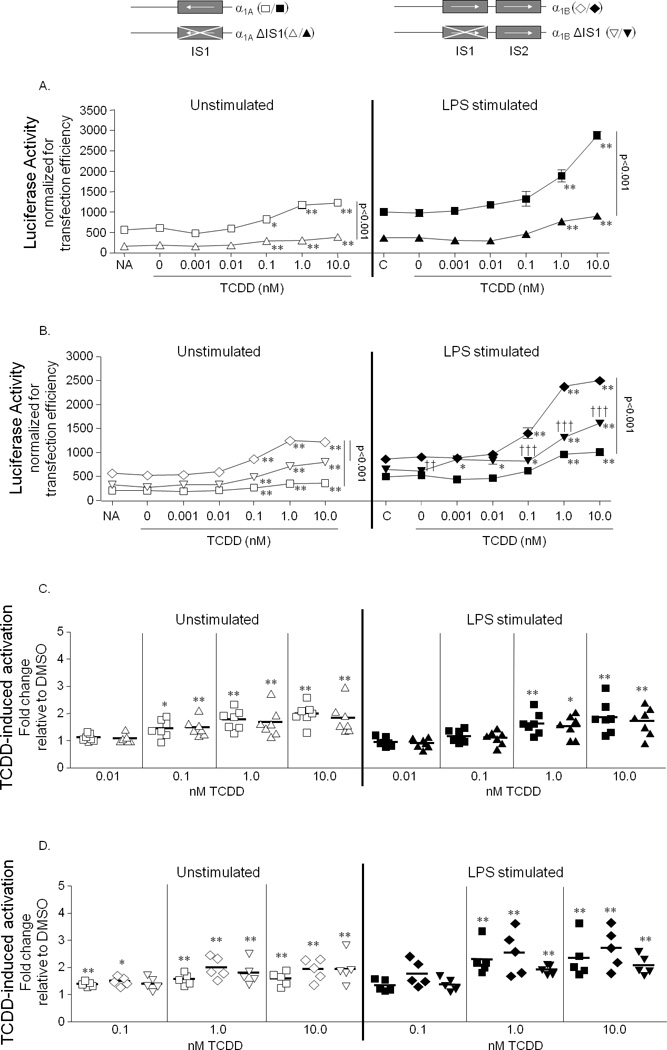
FIGURE 4. TCDD activates the polymorphic hu-hs1,2 enhancer in a concentration-dependent manner.

A, Schematic of human VH promoter alone and α1 hs1,2 allelic constructs containing the invariant sequence (IS, denoted by a star). All luciferase reporter plasmids originated from the pGL3 Basic vector (Promega) and the polymorphic α1 hu-hs1,2 enhancers were inserted 3’ of the luciferase gene. B and C, CH12.LX cells were transiently transfected with VH, α1A, α1B, or α1C reporter constructs. Transfected cells were cultured for 24 h with either media alone (NA, naïve) or with varying concentrations of TCDD (0 – 10.0 nM) in the absence or presence of LPS (1.0 µg/mL) stimulation. B, Luciferase enzyme activity (mean ± SEM, n=3) is represented on the y-axis as relative light units (RLUs) normalized to transfection efficiency and relative to the naïve control (set to 1 RLU) of the VH reporter. “C” denotes LPS stimulation alone. “>” denotes a synergistic activation by a TCDD and LPS co-treatment compared to the activation induced by either treatment alone. LPS-stimulated samples were significantly (at least p<0.01) elevated compared to their corresponding unstimulated samples as determined by a 1-way ANOVA followed by a Bonferroni’s post-hoc test (not represented on graph). Results are representative of three separate experiments. C, TCDD-induced activation is represented on the y-axis as fold-change relative to the respective vehicle control (0.01% DMSO, 0.0 nM TCDD) and was generated from 3 to 11 separate experiments; each symbol (square, triangle, inverted triangle, and diamond signify the VH, α1A, α1B, and α1C reporter constructs, respectively) represents the mean (n=3) from a single experiment. Significance compared to either the corresponding vehicle control (0.01% DMSO, denoted 0 nM TCDD) (B) or the respective VH reporter (C) was determined by a 1-way ANOVA followed by a Dunnett’s post-hoc test: “*”, “**”, significance at p<0.05 and p<0.01, respectively.
Site-Directed Mutagenesis
Mutations of the α1A and α1B plasmids were generated using PCR-based site-directed mutagenesis according to the manufacturer’s instructions (QuickChangeXL Site-Directed Mutagenesis Kit, Strategene, La Jolla, Ca). Briefly, deletion of the IS within the α1A plasmid (α1AΔIS1), deletion of the first IS from the α1B plasmid (α1BΔIS1), and addition of the high affinity Pax5 binding site within the α1A (α1A + Pax5) were accomplished using primers listed in Table 1. For the α1A + Pax5 plasmid, the high affinity Pax5 site was inserted downstream of the AP-1/Ets, Oct, and IS in the α1A hu-hs1,2 (specifically 26 bp 3’ of the Sp1 site) to most closely resemble the mo-hs1,2 where the Pax5 is present downstream of the DRE, NF-κB, AP-1/Ets, and Oct binding sites (Fig. 1B). PCR reaction conditions were: 95°C for 1 min followed by 18 cycles at 95°C for 50 s, 60°C for 50 s, 68°C for 5.5 min (1 min/kb of plasmid length), then 68°C for 7 min. Following the PCR reaction, the parental plasmid was digested by incubating with Dpn I (1 µL/50 µL reaction) for 1 h at 37°C. Clones of mutated plasmids were replicated in bacteria and screened for the correct mutation by DNA sequencing (Retrogen Inc., San Diego, CA).
Transient Transfection and Luciferase Assay
For transient transfections, CH12.LX or IM-9 (1.0×10⁷) cells were resuspended in 200 µL of culture media with 10 µg of plasmid and transferred to a 2-mm gap electroporation cuvette (Molecular BioProducts, San Diego, CA). Cells were electroporated using an electro cell manipulator (ECM 630; BTX, San Diego, CA) with the following voltage, capacitance and resistance: 250 V, 150 µF, and 75 Ω for CH12.LX cells and 150 V, 1700 µF, and 75 Ω for IM-9 cells. For each reporter plasmid, multiple transfections were pooled and cells were aliquoted in triplicate into 12-well plates at 2.0×10⁵ cells/mL for CH12.LX cells and 1.0×10⁶ cells/mL for IM-9 cells. Immediately after transfection, cells were treated for 24 h with TCDD (0–30 nM) in the absence or presence of LPS (0–1.0 µg/mL) stimulation. The vehicle control for TCDD was 0.01% DMSO (denoted 0 nM TCDD). For the AhR antagonist studies, CH12.LX cells were treated with 15 µM CH-223191 for 1 h prior to TCDD (1 nM) and LPS (1.0 µg/mL) treatment. Based on a pre-treatment time course, the IM-9 cells were treated for 6 h with 15 µM CH-223191 prior to TCDD (30 nM) treatment. The vehicle control for TCDD and CH-223191 was 0.16% DMSO to account for the increased vehicle concentration of a TCDD and CH-223191 co-treatment. After the 24-h incubation period, cells were lysed with 1× reporter lysis buffer (Promega) and immediately frozen at −80°C. As previously described, luciferase enzyme activity was measured and the activity was normalized to transfection efficiency by real-time PCR analysis of the luciferase gene (6). Briefly, DNA was isolated in triplicate using the GenElute Mammalian Genomic DNA miniprep kit (Sigma-Aldrich) and was diluted 10-fold then analyzed by real-time PCR using SYBR Green for the luciferase gene. Plasmid number per cell was calculated with the equation: [(ng of plasmid) × (molecules/ng of plasmid)/cell number] × 10 to account for the 10-fold dilution of DNA used in the PCR reaction. To determine the variance in transfection efficiency between plasmids, we first adjusted for normal experimental variation by calculating the transfection efficiency for each experiment as fold change relative to the control plasmid. The transfection efficiencies for each plasmid from several experiments were then averaged to generate the mean fold-change relative to the control plasmid. There was little variation in the transfection efficiencies between plasmids and the chemical treatment did not significantly influence transfection efficiency (data not shown). Luciferase activity is represented as either relative light units (RLU), RLU relative to the naïve of the VH reporter, or fold-change relative to the appropriate DMSO vehicle control (0 nM TCDD).
Statistical Analysis
Luciferase activity and γ2b IgH levels are represented as the mean ± SEM for each treatment group (n=3) from a representative experiment. For fold-change graphs, RLU values were transformed to TCDD-induced fold-change (mean ± SEM) relative to the DMSO (0 nM TCDD) control set to 1. The mean (n=3) was then determined for each treatment group and the means generated from several experiments were either displayed as individual data points or the average (mean ± SEM) of several experiments. As indicated in the figure legends, significant differences at p<0.05 were determined either by a 2-way ANOVA with a Bonferroni post-hoc test, 1-way ANOVA with a Dunnett’s post-hoc test, or an unpaired t-test.
RESULTS
The mo-hs1,2 enhancer of the 3’IghRR is a sensitive target for TCDD-induced inhibition
The CH12.LX mouse B-cell line expresses a functional AhR signaling pathway and exhibits TCDD-induced inhibition of Ig heavy- and light-chain gene expression and antibody secretion that mirror effects seen in vivo and in primary B cells (4, 7, 15, 17, 18). Correspondingly, our previous reporter studies with the CH12.LX cells demonstrated a marked inhibition by TCDD of LPS-induced mouse 3’IghRR (composed of the hs3A; hs1,2; hs3B; and hs4 enhancers) activation that appears to involve the AhR (4–7). In striking contrast, LPS and TCDD co-treatment resulted in a marked activation of the mouse hs4 enhancer (mo-hs4) (6), suggesting that TCDD-induced inhibition of LPS-stimulated 3’IghRR activity is mediated at the hs1,2 enhancer. To test this hypothesis, we utilized a reporter gene identical to our earlier experiments except that it was regulated by mo-hs1,2 as shown in Fig. 2A. Like the mouse 3’IghRR reporter but in contrast to the mo-hs4 reporter (6), TCDD inhibited mo-hs1,2 activation in a concentration-dependent manner (Fig. 2A).
To avoid many of the limitations associated with transient transfections and to better reflect endogenous Igh regulation and chromatin accessibility, we generated a variant of the CH12.LX B-cell line (CH12.γ2b-hs3A/hs1,2) that stably expresses a single copy of a γ2b transgene (40) under the regulation of the hs3A and hs1,2 enhancers. CH12.γ2b-hs3A/hs1,2 cells demonstrated an LPS-induced increase in γ2b expression that was inhibited by TCDD (Fig. 2B). Although we cannot say that the inhibitory effect of TCDD on γ2b expression is entirely due to hs1,2, these results are consistent with the effects of TCDD on the mo-hs1,2 luciferase reporter (compare Fig. 2A and 2B). Interestingly, the CH12.γ2b-hs3A/hs1,2 cell line model (γ2b-regulated by hs3A and hs1,2) appears to be more sensitive to TCDD-induced inhibition compared to the mo-hs1,2 luciferase reporter (Fig. 2B compared to 2A). This may reflect a contribution of the hs3A enhancer present in the stable reporter and/or differences in the sensitivity of transient versus stable reporters (i.e. the hs1,2 luciferase enhancer generally has low transfection efficiency and lower overall luciferase activity; 6). Nevertheless, the current results in combination with previous studies (4–7, 15), suggest that the hs1,2 enhancer or the hs3a/hs1,2 enhancer pair mediates TCDD-induced inhibition of LPS-stimulated 3’IghRR activity.
As stated above, previous studies have identified a sensitive inhibition by TCDD of Ig heavy- and light-chain gene expression and antibody levels in activated primary B-cells and CH12.LX (IgM+) cells (4, 15, 17, 18). Since the current studies utilize a variant of the CH12.LX cells that express IgA instead of IgM, we evaluated the effect of TCDD on LPS-induced expression of the endogenous heavy- and light-chain Ig genes (i.e. α constant region, Cα and κ constant region, Cκ, respectively). TCDD significantly inhibited LPS-induced expression of both Cα and Cκ at 24, 36, and 48 h (Fig. 3). This correlates well with previous results demonstrating inhibition by TCDD of IgA protein levels in these cells (7) and with luciferase and γ2b reporter results demonstrating inhibition of the 3’IghRR and the hs1,2 (and hs3B/hs1,2) enhancer (4–7, 15 and Fig. 2).
FIGURE 3. TCDD inhibits endogenous Ig heavy- and light-chain genes.

CH12.LX cells (2.5 × 10⁴ cells/mL) stimulated with LPS and treated with 10 nM TCDD or the vehicle control (0.01% DMSO, denoted 0 nM TCDD) were plated into 12-well plates and incubated for 24, 36, or 48 h prior to total RNA isolation. Total RNA (200 ng) was reverse transcribed to cDNA and utilized to amplify the endogenous heavy- and light-chain genes (Cα and Cκ respectively) via SYBR®Green real-time PCR. The results are expressed as the relative quantification (RQ) value compared to cells cultured with media alone (NA, naive). Results are representative of three separate experiments (n=3 for each treatment group). Statistical differences compared to the respective vehicle control were determined by a 1-way ANOVA with a Dunnett’s post-hoc test; ** P < 0.01 or *** P<0.001.
TCDD activates the human polymorphic hs1,2 enhancer in the mouse CH12.LX B-cell line and in the human IM-9 B-cell line
As mentioned previously, the polymorphic α1 hu-hs1,2 enhancer has been correlated with several autoimmune diseases in humans (23–28) and we have identified a DRE binding site within the IS, which closely resembles the binding site found in mo-hs1,2 (Fig. 1B). Our previous studies have identified TCDD-induced AhR binding to the DRE site within mo-hs1,2 (4) and here we demonstrate inhibition of mo-hs1,2 activation by TCDD (Fig. 2A and 2B). If in fact this inhibition is mediated through the DRE site, it follows that hu-hs1,2 could also be a transcriptional target of TCDD, perhaps with greater sensitivity with an increasing number of IS and DRE sites. Therefore, we evaluated the effect of TCDD as well as B-cell activation by LPS or the combination of both on luciferase reporter plasmids regulated by the VH promoter and the human α1 hs1,2 enhancer with one, two, or three of the IS (representing alleles α1A, α1B, or α1C; Fig. 4A). Surprisingly, TCDD had a striking but divergent effect on the hu-hs1,2 alleles as compared to mo-hs1,2. In the absence of LPS stimulation, TCDD significantly activated the hu-hs1,2 in a concentration-dependent fashion and at TCDD concentrations as low as 0.1 nM for α1A and α1B and 0.01 nM for α1C (Fig. 4B). LPS stimulation synergistically enhanced TCDD-induced activation of the hu-hs1,2 enhancers but not of the VH promoter (Fig. 4B). Since LPS has been shown to increase AhR protein expression and to activate transcription factors with binding sites within the hu-hs1,2 (i.e. AP-1, NF-κB, Oct) that are also influenced by TCDD and/or the AhR (4, 13, 15, 21, 22, 45), we further evaluated the synergy between TCDD and LPS by conducting concentration response studies with LPS. Synergism was dependent on both the TCDD and LPS concentration and was solely mediated by the hu-hs1,2 enhancer (no synergistic activation of the VH promoter) (Fig. 4B and 5A). Additionally, the magnitude of synergism was greater with an increased number of IS. In contrast, the TCDD-induced fold-effect though dependent on the concentration of TCDD and LPS was not dependent on the number of IS (Fig. 4C and 5B). In the absence of LPS-stimulation, the VH promoter alone exhibited noticeable variation in TCDD-induced fold activation. This variation may be due to the very low basal activity of the VH promoter, typically well-below 100 RLU compared to 200 RLU or higher following LPS stimulation or the addition of the hs1,2 enhancer. Correspondingly, LPS stimulation or the addition of the hs1,2 enhancer exhibited less variation (Fig. 4C and 5B). In any case, the human hs1,2 enhancers induced a markedly greater level of overall reporter activity as compared to the VH promoter alone though a strict dependence on the number of IS was less consistent when all of the reporters were analyzed together. Additionally, the synergistic activation of the hs1,2 enhancers by TCDD and LPS, as opposed to the TCDD-induced fold-change, was consistently influenced by the number of IS, particularly with the α1C allele.
FIGURE 5. LPS modulates TCDD-induced activation of the polymorphic hu-hs1,2 enhancer in a concentration-dependent manner.

CH12.LX cells were transiently transfected with VH, α1A, α1B, or α1C reporter constructs. Transfected cells were cultured for 24 h with either media alone (0 µg/mL LPS control) or with varying concentrations of LPS (0.001 – 1.0 µg/mL) in the absence (denoted “Control”) or presence of 0.01% DMSO or 10 nM TCDD. A, Luciferase enzyme activity (mean ± SEM, n=3) is represented on the y-axis as relative light units (RLUs) normalized to transfection efficiency and relative to the naïve control (set to 1 RLU) of the VH reporter. “>” denotes a synergistic activation by a TCDD and LPS co-treatment compared to the activation induced by either treatment alone. Results are representative of three separate experiments. B, TCDD-induced activation is represented on the y-axis as fold-change relative to the respective DMSO vehicle control and was generated from three separate experiments; each symbol (square, triangle, inverted triangle, and diamond signify the VH, α1A, α1B, and α1C reporter constructs, respectively) represents the mean (n=3) from a single experiment. Significance was determined by a 1-way ANOVA followed by a Dunnett’s post-hoc test. A, “*” and “**”, significance from the corresponding DMSO vehicle control at p<0.05 and p<0.01, respectively; “†”, “††”, significance from the corresponding naïve control (0 µg/mL LPS) at p<0.05, p<0.01, respectively. B, “*”, significance compared to the respective VH reporter at p<0.05.
The effect of TCDD on the hu-hs1,2 was not limited to a mouse cell line but a similar effect was also demonstrated in a human B-cell line, IM-9. The IM-9 cells have previously been shown to express a functional AhR signaling pathway (41), which we validated by western blot analysis for the AhR and by TCDD-induced CYP1A1 mRNA induction (hallmark endpoint of a functional AhR signaling pathway). Notably, the IM-9 cells express much lower levels of AhR, which correlated with a weaker TCDD-induced CYP1A1 induction as compared to the CH12.LX cells (data not shown). Similar to the CH12.LX cells, TCDD treatment of IM-9 cells transiently transfected with the hu-hs1,2 reporters demonstrated increased transcriptional activity; however, the greatest transcriptional activity and fold-change was most consistently seen with the α1B allele (Fig. 6). Additionally, TCDD induced a lower fold-induction of the hu-hs1,2 reporters in the IM-9 cells as compared to the CH12.LX cells and a higher concentration of TCDD (30 nM vs. 10 nM) was required to induce this effect which correlates with the lower basal AhR expression in the IM-9 cells. Interestingly and in contrast to the CH12.LX cells, the VH promoter was minimally affected by TCDD and exhibited less variability perhaps due to the greater basal transcriptional activity of the reporters in the IM-9 cells. In the CH12.LX cells cellular activation by LPS (TLR-4 ligand) and co-treatment with TCDD lead to an enhanced activation of hu-hs1,2, which may relate to the well-documented increase in AhR protein expression shortly after B-cell activation (15, 21, 22). However similar attempts to activate the IM-9 cells with a TLR ligand were not successful. LPS, CpG, and R848 (ligands for TLR4, 7, and 9, respectively) did not induce IM-9 cells to secrete Ig (data not shown). Regardless, our results support that the polymorphic hu-hs1,2 is a significant transcriptional target of TCDD.
FIGURE 6. TCDD activates the polymorphic hu-hs1,2 enhancer in the human IM-9 B-cell Line.

IM-9 cells were transiently transfected with VH, α1A, α1B, or α1C reporter constructs. Transfected cells were cultured for 24 h with either media alone (denoted “Control”), 0.01% DMSO or 30 nM TCDD. A, Luciferase enzyme activity (mean ± SEM, n=3) is represented on the y-axis as relative light units (RLUs) normalized to transfection efficiency. Significance was determined by a 2-way ANOVA followed by a Bonferroni’s post-hoc test: “**” and “***”, significance compared to the corresponding DMSO vehicle control at p<0.01 and p<0.001, respectively; significance of polymorphic hu-hs1,2 reporters compared to the VH reporter at p<0.05 for α1A and p<0.001 for α1B and α1C (not represented on the graph). Results are representative of three separate experiments. B, TCDD-induced fold-changes in reporter activity is represented on the y-axis as fold-change relative to the respective DMSO vehicle control and was generated from six to 12 separate experiments; each symbol represents the mean (n=3) from a single experiment. Significance compared to the VH reporter was determined by a 1-way ANOVA followed by a Dunnett’s post-hoc test: “*” and “**”, significance at p<0.05 and p<0.01, respectively.
The invariant sequences contribute to hu-hs1,2 activation and the AhR mediates TCDD-induced activation
The IS contains a DRE, AP-1, NF1, and NF-κB binding site (Fig. 1B and 1C) and appears to influence basal hu-hs1,2 activity as well as the overall and synergistic activation by TCDD and LPS but less so for TCDD-induced fold-change. Since there are other putative transcription factor binding sites including AP-1/Ets and Oct outside of the IS, we utilized site-directed mutagenesis to delete the IS from our reporter constructs to determine the role of the IS in hu-hs1,2 activity. Deletion of an IS from the α1A (α1AΔIS1) or α1B (α1BΔIS1) hu-hs1,2 alleles significantly lowered basal activity as well as LPS and/or TCDD-induced activation in the CH12.LX cells (Fig. 7A and B). However, with TCDD treatment, α1BΔIS1 still exhibited significantly greater activity than α1A (Fig. 7B). Interestingly, deletion of the IS1 in the α1A hu-hs1,2 allele (α1AΔIS1) did not significantly alter the fold-induction by TCDD relative to DMSO (Fig. 7C) but there was a noticeable non-significant decrease in fold-induction by TCDD with deletion of the IS1 in the α1B hu-hs1,2 allele (α1BΔIS1) (Fig. 7D). Collectively, these results show a significant contribution of the IS to overall hs1,2 activity (i.e. naïve and in response to TCDD and/or LPS); however, the transcription factor binding sites including the DRE-like site within the IS do not appear to greatly influence fold-induction by TCDD.
FIGURE 7. Deletion of the IS from the α1A and α1B hu-hs1,2 constructs reduces overall reporter activity.
CH12.LX cells were transiently transfected with reporter constructs regulated by either the wild-type α1A (square), α1A with the IS deleted (α1AΔIS1, triangle), wild-type α1B (diamond), or α1B with the 5’ IS deleted (α1BΔIS1, inverted triangle). Transfected cells were cultured for 24 h with either media alone (NA, naïve) or with varying concentrations of TCDD (0 – 10.0 nM) in the absence (white symbols) or presence (black symbols) of LPS (1.0 µg/mL) stimulation. “C” denotes LPS stimulation alone. A and B, Luciferase enzyme activity (mean ± SEM, n=3) of α1A and α1AΔIS1 (A) or of α1A, α1B, and α1BΔIS1 (B) is represented on the y-axis as relative light units (RLUs) normalized to transfection efficiency. Results are representative of at least five separate experiments. C and D, TCDD-induced activation of α1A and α1AΔIS1 (C) or of α1A, α1B, and α1BΔIS1 (D) is represented on the y-axis as fold-change relative to the respective DMSO vehicle control and was generated from five to seven separate experiments; each symbol represents the mean (n=3) from a single experiment. A–D, Significance compared to the corresponding vehicle control (0.01% DMSO, 0 nM TCDD) was determined by a 1-way ANOVA followed by a Dunnett’s post-hoc test: “*” and “**”, significance at p<0.05 and p<0.01, respectively. Significance between the reporters was determined by a 2-way ANOVA followed by a Bonferroni’s post-hoc test: A and B, the horizontal line represents significant differences (p<0.001) between two reporters at all treatment conditions; “††” and “†††”, significance between α1B, and α1BΔIS1 at p<0.01 and p<0.001, respectively. B and C, the reporters were not significantly different.
Therefore, our next objective was to determine the role of the AhR in TCDD-induced hu-hs1,2 activity. To this end we utilized an AhR antagonist, CH-223191, that has been shown to bind the AhR and prevent its translocation to the nucleus (35). In the CH12.LX cells, CH-223191 pre-treatment inhibited TCDD-induced Cyp1A1 expression (data not shown) and efficiently antagonized the effect of TCDD on hu-hs1,2 (Fig. 8A and 8B). The AhR antagonist inhibited both TCDD-induced overall activation and fold-change of α1A, α1B, and α1C hu-hs1,2 reporter activity with no effect on basal or LPS-induced activity (Fig. 8A and 8B). Similar results were obtained in the human IM-9 cells in that the AhR antagonist completely reversed TCDD-induced α1A, α1B, and α1C hu-hs1,2 activation (Fig. 8C and data not shown). These results support a role of the AhR in mediating TCDD-induced activation of hu-hs1,2.
FIGURE 8. TCDD activates the polymorphic hu-hs1,2 enhancer in an AhR-dependent Manner.
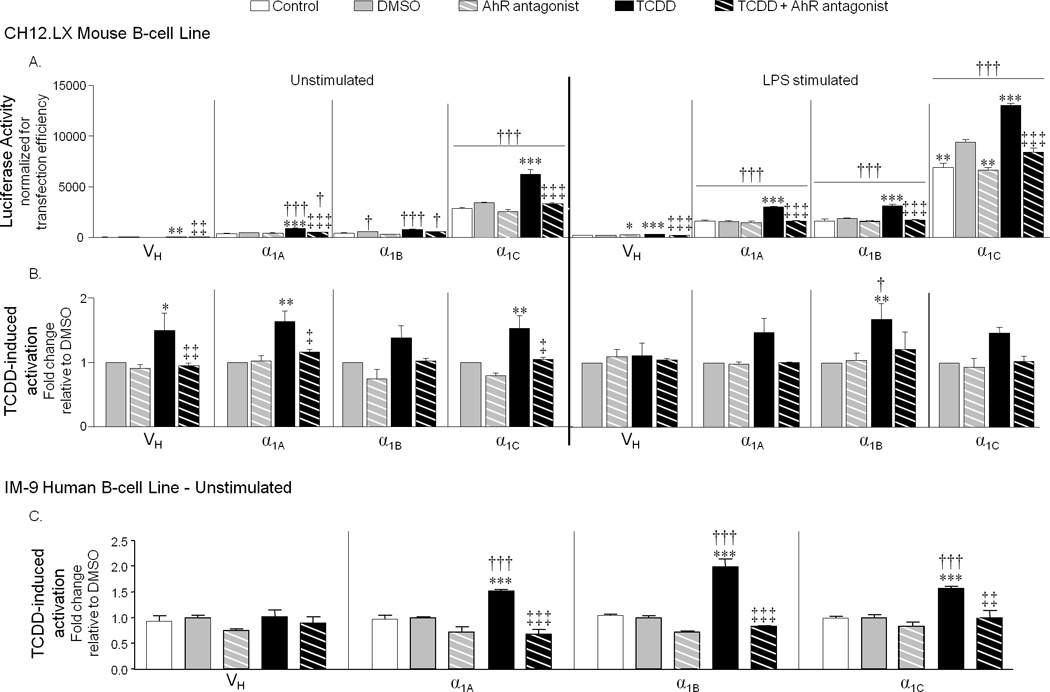
CH12.LX or IM-9 cells were transiently transfected with VH, α1A, α1B, or α1C reporter constructs. Transfected cells were either pre-treated with 15 µM AhR antagonist (CH-223191), 0.15% DMSO, or media alone then cultured for 24 h in the absence or presence of LPS (1.0 µg/mL) stimulation and either media alone, 0.01% DMSO, or TCDD (1 nM for CH12.LX; 30 nM for IM-9). The final DMSO concentration was 0.16%. “Control” denotes either unstimulated naive or LPS alone. A, Luciferase enzyme activity (mean ± SEM, n=3) in CH12.LX cells is represented on the y-axis as relative light units (RLUs) normalized to transfection efficiency. Results are representative of three separate experiments. B, TCDD-induced fold-changes in reporter activity in CH12.LX cells is represented on the y-axis as fold-change relative to the respective DMSO vehicle control and was generated from averaging the means of three independent experiments (n=3 for each treatment group within each experiment). C, TCDD-induced fold-changes in reporter activity in IM-9 cells is represented on the y-axis as fold-change (mean ± SEM, n=3) relative to the respective DMSO vehicle control and is representative of three experiments. Significance was determined by a 1-way ANOVA followed by a Dunnett’s post-hoc test (A) or 2-way ANOVA followed by a Bonferroni’s post-hoc test (B and C): “*”, “**”, “***”, significance compared to the corresponding DMSO vehicle control at p<0.05, p<0.01 and p<0.001, respectively; “‡”, “‡‡”, “‡‡‡”, significant difference between TCDD alone and TCDD + AhR antagonist. Significance compared to the VH reporter was determined by a 2-way ANOVA with a Bonferroni’s post-hoc test: “†”,“††”, and “†††”, significance at p<0.05, p<0.01 and p<0.001, respectively (A–C).
Pax5 and the species differences in regulation of the hs1,2 enhancer
A major difference between the human and mouse hs1,2 enhancers is the presence of a high and low affinity Pax5 (paired box protein 5) binding site within mo-hs1,2 that is not conserved in hu-hs1,2 (34). Pax5, a central regulator of B-cell development and differentiation (46, 47), specifically inhibits Igh expression by binding Pax5 motifs within the hs1,2 and hs4 enhancers and recruiting corepressors (48–51). During B-cell differentiation, Pax5 expression is progressively decreased lifting transcriptional repression of the Ig genes (47, 52, 53). Interestingly, TCDD treatment prevents the down-regulation of Pax5 expression in CH12.LX cells and splenic mouse B cells stimulated with LPS; this sustained Pax5 expression may contribute to the inhibitory effect of TCDD on Ig expression and antibody secretion (17, 18). Perhaps the lack of a Pax5 binding site in the hu-hs1,2 may partially explain the species differences seen here in hs1,2 enhancer regulation. Therefore we evaluated the effect of inserting the high affinity mo-hs1,2 Pax5 binding site within the α1A hu-hs1,2 reporter (α1A+Pax5). We chose the α1A allele since it is most similar to mo-hs1,2, which does not contain polymorphic tandem repeats. Insertion of the Pax5 binding site significantly suppressed TCDD-induced reporter activity in unstimulated CH12.LX cells with a minimal effect on the basal reporter activity. In LPS-stimulated CH12.LX cells, insertion of the Pax5 binding site resulted in a marked suppression of LPS-induced reporter activity (Fig. 9A) but TCDD-induced fold-change was not significantly altered (Fig. 9B). Similar to the mouse CH12.LX cell line, insertion of the Pax5 binding site in the α1A reporter did not consistently alter basal reporter activity in the human IM-9 cell line but suppression of TCDD-induced reporter activity was observed. There was no consistent effect on TCDD-induced fold-change (Fig. 9C). Cellular activation of the IM-9 cells would likely exhibit greater effects as demonstrated in the CH12.LX cells; however, as described above we were unable to activate the IM-9 cells. Taken together these results support an inhibitory role of Pax5 in LPS-induced hu-hs1,2 activity but it does not appear to mediate the inhibitory effect of TCDD on mo-hs1,2.
FIGURE 9. Insertion of a Pax5 binding site in the α1A hs1,2 construct inhibits reporter activity in mouse CH12.LX and human IM-9 cells.

CH12.LX or IM-9 cells were transiently transfected with either wild type α1A (square) or α1A with an inserted high affinity Pax5 binding site from the mo-hs1,2 enhancer (α1A+Pax5, circle). A and B, Transfected CH12.LX cells were cultured for 24 h with varying concentrations of TCDD (0 – 10.0 nM) in the absence (white symbols) or presence (black symbols) of LPS (1.0 µg/mL) stimulation. C, Transfected IM-9 cells were cultured for 24 h with either media alone (denoted “Control”), 0.01% DMSO, or 30 nM TCDD. A and C (left graph), Luciferase enzyme activity (mean ± SEM, n=3) of α1A and α1A+Pax5 is represented on the y-axis as relative light units (RLUs) normalized to transfection efficiency. Results are representative of five (A) and seven (C, left graph) separate experiments. B and C (right graph), TCDD-induced activation of α1A and α1A+Pax5 is represented on the y-axis as fold-change relative to the respective DMSO vehicle control and was generated from five (B) and seven (C, right graph) separate experiments; each symbol represents the mean (n=3) from a single experiment. Significance compared to the corresponding vehicle control (0.01% DMSO, 0 nM TCDD) was determined by a 1-way ANOVA followed by a Dunnett’s post-hoc test (A) or 2-way ANOVA followed by a Bonferroni’s post-hoc test (B and C): “*”, “**”, “***”, significance compared to the corresponding DMSO vehicle control at pα0.05, p<0.01, and p<0.001, respectively. Significance between the α1A and α1A+Pax5 reporters was determined by a 2-way ANOVA followed by a Bonferroni’s post-hoc test: A, horizontal line represents significant differences (p<0.001) at all treatment conditions; A and C (left graph), “†”, “††”, “†††”, significance at p<0.01, p<0.05, and p<0.001, respectively; B, no significant difference between the α1A and α1A+Pax5 reporters. C (right panel), TCDD-induced fold-changes of α1A and α1A+Pax5 were not significantly different as determined by an unpaired t-test.
DISCUSSION
Our previous work has identified the mouse 3’IghRR as a sensitive target of various chemicals including TCDD and other ligands for the AhR. Effects of these chemicals on 3’IghRR reflected their effects on endogenous heavy chain mRNA and protein expression (4–7), underscoring the association of 3’IghRR activity and Ig expression (3). Given that TCDD-induced inhibition of Ig expression and secretion is AhR-dependent (9, 15, 16), the 3’IghRR may be a molecular target of the AhR. Indeed, recent studies utilizing an AhR antagonist or shRNA directed against the AhR have identified a reversal in the inhibitory effect of TCDD on 3’IghRR activation and endogenous Ig expression (published abstracts: 19, 20; manuscripts in preparation). The current results suggest that inhibition of mouse 3’IghRR activation by TCDD is mediated through the hs1,2 enhancer. Due to sequence homology within the mouse and human 3’IghRR enhancers (34) and the presence of a fairly-well conserved DRE site within hu-hs1,2, we hypothesized that hu-hs1,2 is also a target of TCDD. Indeed, hu-hs1,2 activity was modulated by TCDD. Surprisingly, it was activated, which was opposite to the inhibitory effect of TCDD on mo-hs1,2. Furthermore, our inhibitor studies with an AhR-antagonist strongly support a role of the AhR in the effects of TCDD on hu-hs1,2 activity. Since several human diseases including celiac disease, IgA nephropathy, Burkitt’s lymphoma, systemic sclerosis, plaque psoriasis, and rheumatoid arthritis (23–28) have been associated with the human 3’IghRR and all (except Burkitt’s lymphoma) with the polymorphic hu-hs1,2, the occurrence and severity of these disease states could therefore be altered by AhR ligands.
Although sequence homology was identified between the mouse and human 3’IghRR enhancers, species differences in the effects of TCDD on the hs1,2 enhancer is in agreement with previous suggestions of potential differences in regulation due to a lack of conservation of specific transcription factor binding sites (e.g. Pax5) outside of the species-conserved regions (30, 34). Sepulveda and co-workers (54) demonstrated a difference in regulation of the human versus mouse hs4 enhancer in that Oct-2 and NF-κB/Rel proteins cooperatively regulated human hs4 activity but not Oct-1 and Pax5 as seen previously with the mouse hs4 enhancer (50). A similar mechanism may occur for hs1,2 enhancer regulation since insertion of the mo-hs1,2 high affinity Pax5 binding site into hu-hs1,2 (α1A+Pax5) significantly decreased TCDD and LPS-induced activation of hu-hs1,2. However, under the current experimental conditions, Pax5 does not appear to mediate the species differences in the effects of TCDD on hs1,2 activity (i.e. TCDD-induced activation of hu-hs1,2 vs. inhibition of mo-hs1,2). Alternatively, the mo-hs1,2 enhancer contains a high affinity and a low affinity Pax5 binding site; perhaps both are necessary for the inhibitory effect of TCDD.
The effects of TCDD on hu-hs1,2 resemble the effects on mo-hs4 which has previously been shown to be synergistically activated by co-treatment with TCDD and LPS (5, 6). Activation of mo-hs4 was initially difficult to reconcile with the overall inhibitory effect of TCDD on mouse 3’IghRR activation. However, as shown here, this dichotomy is balanced by the negative effect of TCDD on mo-hs1,2 activity which may mediate the net inhibitory effect on 3’IghRR activation. Interestingly, κB, Pax5, and Oct binding sites have been shown to positively regulate mo-hs4 and negatively regulate mo-hs1,2 in mature B cells but not in plasma cells where κB and Oct binding sites become positive regulators of mo-hs1,2 and Pax5 has no influence since its expression is down-regulated in plasma cells (50). Similarly, TCDD increased κB and DRE binding within mo-hs4 and mutational analysis identified these binding sites as positive mediators of the synergistic activation of the mo-hs4 activity by TCDD and LPS (5, 6). Since both a κB and DRE site (but not Pax5) are conserved within hu-hs1,2 and previous studies have identified a physical interaction between the AhR and NF-κB proteins (reviewed in 55, 56), we speculate these proteins may cooperatively interact to influence hu-hs1,2 activation by TCDD.
Additionally, our AhR antagonist studies strongly support a role of the AhR in the effects of TCDD on hu-hs1,2 activity; however, the lack of an influence of the IS on the fold-induction by TCDD also suggests the involvement of transcription factors identified outside of the IS (i.e. Oct, AP-1, Sp1) that are modulated by AhR. In fact TCDD and the AhR signaling pathway have been shown to alter AP-1 and Sp1 binding to either consensus sites or sites within specific transcriptional promoters (13, 45, 57–60). Additionally, Kel and co-workers have identified through in silico genomic footprinting a composite regulatory module in promoters of AhR-regulated genes that contains binding sites for the AhR as well as binding sites for several other transcription factors including a high occurrence of binding sites for Oct, AP-1/NF-1, and Sp1, suggesting transcriptional regulation that is dependent on an interaction between these transcription factors and the AhR (61). Therefore, TCDD could modulate a number of transcription factors to induce hu-hs1,2 activation. Notably, in contrast to the fold-effect by TCDD, the number of IS did reproducibly influence the magnitude of the synergistic effect induced by a co-treatment of TCDD and LPS on hu-hs1,2 activation. In addition to LPS and TCDD likely modulating a common set of transcription factors (e.g. NFκB, AP-1, Oct), another potential reason for this synergism is that cellular stimulation in general has been shown to upregulate AhR expression in the CH12.LX cells (i.e. increased AhR protein expression by 8 h) as well as primary mouse and human B cells (15, 21, 22). Perhaps the synergistic activation of hu-hs1,2 reflects increased AhR levels and therefore increased AhR activation and interactions between the AhR and other transcription factors inside and outside of the IS. Utilizing site-directed mutagenesis, current efforts are focused on elucidating the contribution of individual transcription factor binding sites within and outside the IS to basal hu-hs1,2 activity and activation induced by TCDD, LPS, or a co-treatment of LPS and TCDD.
The sensitivity of the antibody response to TCDD-induced suppression in animal models suggests that human B-cells could be a sensitive target of TCDD; however, very few studies have evaluated the effect of TCDD on human B-cell function and Ig expression. Results of these studies appear to support a variation in the magnitude of the response (i.e. altered Ig expression) of human primary tonsilar lymphocytes and primary peripheral blood B cells to TCDD with the most responsive cells demonstrating a similar sensitivity to TCDD as mouse models (62, 63). Interestingly, the actual effect of TCDD on the Ig response also varied and demonstrated an inhibitory effect in some donor cells versus no effect or an increase in the Ig response in other donor cells which may relate to differences in AhR function (63). In a different study, TCDD induced an increase in IgE production in B cells from patients with allergic rhinitis, atopic eczema/dermatitis syndrome, or bronchial asthma but not healthy controls (64). These limited studies support a complex effect of TCDD on Ig responses in human cells which likely involves the influence of many factors, including AhR function, disease states, and perhaps the hu-hs1,2 polymorphism.
The 3’ end of the Igh locus in humans is duplicated resulting in four extra constant regions and two 3’IghRR, one downstream of each α constant region (Cα1 and Cα2, respectively); and unlike the mouse, the human 3’IghRR contains only three enhancers: hs3, hs1,2, and hs4 (Fig. 1A) (34). Of the mouse and human 3’IghRR enhancers, only hu-hs1,2 contains a polymorphism which is characterized by the presence of one to four 38-bp IS’s with 14 to 20 bp spacers between the IS repeats (32, 65). The hu-hs1,2 alleles of Cα1 [i.e. α1A, α1B, α1C, and α1D (also referred to as A1, A2, A3, and A4) representing one, two, three, or four IS, respectively] have been associated with various autoimmune diseases and exist at relatively high frequencies in certain ethnic groups (66). A correlation between particular hs1,2 alleles and overall Ig levels was reported in one study in which a higher frequency of α1A was associated with lower total Ig levels and a higher frequency of α1B associated with higher total Ig levels (33). Since the only difference between the hu-hs1,2 alleles is the addition of the IS sequences containing binding sites for NF-κB, NF-1, AP-1, SP-1 and AhR, the IS and proteins binding within it would appear to be the major contributing factor in the association between the hu-hs1,2 alleles and specific disease states and total Ig levels. In the current study, a strict correlation was not consistently seen but generally an increase in IS lead to an increase in basal activity and TCDD and/or LPS-induced activity, which was further supported by deletion of the IS (α1AΔIS1 and α1BΔIS1). Differences in activity of the hu-hs1,2 alleles may have physiological relevance in that the IS-dependent increase in the overall magnitude of hu-hs1,2 activation by TCDD, LPS, and a co-treatment of LPS and TCDD (i.e. synergistic activation) may push an Ig locus over the threshold for activity. Current efforts are focused on identifying human cell lines with a functional AhR signaling pathway that can be stimulated to express Ig in order to further elucidate the mechanism by which TCDD and other AhR ligands affect the polymorphic hu-hs1,2 enhancer and Ig expression.
Many factors are likely involved in the overall effect of TCDD on human Ig expression, not all of which are likely mediated through hu-hs1,2. The current study has focused on the hs1,2 enhancer because of recent studies that have identified an association between human immune-related disorders and hu-hs1,2 polymorphisms (23–28). Our results demonstrate an AhR-dependent modulation of the hs1,2 alleles and it is becoming increasingly evident that exogenous activators of the AhR signaling pathway are not limited to TCDD or dioxin-like compounds. A diverse array of chemicals including those of dietary or therapeutic origin have been shown to have affinity for the AhR and studies have also identified indoles, tetrapyroles, and arachidonic acid metabolites as potential endogenous, albeit low affinity, ligands for the AhR (reviewed in 67, 68). With non-dioxin, low affinity AhR ligands of dietary or therapeutic origin (e.g. indolo(3,2,b)carbazole, omeprazole, primaquine) we have shown modulation of 3’IghRR activity and Ig expression (7). Consequently, human exposure to a broad range of AhR ligands, some yet to be discovered, could modulate hu-hs1,2 activity and influence the occurrence and/or severity of human diseases associated with hu-hs1,2.
ACKNOWLEDGEMENTS
We are thankful for the generous contributions from Dr. Michel Cogné for the human hs1,2 luciferase reporter plasmids, Dr. Geoffrey Haughton (in memoriam) for the CH12.LX cells, Dr. Laurel Eckhardt for the γ2b mini-locus plasmid, and Dr. Robert Roeder for the mouse hs1,2 luciferase reporter plasmid. We also greatly appreciate Dr. Laurel Eckhardt’s thorough and thought-provoking critique of this manuscript.
Abbreviations used in this paper
- AhR
aryl hydrocarbon receptor
- ARNT
AhR nuclear translocator
- CH-223191
AhR antagonist
- DRE
dioxin response element
- hu-hs1,2
human hs1,2 enhancer
- 3’IghRR
3’Igh regulatory region
- mu-hs1,2
mouse hs1,2 enhancer
- TCDD
2,3,7,8-tetracholorodibenzo-p-dioxin
- VH
variable heavy chain
Footnotes
This work was supported by funds from the National Institute of Environmental Health Sciences grant R01ES014676 and ARRA Administrative Supplement 03S2. The content is solely the responsibility of the authors and does not necessarily represent the official views of the funding organizations acknowledged above.
REFERENCES
- 1.Lieberson R, Ong J, Shi X, Eckhardt LA. Immunoglobulin gene transcription ceases upon deletion of a distant enhancer. EMBO J. 1995;14:6229–6238. doi: 10.1002/j.1460-2075.1995.tb00313.x. [DOI] [PMC free article] [PubMed] [Google Scholar]
- 2.Pinaud E, Khamlichi AA, Le Morvan C, Drouet M, Nalesso V, Le Bert M, Cogne M. Localization of the 3' IgH locus elements that effect long-distance regulation of class switch recombination. Immunity. 2001;15:187–199. doi: 10.1016/s1074-7613(01)00181-9. [DOI] [PubMed] [Google Scholar]
- 3.Vincent-Fabert C, Fiancette R, Pinaud E, Truffinet V, Cogne N, Cogne M, Denizot Y. Genomic deletion of the whole IgH 3' regulatory region (hs3a, hs1,2, hs3b, hs4) dramatically affects class switch recombination and Ig secretion to all isotypes. Blood. 2010;116:1895–1898. doi: 10.1182/blood-2010-01-264689. [DOI] [PubMed] [Google Scholar]
- 4.Sulentic CEW, Holsapple MP, Kaminski NE. Putative link between transcriptional regulation of IgM expression by 2,3,7,8-tetrachlorodibenzo-p-dioxin and the aryl hydrocarbon receptor/dioxin-responsive enhancer signaling pathway. J. Pharmacol. Exp. Ther. 2000;295:705–716. [PubMed] [Google Scholar]
- 5.Sulentic CEW, Kang JS, Na YJ, Kaminski NE. Interactions at a dioxin responsive element (DRE) and an overlapping kappaB site within the hs4 domain of the 3'alpha immunoglobulin heavy chain enhancer. Toxicology. 2004;200:235–246. doi: 10.1016/j.tox.2004.03.015. [DOI] [PubMed] [Google Scholar]
- 6.Sulentic CEW, Zhang W, Na YJ, Kaminski NE. 2,3,7,8-tetrachlorodibenzo-p-dioxin, an exogenous modulator of the 3'alpha immunoglobulin heavy chain enhancer in the CH12.LX mouse cell line. J. Pharmacol. Exp. Ther. 2004;309:71–78. doi: 10.1124/jpet.103.059493. [DOI] [PubMed] [Google Scholar]
- 7.Henseler RA, Romer EJ, Sulentic CEW. Diverse chemicals including aryl hydrocarbon receptor ligands modulate transcriptional activity of the 3'immunoglobulin heavy chain regulatory region. Toxicology. 2009;261:9–18. doi: 10.1016/j.tox.2009.03.015. [DOI] [PMC free article] [PubMed] [Google Scholar]
- 8.Birnbaum LS, Tuomisto J. Non-carcinogenic effects of TCDD in animals. Food Addit. Contam. 2000;17:275–288. doi: 10.1080/026520300283351. [DOI] [PubMed] [Google Scholar]
- 9.Sulentic CEW, Kaminski NE. The long winding road toward understanding the molecular mechanisms for B-cell suppression by 2,3,7,8-tetrachlorodibenzo-p-dioxin. Toxicol. Sci. 2011;120 Suppl 1:S171–S191. doi: 10.1093/toxsci/kfq324. [DOI] [PMC free article] [PubMed] [Google Scholar]
- 10.Swanson HI, Bradfield CA. The AH-receptor: genetics, structure and function. Pharmacogenetics. 1993;3:213–230. doi: 10.1097/00008571-199310000-00001. [DOI] [PubMed] [Google Scholar]
- 11.Okey AB, Franc MA, Moffat ID, Tijet N, Boutros PC, Korkalainen M, Tuomisto J, Pohjanvirta R. Toxicological implications of polymorphisms in receptors for xenobiotic chemicals: The case of the aryl hydrocarbon receptor. Toxicol. Appl. Pharmacol. 2005;207:43–51. doi: 10.1016/j.taap.2004.12.028. [DOI] [PubMed] [Google Scholar]
- 12.Lai ZW, Pineau T, Esser C. Identification of dioxin-responsive elements (DREs) in the 5' regions of putative dioxin-inducible genes. Chem. Biol. Interact. 1996;100:97–112. doi: 10.1016/0009-2797(96)03691-5. [DOI] [PubMed] [Google Scholar]
- 13.Schneider D, Manzan MA, Yoo BS, Crawford RB, Kaminski N. Involvement of Blimp-1 and AP-1 dysregulation in the 2,3,7,8-Tetrachlorodibenzo-p-dioxin-mediated suppression of the IgM response by B cells. Toxicol. Sci. 2009;108:377–388. doi: 10.1093/toxsci/kfp028. [DOI] [PMC free article] [PubMed] [Google Scholar]
- 14.De Abrew KN, Kaminski NE, Thomas RS. An integrated genomic analysis of aryl hydrocarbon receptor-mediated inhibition of B-cell differentiation. Toxicol. Sci. 2010;118:454–469. doi: 10.1093/toxsci/kfq265. [DOI] [PMC free article] [PubMed] [Google Scholar]
- 15.Sulentic CEW, Holsapple MP, Kaminski NE. Aryl hydrocarbon receptor-dependent suppression by 2,3,7, 8-tetrachlorodibenzo-p-dioxin of IgM secretion in activated B cells. Mol. Pharmacol. 1998;53:623–629. [PubMed] [Google Scholar]
- 16.Vorderstrasse BA, Steppan LB, Silverstone AE, Kerkvliet NI. Aryl hydrocarbon receptor-deficient mice generate normal immune responses to model antigens and are resistant to TCDD-induced immune suppression. Toxicol. Appl. Pharmacol. 2001;171:157–164. doi: 10.1006/taap.2000.9122. [DOI] [PubMed] [Google Scholar]
- 17.Yoo BS, Boverhof DR, Shnaider D, Crawford RB, Zacharewski TR, Kaminski NE. 2,3,7,8-Tetrachlorodibenzo-p-dioxin (TCDD) alters the regulation of Pax5 in lipopolysaccharide-activated B cells. Toxicol. Sci. 2004;77:272–279. doi: 10.1093/toxsci/kfh013. [DOI] [PubMed] [Google Scholar]
- 18.Schneider D, Manzan MA, Crawford RB, Chen W, Kaminski NE. 2,3,7,8-Tetrachlorodibenzo-p-dioxin-mediated impairment of B cell differentiation involves dysregulation of paired box 5 (Pax5) isoform, Pax5a. J. Pharmacol. Exp. Ther. 2008;326:463–474. doi: 10.1124/jpet.108.139857. [DOI] [PMC free article] [PubMed] [Google Scholar]
- 19.Wourms MJ, Sulentic CEW. Evidence of AhR-dependent suppression of immunoglobulin expression. Toxicol. Sci., Toxicologist. 2011;120:1121. [Google Scholar]
- 20.Salisbury RL, Sulentic CEW. NF-κB/Rel and the AhR in modulating the 3'IghRR. Toxicol. Sci., Toxicologist. 2011;120:1125. [Google Scholar]
- 21.Marcus RS, Holsapple MP, Kaminski NE. Lipopolysaccharide activation of murine splenocytes and splenic B cells increased the expression of aryl hydrocarbon receptor and aryl hydrocarbon receptor nuclear translocator. J. Pharmacol. Exp. Ther. 1998;287:1113–1118. [PubMed] [Google Scholar]
- 22.Allan LL, Sherr DH. Constitutive activation and environmental chemical induction of the aryl hydrocarbon receptor/transcription factor in activated human B lymphocytes. Mol. Pharmacol. 2005;67:1740–1750. doi: 10.1124/mol.104.009100. [DOI] [PubMed] [Google Scholar]
- 23.Aupetit C, Drouet M, Pinaud E, Denizot Y, Aldigier JC, Bridoux F, Cogne M. Alleles of the alpha1 immunoglobulin gene 3' enhancer control evolution of IgA nephropathy toward renal failure. Kidney Int. 2000;58:966–971. doi: 10.1046/j.1523-1755.2000.00253.x. [DOI] [PubMed] [Google Scholar]
- 24.Frezza D, Giambra V, Cianci R, Fruscalzo A, Giufre M, Cammarota G, Martinez-Labarga C, Rickards O, Scibilia G, Sferlazzas C, Bartolozzi F, Starnino S, Magazzu G, Gasbarrini GB, Pandolfi F. Increased frequency of the immunoglobulin enhancer HS1,2 allele 2 in coeliac disease. Scand. J. Gastroenterol. 2004;39:1083–1087. doi: 10.1080/00365520410007999. [DOI] [PubMed] [Google Scholar]
- 25.Wang J, Boxer LM. Regulatory elements in the immunoglobulin heavy chain gene 3'-enhancers induce c-myc deregulation and lymphomagenesis in murine B cells. J. Biol. Chem. 2005;280:12766–12773. doi: 10.1074/jbc.M412446200. [DOI] [PubMed] [Google Scholar]
- 26.Frezza D, Giambra V, Tolusso B, De Santis M, Bosello S, Vettori S, Triolo G, Valentini G, Ferraccioli G. Polymorphism of immunoglobulin enhancer element HS1,2A: allele *2 associates with systemic sclerosis. Comparison with HLA-DR and DQ allele frequency. Ann. Rheum. Dis. 2007;66:1210–1215. doi: 10.1136/ard.2006.066597. [DOI] [PMC free article] [PubMed] [Google Scholar]
- 27.Cianci R, Giambra V, Mattioli C, Esposito M, Cammarota G, Scibilia G, Magazzu G, Orlando A, Sandri G, Bianchi L, Gasbarrini GB, Pandolfi F, Frezza D. Increased frequency of Ig heavy-chain HS1,2-A enhancer *2 allele in dermatitis herpetiformis, plaque psoriasis, psoriatic arthritis. J. Invest. Dermatol. 2008;128:1920–1924. doi: 10.1038/jid.2008.40. [DOI] [PubMed] [Google Scholar]
- 28.Tolusso B, Frezza D, Mattioli C, Fedele AL, Bosello S, Faustini F, Peluso G, Giambra V, Pietrapertosa D, Morelli A, Gremese E, De Santis M, Ferraccioli GF. Allele *2 of the HS1,2A enhancer of the Ig regulatory region associates with rheumatoid arthritis. Ann. Rheum. Dis. 2009;68:416–419. doi: 10.1136/ard.2008.095414. [DOI] [PMC free article] [PubMed] [Google Scholar]
- 29.Denizot Y, Pinaud E, Aupetit C, Le Morvan C, Magnoux E, Aldigier JC, Cogne M. Polymorphism of the human alpha1 immunoglobulin gene 3' enhancer hs1,2 and its relation to gene expression. Immunology. 2001;103:35–40. doi: 10.1046/j.1365-2567.2001.01217.x. [DOI] [PMC free article] [PubMed] [Google Scholar]
- 30.Chen C, Birshtein BK. Virtually identical enhancers containing a segment of homology to murine 3'IgH-E(hs1,2) lie downstream of human Ig C alpha 1 and C alpha 2 genes. J. Immunol. 1997;159:1310–1318. [PubMed] [Google Scholar]
- 31.Pinaud E, Aupetit C, Chauveau C, Cogne M. Identification of a homolog of the C alpha 3'/hs3 enhancer and of an allelic variant of the 3'IgH/hs1,2 enhancer downstream of the human immunoglobulin alpha 1 gene. Eur. J. Immunol. 1997;27:2981–2985. doi: 10.1002/eji.1830271134. [DOI] [PubMed] [Google Scholar]
- 32.Giambra V, Fruscalzo A, Giufre M, Martinez-Labarga C, Favaro M, Rocchi M, Frezza D. Evolution of human IgH3'EC duplicated structures: both enhancers HS1,2 are polymorphic with variation of transcription factor's consensus sites. Gene. 2005;346:105–114. doi: 10.1016/j.gene.2004.10.009. [DOI] [PubMed] [Google Scholar]
- 33.Frezza D, Giambra V, Mattioli C, Piccoli K, Massoud R, Siracusano A, Di Giannantonio M, Birshtein BK, Rubino IA. Allelic frequencies of 3' Ig heavy chain locus enhancer HS1,2-A associated with Ig levels in patients with schizophrenia. Int. J. Immunopathol. Pharmacol. 2009;22:115–123. doi: 10.1177/039463200902200113. [DOI] [PMC free article] [PubMed] [Google Scholar]
- 34.Mills FC, Harindranath N, Mitchell M, Max EE. Enhancer complexes located downstream of both human immunoglobulin Calpha genes. J. Exp. Med. 1997;186:845–858. doi: 10.1084/jem.186.6.845. [DOI] [PMC free article] [PubMed] [Google Scholar]
- 35.Kim SH, Henry EC, Kim DK, Kim YH, Shin KJ, Han MS, Lee TG, Kang JK, Gasiewicz TA, Ryu SH, Suh PG. Novel compound 2-methyl-2H-pyrazole-3-carboxylic acid (2-methyl-4-o-tolylazo-phenyl)-amide (CH-223191) prevents 2,3,7,8-TCDD-induced toxicity by antagonizing the aryl hydrocarbon receptor. Mol. Pharmacol. 2006;69:1871–1878. doi: 10.1124/mol.105.021832. [DOI] [PubMed] [Google Scholar]
- 36.Arnold LW, LoCascio NJ, Lutz PM, Pennell CA, Klapper D, Haughton G. Antigen-induced lymphomagenesis: identification of a murine B cell lymphoma with known antigen specificity. J. Immunol. 1983;131:2064–2068. [PubMed] [Google Scholar]
- 37.Bishop GA, Haughton G. Induced differentiation of a transformed clone of Ly-1+ B cells by clonal T cells and antigen. Proc. Natl. Acad. Sci. USA. 1986;83:7410–7414. doi: 10.1073/pnas.83.19.7410. [DOI] [PMC free article] [PubMed] [Google Scholar]
- 38.Williams CE, Crawford RB, Holsapple MP, Kaminski NE. Identification of functional aryl hydrocarbon receptor and aryl hydrocarbon receptor nuclear translocator in murine splenocytes. Biochem. Pharmacol. 1996;52:771–780. doi: 10.1016/0006-2952(96)00360-7. [DOI] [PubMed] [Google Scholar]
- 39.Whitmore AC, Prowse DM, Arnold LW, Haughton G. Ig isotype switching in B lymphocytes. A method for estimating isotype switch frequency in cloned B cell lymphomas. Int. Immunol. 1989;1:532–539. doi: 10.1093/intimm/1.5.532. [DOI] [PubMed] [Google Scholar]
- 40.Shi X, Eckhardt LA. Deletional analyses reveal an essential role for the hs3b/hs4 IgH 3' enhancer pair in an Ig-secreting but not an earlier-stage B cell line. Int. Immunol. 2001;13:1003–1012. doi: 10.1093/intimm/13.8.1003. [DOI] [PubMed] [Google Scholar]
- 41.Masten SA, Shiverick KT. The Ah receptor recognizes DNA binding sites for the B cell transcription factor, BSAP: a possible mechanism for dioxin-mediated alteration of CD19 gene expression in human B lymphocytes. Biochem. Biophys. Res. Commun. 1995;212:27–34. doi: 10.1006/bbrc.1995.1931. [DOI] [PubMed] [Google Scholar]
- 42.Romer EJ, Sulentic CEW. Hydrogen peroxide modulates immunoglobulin expression by targeting the 3'Igh regulatory region through an NFkappaB-dependent mechanism. Free Radic. Res. 2011;45:796–809. doi: 10.3109/10715762.2011.581280. [DOI] [PMC free article] [PubMed] [Google Scholar]
- 43.Stevens S, Ong J, Kim U, Eckhardt LA, Roeder RG. Role of OCA-B in 3'-IgH enhancer function. J. Immunol. 2000;164:5306–5312. doi: 10.4049/jimmunol.164.10.5306. [DOI] [PubMed] [Google Scholar]
- 44.Ong J, Stevens S, Roeder RG, Eckhardt LA. 3' IgH enhancer elements shift synergistic interactions during B cell development. J. Immunol. 1998;160:4896–4903. [PubMed] [Google Scholar]
- 45.Suh J, Jeon YJ, Kim HM, Kang JS, Kaminski NE, Yang KH. Aryl hydrocarbon receptor-dependent inhibition of AP-1 activity by 2,3,7,8-tetrachlorodibenzo-p-dioxin in activated B cells. Toxicol. Appl. Pharmacol. 2002;181:116–123. doi: 10.1006/taap.2002.9403. [DOI] [PubMed] [Google Scholar]
- 46.Busslinger M, Urbanek P. The role of BSAP (Pax-5) in B-cell development. Curr. Opin. Genet. Dev. 1995;5:595–601. doi: 10.1016/0959-437x(95)80028-x. [DOI] [PubMed] [Google Scholar]
- 47.Cobaleda Cs, Schebesta A, Delogu A, Busslinger M. Pax5: the guardian of B cell identity and function. Nat. Immunol. 2007;8:463–470. doi: 10.1038/ni1454. [DOI] [PubMed] [Google Scholar]
- 48.Neurath MF, Strober W, Wakatsuki Y. The murine Ig 3' alpha enhancer is a target site with repressor function for the B cell lineage-specific transcription factor BSAP (NF-HB, S alpha-BP) J. Immunol. 1994;153:730–742. [PubMed] [Google Scholar]
- 49.Neurath MF, Max EE, Strober W. Pax5 (BSAP) regulates the murine immunoglobulin 3' alpha enhancer by suppressing binding of NF-alpha P, a protein that controls heavy chain transcription. Proc. Natl. Acad. Sci. USA. 1995;92:5336–5340. doi: 10.1073/pnas.92.12.5336. [DOI] [PMC free article] [PubMed] [Google Scholar]
- 50.Michaelson JS, Singh M, Snapper CM, Sha WC, Baltimore D, Birshtein BK. Regulation of 3' IgH enhancers by a common set of factors, including kappa B-binding proteins. J. Immunol. 1996;156:2828–2839. [PubMed] [Google Scholar]
- 51.Linderson Y, Eberhard D, Malin S, Johansson A, Busslinger M, Pettersson S. Corecruitment of the Grg4 repressor by PU.1 is critical for Pax5-mediated repression of B-cell-specific genes. EMBO Rep. 2004;5:291–296. doi: 10.1038/sj.embor.7400089. [DOI] [PMC free article] [PubMed] [Google Scholar]
- 52.Barberis A, Widenhorn K, Vitelli L, Busslinger M. A novel B-cell lineage-specific transcription factor present at early but not late stages of differentiation. Genes Dev. 1990;4:849–859. doi: 10.1101/gad.4.5.849. [DOI] [PubMed] [Google Scholar]
- 53.Holmes ML, Pridans C, Nutt SL. The regulation of the B-cell gene expression programme by Pax5. Immunol. Cell Biol. 2008;86:47–53. doi: 10.1038/sj.icb.7100134. [DOI] [PubMed] [Google Scholar]
- 54.Sepulveda MA, Emelyanov AV, Birshtein BK. NF-kappa B and Oct-2 synergize to activate the human 3' Igh hs4 enhancer in B cells. J. Immunol. 2004;172:1054–1064. doi: 10.4049/jimmunol.172.2.1054. [DOI] [PubMed] [Google Scholar]
- 55.Tian Y, Rabson AB, Gallo MA. Ah receptor and NF-kappaB interactions: mechanisms and physiological implications. Chem. Biol. Interact. 2002;141:97–115. doi: 10.1016/s0009-2797(02)00068-6. [DOI] [PubMed] [Google Scholar]
- 56.Tian Y. Ah receptor and NF-kappaB interplay on the stage of epigenome. Biochem. Pharmacol. 2009;77:670–680. doi: 10.1016/j.bcp.2008.10.023. [DOI] [PubMed] [Google Scholar]
- 57.Khan S, Barhoumi R, Burghardt R, Liu S, Kim K, Safe S. Molecular mechanism of inhibitory aryl hydrocarbon receptor-estrogen receptor/Sp1 cross talk in breast cancer cells. Mol. Endocrinol. 2006;20:2199–2214. doi: 10.1210/me.2006-0100. [DOI] [PubMed] [Google Scholar]
- 58.Wang F, Wang W, Safe S. Regulation of constitutive gene expression through interactions of Sp1 protein with the nuclear aryl hydrocarbon receptor complex. Biochemistry. 1999;38:11490–11500. doi: 10.1021/bi982578f. [DOI] [PubMed] [Google Scholar]
- 59.Puga A, Barnes SJ, Chang C, Zhu H, Nephew KP, Khan SA, Shertzer HG. Activation of transcription factors activator protein-1 and nuclear factor-kappaB by 2,3,7,8-tetrachlorodibenzo-p-dioxin. Biochem. Pharmacol. 2000;59:997–1005. doi: 10.1016/s0006-2952(99)00406-2. [DOI] [PubMed] [Google Scholar]
- 60.Hoffer A, Chang CY, Puga A. Dioxin induces transcription of fos and jun genes by Ah receptor-dependent and -independent pathways. Toxicol. Appl. Pharmacol. 1996;141:238–247. doi: 10.1006/taap.1996.0280. [DOI] [PubMed] [Google Scholar]
- 61.Kel A, Reymann S, Matys V, Nettesheim P, Wingender E, Borlak J. A novel computational approach for the prediction of networked transcription factors of aryl hydrocarbon-receptor-regulated genes. Mol. Pharmacol. 2004;66:1557–1572. doi: 10.1124/mol.104.001677. [DOI] [PubMed] [Google Scholar]
- 62.Wood SC, Jeong HG, Morris DL, Holsapple MP. Direct effects of 2,3,7,8-tetrachlorodibenzo-p-dioxin (TCDD) on human tonsillar lymphocytes. Toxicology. 1993;81:131–143. doi: 10.1016/0300-483x(93)90005-d. [DOI] [PubMed] [Google Scholar]
- 63.Lu H, Crawford RB, Suarez-Martinez JE, Kaplan BL, Kaminski NE. Induction of the aryl hydrocarbon receptor-responsive genes and modulation of the immunoglobulin M response by 2,3,7,8-tetrachlorodibenzo-p-dioxin in primary human B cells. Toxicol. Sci. 2010;118:86–97. doi: 10.1093/toxsci/kfq234. [DOI] [PMC free article] [PubMed] [Google Scholar]
- 64.Kimata H. 2,3,7,8-tetrachlorodibenzo-p-dioxin selectively enhances spontaneous IgE production in B cells from atopic patients. Int. J. Hyg. Environ. Health. 2003;206:601–604. doi: 10.1078/1438-4639-00248. [DOI] [PubMed] [Google Scholar]
- 65.Guglielmi L, Truffinet V, Magnoux E, Cogne M, Denizot Y. The polymorphism of the locus control region lying downstream the human IgH locus is restricted to hs1,2 but not to hs3 and hs4 enhancers. Immunol. Lett. 2004;94:77–81. doi: 10.1016/j.imlet.2004.04.003. [DOI] [PubMed] [Google Scholar]
- 66.Giambra V, Martinez-Labarga C, Giufre M, Modiano D, Simpore J, Gisladottir BK, Francavilla R, Zhelezova G, Kilic SS, Crawford M, Biondi G, Rickards O, Frezza D. Immunoglobulin enhancer HS1,2 polymorphism: a new powerful anthropogenetic marker. Ann. Hum. Genet. 2006;70:946–950. doi: 10.1111/j.1469-1809.2006.00273.x. [DOI] [PubMed] [Google Scholar]
- 67.Denison MS, Nagy SR. Activation of the aryl hydrocarbon receptor by structurally diverse exogenous and endogenous chemicals. Annu. Rev. Pharmacol. Toxicol. 2003;43:309–334. doi: 10.1146/annurev.pharmtox.43.100901.135828. [DOI] [PubMed] [Google Scholar]
- 68.Nguyen LP, Bradfield CA. The Search for Endogenous Activators of the Aryl Hydrocarbon Receptor. Chem. Res. Toxicol. 2007;21:102–116. doi: 10.1021/tx7001965. [DOI] [PMC free article] [PubMed] [Google Scholar]
- 69.Chauveau C, Cogne M. Palindromic structure of the IgH 3'locus control region. Nat. Genet. 1996;14:15–16. doi: 10.1038/ng0996-15. [DOI] [PubMed] [Google Scholar]