Abstract
Acoustic radiation force impulse (ARFI) imaging has been developed as a non-invasive method for quantitative illustration of tissue stiffness or displacement. Conventional ARFI imaging (2–10 MHz) has been implemented in commercial scanners for illustrating elastic properties of several organs. The image resolution, however, is too coarse to study mechanical properties of micro-sized objects such as cells. This article thus presents a high-frequency coded excitation ARFI technique, with the ultimate goal of displaying elastic characteristics of cellular structures. Tissue mimicking phantoms and zebrafish embryos are imaged with a 100-MHz lithium niobate (LiNbO3) transducer, by cross-correlating tracked RF echoes with the reference. The phantom results show that the contrast of ARFI image (14 dB) with coded excitation is better than that of the conventional ARFI image (9 dB). The depths of penetration are 2.6 and 2.2 mm, respectively. The stiffness data of the zebrafish demonstrate that the envelope is harder than the embryo region. The temporal displacement change at the embryo and the chorion is as large as 36 and 3.6 μm. Consequently, this high-frequency ARFI approach may serve as a remote palpation imaging tool that reveals viscoelastic properties of small biological samples.
Keywords: Ultrasound transducer, Tissue stiffness, Displacement, Cross-correlation estimation
INTRODUCTION
New methods for evaluating viscoelastic properties of cells and development of new theories for modeling mechanics of cells are crucial for a better understanding of the complex responses of cells upon mechanical stimulation. A number of experimental techniques7 including magnetic twisting forces induced on magnetic beads, optical trapping, and atomic force microscopy have been developed to satisfy this need. Ultrasound elastography10 is a more recent ultrasound imaging approach for non-invasive quantitative mapping of tissue elastic properties, which is achieved by assessing the induced strain produced by the force from an ultrasound beam or an external device. Vibroacoustography3 is somewhat different in that two confocally focused beams of slightly different frequencies are interfered at a point of an object of interest. The emitted acoustic signal at the beat frequency (difference in frequency of the two signals) carries information about the elastic properties of the tissue.
Acoustic radiation force impulse (ARFI) imaging9 is another version of ultrasound elastography where the force is exerted by an ultrasound beam transmitted remotely. Acoustic radiation force generated by an ultrasound beam, acting like a remote palpation, is induced by a series of tone bursts in the frequency range of 2–10 MHz, and leads to localized displacements within a tissue on the order of tens of micrometers. Such displacements inversely proportional to tissue stiffness are tracked by estimating cross-correlations of scattered signals, and a parametric image is rendered consequently. AFRI imaging has thus been shown to be capable of mapping the distribution of tissue mechanical properties that are not attainable with conventional B-mode imaging. In the early 1990s, Sugimoto et al.13 first proposed an idea to evaluate material properties by monitoring its dynamic response to acoustic radiation forces, and Dymling et al.1 used the concept to measure the viscosity of a fluid medium. The ARFI method has further been developed to monitor the viscoelastic properties of in vivo cysts8 and vitreous humor,15 chemical and thermal ablations in vivo,2 and blood clot formation in vitro.14
Mechanical properties of microscopic structures such as cells can be probed by increasing the operating frequency of ARFI sequences because of its enhanced spatial resolution. At 100 MHz or 1 GHz, for instance, the axial resolution approaches 15 or 1.5 lm respectively, nearly the same dimension as cellular structures. Hence, this article describes the development of the current ARFI technique for higher-frequency applications, yielding displacement maps of zebrafish embryos. A 100-MHz single-element lithium niobate (LiNbO3) transducer is used to mechanically scan an embryo at a developmental stage (or blastula). A chirp-coded excitation sequence is transmitted to the embryo as the tracking beam to enhance the depth of penetration and the contrast, while a burst sequence is employed to remotely disturb it with acoustic radiation force. The displacement caused by the pushing force is determined by cross-correlating the received RF echoes with the reference. Along with embryos, a tissue-mimicking phantom is also synthesized to quantitatively compare the proposed ARFI performance with that of conventional burst sequence about the two aforementioned factors.
Principle of Conventional ARFI Imaging
Acoustic radiation force impulse images are formed by displaying tissue displacements in response to external mechanical stress, and three types of pulse sequences are needed for making such images. At each lateral position, a reference pulse is first sent to the tissue and used to determine its initial location. A pushing pulse is subsequently applied, exerting the acoustic radiation force on the tissue to cause localized displacements. A tracking pulse is emitted to detect the tissue's response to the force. At each lateral position, the displacement along the beam path can be computed by correlation-based estimation techniques between the tracking RF lines and the reference signal. The above pulse sequences are repeated over the adjacent beam locations after the tissue recovers from ARFI excitation. A two-dimensional (2D) image is constructed within a certain region of interest (ROI). Several additional parameters including the time to reach peak displacement, and the tissue recovery time to its original state can also be displayed to illustrate the tissue hardness.12
MATERIALS AND METHODS
High-frequency Transducer
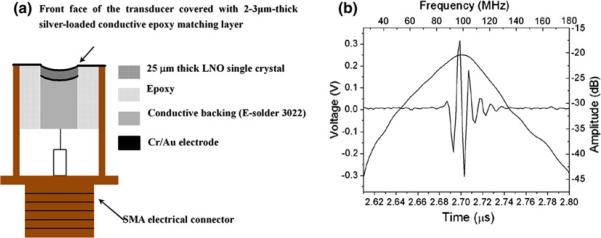
A self-focused single element LiNbO3 transducer is employed to carry out ARFI imaging, and the schematic is shown in Fig. 1a. A 36° rotated Y-cut LiNbO3 wafer (Boston Piezo-optics, Bellingham, MA) is lapped down from 400 to 25 μm in thickness to obtain a resonant frequency at 100 MHz. 50/100-nm chrome gold (Cr/Au) electrodes are sputtered on both sides of the wafer. A λ/4 silver epoxy-matching layer made from mixture of three parts 0.5–1.0 μm silver particles (Aldrich Chem. Co., Milwaukee, WI) and 1.25 parts Insulcast 501 epoxy (American Safety Technologies, Roseland, NJ) is cast onto the negative electrode along with an adhesion promoter (Chemlok AP-131, Lord Corp., Erie, PA).
FIGURE 1.
Illustration of (a) 100-MHz transducer and (b) its pulse echo response.
Subsequently, it is centrifuged at 2000×g for 10 min to ensure its good electrical conductivity and increase in acoustic impedance. After curing at room temperature overnight, the matching layer is lapped down to around λ/4 thickness. A conductive epoxy E-Solder 3022 (Von Roll Isola Inc., New Haven, CT) is cast on the other side of the electrode, serving as an acoustically lossy backing material (~1 mm in thickness) that also supports the fragile crystal film during machining/dicing. A square-shaped acoustic stack is then cut out with the dimension of 1.3 mm × 1.3 mm and mounted in an SMA electrical connector. The stack is press-focused by a chrome ball bearing at ~75 °C where the epoxy backing undergoes a glass transition, resulting in a geometrical focus at 2 mm.
The measured pulse echo waveform and frequency spectrum of the transducer are given in Fig. 1b. The transducer's center frequency is 96 MHz, and its −6-dB fractional bandwidth is 56%. Both the depth of focus and the beam width (BW) at the focus are 16 and 30 μm, determined by the point spread function of a 6 μm-diameter tungsten wire target.
Imaging Sequence and System Implementation
Hanning-windowed chirp-coded excitations, given by the equation below, are employed as tracking beams (including the reference beam) to enhance the contrast and the depth of penetration in acquired images.
| (1) |
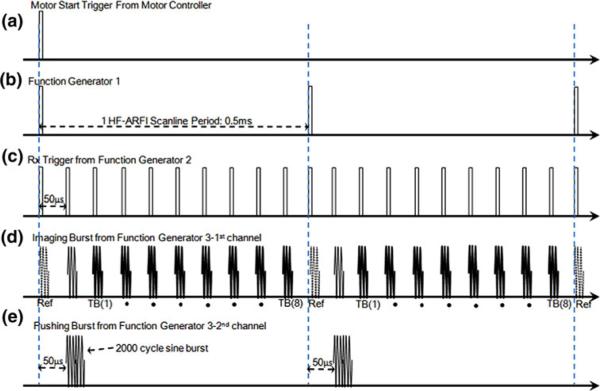
where fi is the lowest frequency of a chirp, α the rate of frequency increment per second, and WHanning Hanning window function. In this study, the chirp signal sweeps the frequency range from 45 to 135 MHz for 1 μs. The reference beam detecting the initial position of a target (t = 0) is followed by a pushing beam that consists of 2000 cycles of 90-MHz sinusoidal burst at t = 50 μs. A series of eight chirp signals that measure the target's displacement are then transmitted as tracking beams, each separated 50 μs apart, starting at t = 100 μs. The above sequence is repeated to obtain each scan line in coded excitation ARFI images. Both pushing and tracking beams are excited at the pulse repetition frequency (PRF) of 20 kHz, and the number of scan lines is 2000. In order to compare this ARFI imaging sequence with conventional burst imaging sequence, 3-cycle sinusoidal bursts are also used as tracking beams in separate experiments. Note that the results obtained from both cases are compared later in the “Results” section.
The transducer successively transmits the pushing and the tracking beams, mechanically scanning a target at the focus perpendicularly to the beam propagation. For displacement estimation at a certain location, therefore, the distance between the reference and the last tracking beam should be maintained to be less than the half of the BW. The relation between the PRF and the number of tracking beams (NTB), in particular, is expressed by
| (2) |
where TD and MS are the transducer's traveling distance and its scanning speed (= 10 mm/s in this case), respectively. The maximum TD, according to Eq. (2), leads to 15 μm, and thus the allowed acquisition time is as long as 1.5 ms per each scan line.
Figures 2 and 3 illustrate the block diagram of ARFI imaging system based on coded excitation sequence and the detailed imaging sequence. When the transducer starts to laterally scan a target, a rectangular pulse from the motor controller (Fig. 3a) immediately triggers Function Generators #1 and #2 (FG#1 and FG#2, 33250A, Agilent, USA) (Figs. 3b, 3c). FG#1 then sends out 200 pulses at 2 kHz to a two channel Function Generator #3 (FG#3, AFG3252, Tektronix, USA). Each channel in FG#3 simultaneously transmits either eight tracking beams with a PRF of 20 kHz (Fig. 3d, dotted lines: reference beams, solid lines: tracking beams) or one pushing beam after 50 μs delay (Fig. 3e). Note that individual waveforms used for tracking and pushing sequences are synthesized from MATLAB (R2010b, MathWorks, USA) and imported into FG#3 in advance. The channel outputs are amplified by a custom-built power amplifier gain of which is 26 dB, subsequently input to the transducer. An analog pulser/receiver (5900PR, Pana-metrics, USA) synchronized by the trigger trains from FG#2 is employed to amplify and filter received RF echoes from the transducer as analog signals. Those echoes are then digitized by an analog-to-digital converter (ADC) (CS12400, Gage Applied Technologies, USA). The sampling rate of the ADC is 400 MHz satisfying the Nyquist theorem, four times as high as the center frequency of the transducer used in this study.
FIGURE 2.
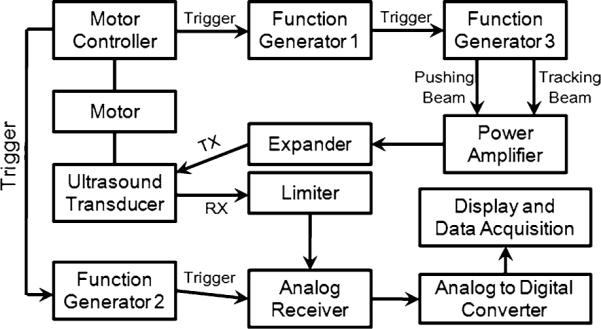
Diagram of coded excitation ARFI system. TX and RX denote transmission and reception, respectively.
FIGURE 3.
Coded excitation ARFI sequence. (a) A rectangular pulse from the motor controller. (b, c) Triggered signals from Function Generators #1 and #2. (d) eight tracking beams with a PRF of 20 kHz from FG#3 or (e) one pushing beam after 50 μs delay.
Phantom Synthesis
In order to evaluate the performance of ARFI imaging, a tissue-mimicking phantom is made with a mixture of gelatin and graphite powder, consisting of five rectangular bar-shaped inclusions embedded in a background substrate. Each inclusion has a size of 1 mm × 1 mm × 10 mm, placed 0.5 mm apart as illustrated in Fig. 4. Note that a previous technique for elastic phantom synthesis5 is adopted here. Young's modulus for the inclusions and the background is determined by the composite ratio of materials used. The designed moduli of the inclusion and the substrate are 15.1 and 0.7 kPa, respectively.
FIGURE 4.
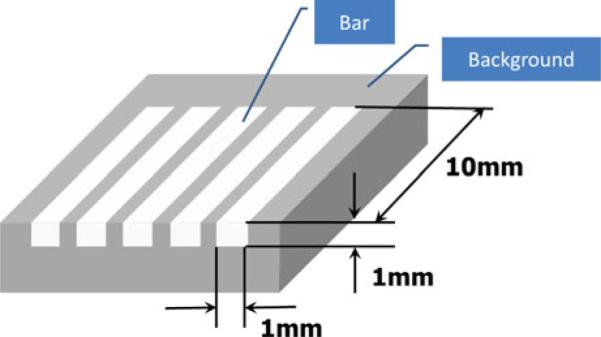
Geometry of a tissue mimicking phantom for test study.
Agar gel powder (Agar A360–500, Fisher Scientific, USA) is hydrated by adding deionized water and n-propanol. The solution is slowly stirred to avoid clumps and subsequently degassed in a vacuum (660–730 mmHg) for a few minutes. After being further stirred to prevent a thin film formation on surface, the hydrated mixture is heated initially at 70 °C in water for colloid dispersion and gas release, and its temperature is increased to 90 °C later on. The liquid mixture is then quickly vacuumed to remove residual air bubbles. Graphite powder (Silicon dioxide, Sigma-Aldrich, USA) particle size of between 0.5 and 10 μm is added to the mixture for echogenic enhancement. The mixture is rotated for obtaining homogeneous gelation and cooled down to 45 °C for cross-linking, before being poured into the mold to produce a gelatin phantom.
Preparation of Zebrafish Embryo
Wild-type embryos are collected by pouring the water from a mating tank through a fine mesh sieve, and transferred into petri dishes in E3 (mixed with 5 mM NaCl, 0.17 mM KCl, 0.33 mM CaCl2, 0.33 mM MgSO4, and 0.00001% (w/v) Methylene Blue) medium. A harvested embryo, kept in an incubator at 28 °C, is then placed into ultrasound coupling gel (Aquasonic 100, Parker, USA) on a steel plate, before being immersed into deionized and degassed water. Finally, the embryo is positioned at the transducer's focus.
RESULTS
The acquired RF data are upsampled to 4 GHz by exploiting simple polynomial interpolation filters with symmetric coefficients6 to quantify the internal displacement of a target induced by acoustic radiation forces. The minimum displacement estimate is thus 0.19 μm. The cross-correlation between RF signals detected by the reference and each tracking beam is carried out within 6λ-long segments (= 86 μm). The corresponding displacement is determined by locating the peak correlation value in each segment. A threshold of 0.8 in the correlation coefficient is applied to avoid inaccurate displacement estimates. The maximum TD between two ARFI scan lines is 5 μm. The resultant jitter caused by the transducer motion is 6 nm at the focus (2 mm), which is negligible compared to the minimum measurable displacement.
Phantom Experiment
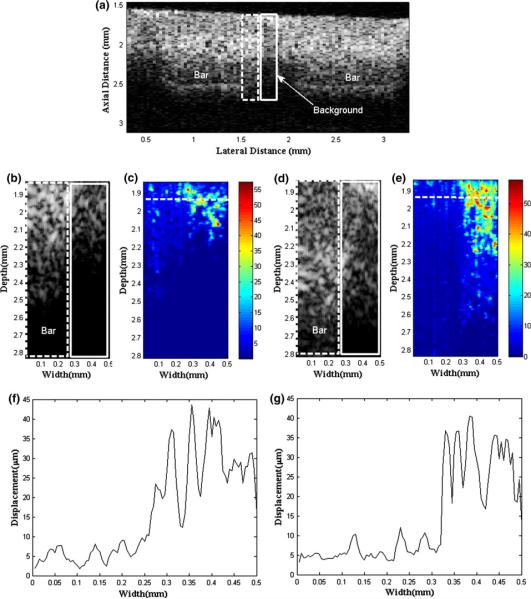
A junction between two 1 cm × 1 cm bar inclusions is displayed in the B-mode reference image using a 90-MHz three-cycle burst sequence, hardly distinguishable from its background substrate shown in Fig. 5a. Using chirp-coded excitation as the tracking beam, such ARFI and B-mode images are compared with those obtained by existing burst ARFI sequence to emphasize the enhancement in terms of contrast and depth of penetration. For such a comparison, hence, the images are acquired only from a region consisting of half a bar (dotted box) and the background (solid box). Figures 5b and 5c show B-mode and displacement map for the conventional ARFIs corresponding to the region, whereas Figs. 5d and 5e are for the coded excitation ARFIs. Note that the color bar represents the displacement scale in μm. The displacement along a horizontal dotted line in Figs. 5c and 5e is found to be as large as 55 μm and becomes smaller beyond the focal zone. This is expected because the acoustic radiation force that acted on the phantom tends to become weaker away from the focus. In particular, an abrupt increase in displacement across the inclusion and the background (Figs. 5f, 5g) indicates the existence of a junction resulting from the different elastic moduli, further implying that the inclusion (15.1 kPa) is of a harder material than the background (0.7 kPa). To quantitatively compare the performance of the conventional and coded excitation ARFI images, the depth of penetration and the contrast are computed by an image analysis software (ImageJ, National Institutes of Health, USA). Here, the contrast is defined by the difference in pixel brightness between the bar and the substrate images at the focus,11 and the depth of penetration represents an axial length where the defined contrast drops under 6 dB from its peak value. The results show that the use of coded excitation yields greater depth of penetration and contrast (2.6 mm, 14 dB) than those of the conventional ARFI images (2.2 mm, 9 dB), as shown in Figs. 5c and 5e. In order to increase the depth of penetration, increased input amplitude to the transducer may readily be employed but often causes serious heating or damage to biological specimens. By increasing the excitation signal duration, instead, coded excitations applied to tracking beams increase the total transmitted energy and yet minimize the transmitted peak power, resulting in enhanced signal-to-noise ratio (SNR) or sensitivity. Hence, the coded excitation yields both greater depth of penetration and contrast at depths where it would normally be difficult to image, than the conventional ARFI images.
FIGURE 5.
Comparison between conventional and coded excitation ARFI images. (a) B-mode reference data showing the phantom structure. (b) B-mode and (c) existing ARFI data are obtained for a boxed area in (a). (d) B-mode and (e) ARFI images with coded excitation sequence are shown. Displacement profiles along a dotted line in (c, e) are estimated for (f) the burst and (g) the coded excitation, respectively.
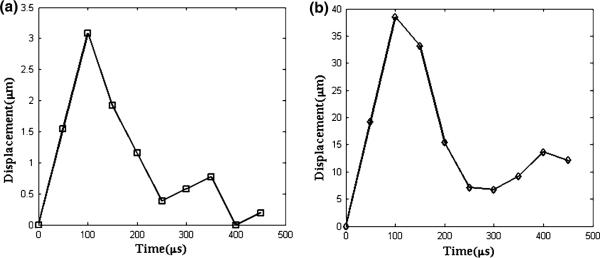
The displacement change at the focus is measured for coded excitation ARFIs, and plotted as a function of time in Fig. 6. The cross-correlation between the reference and the 8th tracking beam finds that the peak displacement in the hard region (3 μm, Fig. 6a) is 13 times lower than in the soft area (39 μm, Fig. 6b). At t = 400 μs, furthermore, the palpated target in the hard region (bar inclusion) returns to the original position, whereas it still moves toward its initial location in the soft region (background) as being displaced by 15 μm at that moment.
FIGURE 6.
Transient response of displacement to applied force for (a) hard (bar inclusion) and (b) soft (background) regions in the phantom.
Coded Excitation ARFI Imaging of Zebrafish Embryo
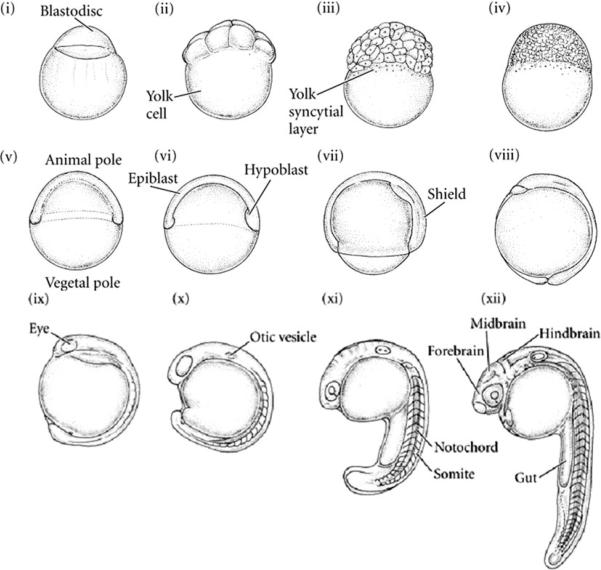
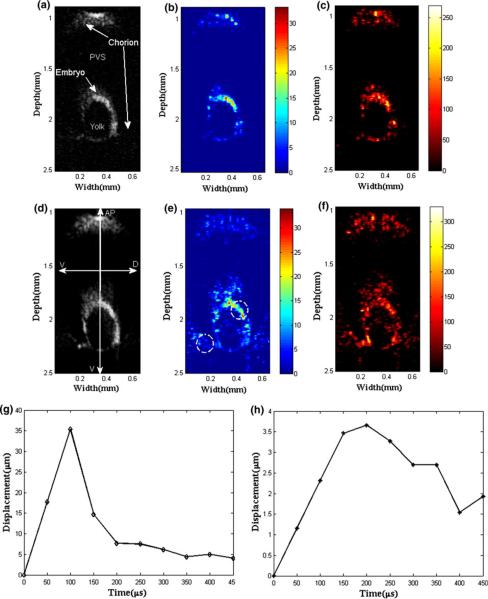
A zebrafish embryo reaches the late blastula stage approximately 5 h after fertilization. In this experiment, most embryonic cells undergo epiboly, a process in which thinning blastula spreads around the yolk cell. An example image during embryogenesis4 is given in Fig. 7, particularly indicating the blastula stage (v)–(vi). After displacement estimation, parametric images that represent the elastic properties are obtained and shown in Fig. 8 along with the corresponding B-mode image. Those images outline its anatomical structures such as chorion envelope, perivitelline space (PVS), and embryo surrounding the yolk. The B-mode image (Fig. 8a), the stiffness (or displacement) distribution (Fig. 8b), and the time (μs) taken to reach peak displacement (Fig. 8c) are given for the conventional ARFI. The same set of data is also acquired by the coded excitation sequence (Figs. 8d–8f).
FIGURE 7.
Illustration of developmental stage of zebrafish embryo.
FIGURE 8.
Zebrafish embryo images of (a) the B-mode, (b) the stiffness and (c) the time taken to reach maximum displacement using the conventional burst sequence. The same image set is displayed for the coded excitation sequence from (d) to (f). Displacement profiles at (g) the embryo and (h) the chorion are marked as dashed circles in (e). Note that the body axis of the embryo is denoted by animal pole (AP), vegetal pole (VG), dorsal (D), and ventral (V).
The results demonstrate that the coded excitation shows the deeper side of chorion and embryo. Both are discriminated in the stiffness maps, but not clearly in the B-mode images. The stiffness data demonstrate that the envelope is harder than the embryo region. Figures 8g and 8h show the temporal displacement changes at the embryo and the chorion are as large as 36 and 3.6 μm, respectively. The displacement in the chorion region shows a large peak and is unstabilized even at 450 μs, following a typical pattern observed for the soft tissue phantom as well.
CONCLUSION
Acoustic radiation force impulse images at 100 MHz are acquired by a motor-controlled mechanical scanning system. Such ARFI imaging sequence is developed by employing a chip-coded excitation as the tracking beam to alleviate the attenuation problem at high frequencies. Its performance is compared to conventional ARFI and B-mode images. The results obtained from phantom and zebrafish embryo studies demonstrate that the stiffness (or displacement) of a medium may be monitored by coded excitation ARFI sequence in addition to anatomical structures. They also suggest the potential use of this proposed ARFI method in mapping elastic properties of cellular structures into 2D images, if the frequency is further increased to 1 GHz or higher.
ACKNOWLEDGMENTS
This study has been supported by NIH grants # P41-EB2182 and #R01-EB012058-01A1.
REFERENCES
- 1.Dymling S, Persson H, Hertz T, Lindstrom K. A new ultrasonic method for fluid property measurements. Ultrasound Med. Biol. 1991;17:497–500. doi: 10.1016/0301-5629(91)90186-z. [DOI] [PubMed] [Google Scholar]
- 2.Fahey B, Nightingale K, Stutz D, Trahey G. Acoustic radiation force impulse imaging of thermally- and chemically-induced lesions in soft tissues: preliminary ex vivo results. Ultrasound Med. Biol. 2004;30:321–328. doi: 10.1016/j.ultrasmedbio.2003.11.012. [DOI] [PubMed] [Google Scholar]
- 3.Fatemi M, Greenleaf JF. Vibro-acoustography: an imaging modality based on ultrasound-stimulated acoustic emission. Proc. Natl. Acad. Sci. USA. 1991;96:6603–6608. doi: 10.1073/pnas.96.12.6603. [DOI] [PMC free article] [PubMed] [Google Scholar]
- 4.Gilbert SF. Developmental Biology. 8th ed. Sinauer Associates, Inc.; Sunderland: 2006. [Google Scholar]
- 5.Hall TJ, Bilgen M, Insana MF, Krouskop TA. Phantom materials for elastography. IEEE Trans. Ultrason. Ferroelec. Freq. Control. 1997;44:1355–1365. [Google Scholar]
- 6.Meyr H, Moeneclaey M, Fechtel SA. Digital Communication Receivers. Wiley; New York: 1997. [Google Scholar]
- 7.Mofrad MRK, Kamm RD. Cytoskeletal Mechanics. Cambridge University Press; New York: 2006. [Google Scholar]
- 8.Nightingale K, Kornguth P, Walker W, McDermott B, Trahey G. A novel ultrasonic technique for differentiating cysts from solid lesions: preliminary results in the breast. Ultrasound Med. Biol. 1995;21:745–751. doi: 10.1016/0301-5629(95)00020-r. [DOI] [PubMed] [Google Scholar]
- 9.Nightingale K, Soo M, Nightingale R, Trahey G. Acoustic radiation force impulse imaging: in vivo demonstration of clinical feasibility. Ultrasound Med. Biol. 2002;28:227–235. doi: 10.1016/s0301-5629(01)00499-9. [DOI] [PubMed] [Google Scholar]
- 10.Ophir J, Cespedes I, Ponnekanti H, Yazdi Y, Li X. Elastography: a quantitative method for imaging the elasticity of biological tissues. Ultrason. Imaging. 1991;13:111–134. doi: 10.1177/016173469101300201. [DOI] [PubMed] [Google Scholar]
- 11.Palmeri M, Frinkley K, Zhai L, Bentley R, Ludwig K, Gottfried M, Nightingale K. Acoustic Radiation Force Impulse (ARFI) imaging of the gastrointestinal tract. Ultrason. Imaging. 2005;27:75–78. doi: 10.1177/016173460502700202. [DOI] [PubMed] [Google Scholar]
- 12.Palmeri M, McAleavey S, Fong K, Trahey G, Nightingale K. Dynamic mechanical response of elastic spherical inclusions to impulsive acoustic radiation force excitation. IEEE Trans. Ultrason. Ferroelec. Freq. Control. 2006;53:2065–2079. doi: 10.1109/tuffc.2006.146. [DOI] [PMC free article] [PubMed] [Google Scholar]
- 13.Sugimoto T, Ueha S, Itoh K. Tissue hardness measurement using the radiation force of focused ultra-sound. IEEE Ultrasonics Symposium Proceedings.1990. pp. 1377–1380. [Google Scholar]
- 14.Viola F, Kramer M, Lawrence M, Oberhauser J, Walker W. Sonorheometry: a noncontact method for the dynamic assessment of thrombosis. Ann. Biomed. Eng. 2004;32:696–705. doi: 10.1023/b:abme.0000030235.72255.df. [DOI] [PubMed] [Google Scholar]
- 15.Walker W, Fernandez F, Negron L. A method of imaging viscoelastic parameters with acoustic radiation force. Phys. Med. Biol. 2000;45:1437–1447. doi: 10.1088/0031-9155/45/6/303. [DOI] [PubMed] [Google Scholar]


