

Abstract
Several studies indicate that the cerebellum might play a role in experiencing and/or controlling emphatic emotions, but it remains to be determined whether there is a distinction between positive and negative emotions, and, if so, which specific parts of the cerebellum are involved in these types of emotions. Here, we visualized activations of the cerebellum and extracerebellar regions using high-field fMRI, while we asked participants to observe and imitate images with pictures of human faces expressing different emotional states or with moving geometric shapes as control. The state of the emotions could be positive (happiness and surprise), negative (anger and disgust), or neutral. The positive emotional faces only evoked mild activations of crus 2 in the cerebellum, whereas the negative emotional faces evoked prominent activations in lobules VI and VIIa in its hemispheres and lobules VIII and IX in the vermis. The cerebellar activations associated with negative emotions occurred concomitantly with activations of mirror neuron domains such as the insula and amygdala. These data suggest that the potential role of the cerebellum in control of emotions may be particularly relevant for goal-directed behavior that is required for observing and reacting to another person’s (negative) expressions.
Keywords: Positive and negative valence, Facial expressions, Observation-execution, Mirror neuron system, Cerebellum
Introduction
Emotions can be subdivided into categories according to the effects they evoke [1, 2]. Positive emotions such as happiness or surprise may have broadening effects in that they may encourage novel, varied, and explanatory thoughts and actions [3, 4], while negative emotions such as anger or disgust might be more primitive and evoke fear-related responses such as defensive behavior or autonomic arousal [5]. When confronted with confederates’ expressions of emotions, people empathize with these people’s feelings. One acts as if one experiences the same feelings as his ally through an appreciation of similarity [6–8]. Possible explanations are either the perception–action model of empathy or the perceptual symbol systems framework [9, 10]. The first model implies that perception of an individual’s state automatically activates the observer’s representation of that state [9], while the second implies that feelings are represented in simulators—distributed networks of conjunctive neurons that activate in response to confrontation with another person’s emotion, enabling the observer to re-enact the emotion of the observed person in the form of simulations [10]. Concretely experiencing one’s own emotions or empathizing with another’s emotions involves an activation of a mirror neuron network (insular cortex, medial areas of prefrontal cortex and amygdala) [11–14]. The representations of an emotion (whether the emotion is one’s own or another’s) also automatically prime or generate associated autonomic and somatic responses unless inhibited [9]. Controlling such responses might require involvement of the cerebellum; for example, the cerebellum might help to convert the initial emotional responses into goal-oriented behaviors or contextually appropriate social behaviors [15]. Evidence obtained with positron emission tomography (PET) suggests that the cerebellum indeed plays a role in controlling emotions, but it is still unclear whether and to what extent the cerebellum is involved in both positive and negative emotions, during different experimental (observation and imitation) tasks [16, 17]. Evidence obtained with low-resolution and low-field functional imaging techniques (PET, 1.5T MRI scanner) also supports the possibility that the cerebellum contributes to the control of emotions, but in these studies, precise localization at the cerebellar sub-regional level remains to be established [16, 18–20] (Table 1).
Table 1.
Functional imaging studies showing cerebellar activities associated with negative emotions
| Author and title | Modality | Paradigm | Potential problems/explanation |
|---|---|---|---|
| Lane RD et al. 1997, [16] | PET | Clips showing dynamic facial expressions (happy and sad) vs silent nature clip | Cerebellum activities were found (and only mentioned) in the right lateral cerebellum and in the vermis area with 12 subjects thresholded at p < 0.0005 uncorrected for multiple comparison |
| Neuroanatomical correlates of happiness, sadness, and disgust | |||
| Liotti et al. 2001 [19] | PET | Subjects were asked to generate states of sadness, anxiety, or a neutral, relaxed state comparable to states experienced earlier | Cerebellum activities were found in the right vermis area with 8 subjects with p < 0.001 uncorrected for multiple comparison |
| Differential limbic-cortical correlates of sadness and anxiety in healthy subjects: Implications for affective disorders | |||
| Subjects need to recall memory from its experience, and the paradigm itself also involves cognitive regulation and not perceiving emotion. Therefore the paradigm triggers top-down representations of emotions experienced earlier in life (also involving memory and episodic information), which is different from detecting emotion in a bottom–up fashion by showing emotion-laden dynamic facial expressions | |||
| Garrett et al. 2006 [18] | fMRI (1.5T) | IAPS (international affective picture system, static stimuli depicting negative evoking scenery) | Cerebellum activities were found in the right crus 1 area with nine subjects with p < 0.003 uncorrected for multiple comparison |
| Separating subjective emotion from the perception of emotion-inducing stimuli: an fMRI study | -Pressing button to rate emotion during the experiment. | The paradigm does involve pressing a button; therefore, activations could have been the results of the task, although the contrasts are designed to eliminate activations associated with pressing the button | |
| Van der Gaag et al. 2007 [20] | fMRI (3T) | Dynamic facial expressions vs neutral faces with moving facial muscles but without emotion (e.g. blowing up the cheeks) | Cerebellum activities were found in the right cerebellum area crus 1 when the disgust faces were compared to neutral faces and in the left cerebellum area crus 1 when the fear faces were compared to the neutral faces. Although the cerebellum activities should not be caused by the perception of motion, since the neutral condition also involved motion (though without emotional valence), only one area of cerebellum activation was found in this study with a p value of p < 0.005 uncorrected and using only 10 subjects for this specific analysis. Furthermore, van der Gaag did not really give an explanation why the cerebellum is involved. |
| Facial expressions: What the mirror neuron system can and cannot tell us | |||
| Bastiaanse et al. 2011 [24] | |||
| Age-Related Increase in Inferior Frontal Gyrus Activity and Social Functioning in Autism Spectrum Disorder | |||
| Our stimuli are similar to the studies of van der Gaag and Batiaanse et al. But our study made use of a blocked design with negative and positive emotions, while the van der Gaag study implemented an event-related design. Our design is likely to be more sensitive in isolating activations associated with negative emotions than the van der Gaag study, because we made use of blocked versus event-related design and because we combined disgust and anger together, as we did with happiness and surprise. Our results have multiple cerebellum areas of activation including the cerebellum area crus 1, 2, lobula VI, VIII, and IX and vermis VIII and IX. All areas are thresholded at p < 0.05 with FDR correction for multiple comparisons and with 20 subjects. Our stimuli consist of dynamic facial expressions vs moving geometric shapes; hence, after subtraction, the activity associated with perception of motion should be excluded and what is left should be from the results of the emotional content of the stimuli. |
Here, we tackled these questions by presenting short video clips of emotion-laden faces to human subjects, while examining the activities of their cerebellum and cortical brain regions using high-field functional magnetic resonance imaging (fMRI) (a 3T MRI scanner). Such stimuli are known to evoke activities in several different neural networks involved in emotion, such as the mirror neuron system and the limbic system [11–14]. Since the mirror neuron system can be considered one of the main systems for controlling goal-directed behavior [15], it provides further impetus to question whether the cerebellum shows preferences for responding to positive or negative emotions, whether these responses occur concomitantly with those in the mirror neuron system, and, if so, which parts of the cerebellum are involved during these concomitant activations.
Materials and Methods
Subjects
Written informed consent was obtained from each participant prior to the study, which was approved by the Institutional Review Board. Twenty healthy volunteers (11 men, 9 women) participated in the mirror neurons (MN) experiment. Since there is convincing evidence that the mirror mechanism is involved in imitation as an immediate replica from the observed motor act [21, 22], a control experiment—the imitation task (IT)—was also performed.
Stimuli, Experimental Design, and Procedures
The MN experimental stimuli consisted of full-face, full-color, 3-s video clips of five males and five females displaying various emotional states (anger, disgust, happiness, surprise, and neutrality) [20]. The control stimuli were clips of moving geometric shapes. Thus the four experimental conditions included specific clips of a single category: (1) positive emotional faces: happy and surprised, (2) negative emotional faces: angry and disgust, (3) neutral faces, and (4) moving geometric shapes. Each condition was presented 12 times in pseudo-randomized (counterbalanced between subjects) blocks lasting 12 s and comprising three clips. Clips were separated by a 1-s inter-stimulus interval (ISI), and conditions were separated by a 2 s ISI. The design allowed us to investigate three impacts: (a) that of positive faces versus moving geometric shapes; (b) that of negative faces versus moving geometric shapes; and (c) that of neutral faces versus moving geometric shapes. This design is similar to that employed frequently [23, 24]. A scheme is presented in the Appendix section to make the procedure more clear.
The IT experimental stimuli consisted of a mixture of happy, surprised, angry, and disgust emotional faces. The two main conditions that were tested are “observation” and “observation-execution” (i.e., imitation). In the observation condition, subjects were shown with a red cross for 1 s and then followed by one of the four emotional faces for 3 s and this pattern repeated six times with every time randomly with another emotional faces. Subjects were instructed to observe only. In the imitation condition, subjects were shown with a green cross instead and followed by again one of the emotional faces for 3 s and this pattern repeated six times with every time randomly with another emotional faces. However, subjects were instructed to imitate the observed emotional faces. All emotional faces were having the same amount of occurrence. The observation task and the imitation task were alternated five times each. A scheme is presented in the Appendix section to make the procedure more clear.
The imitation task experiment is considered as the control experiment and was performed in pseudo-randomly during the same scanning session with the mirror neuron experiment. Thus half of the study subject group participated first with the IT experiment and half of the study subject group participated first with the MN experiment. The control experiment (IT) is needed to double check that the MN system from our tested subjects do “exist”, and they allow us to show that the activation areas in both experimental tasks are in line with the current literature [25].
fMRI Acquisition
All imaging was performed on a 3T MRI scanner (General Electric, Milwaukee, USA) using a dedicated eight-channel head coil. For the anatomical image, a 3D high-resolution inversion recovery fast spoiled gradient recalled echo sequence (echo time (TE)/repetition time (TR)/inversion time = 2.1/10.4/300 ms, flip angle = 18°, matrix = 416 × 256, field of view (FOV) = 25 cm, slice thickness 1.6 mm with 50% overlap) was required. For functional imaging, a single-shot gradient-echo echo-planar imaging (EPI) sequence in transverse orientation was used, allowing sufficient blood oxygenation level dependent contrast. The imaging volume covered the entire brain (TR/TE 3,000/30 ms; 64 × 96 matrix with a rectangular field-of-view of 22 cm, 2.5-mm slice thickness, 39 contiguous slices; voxel size of 3.5 × 3.0 × 2.5 mm3). Acquisition time was 10:45 min with a time series of 210 imaging volumes (including 15 s of dummy scans that were discarded) for the MN experiment. Acquisition time was 4:00 min with a time series of 80 imaging volumes (including 15 s of dummy scans that were discarded) for the IT experiment. The experiment was performed in near darkness with all lights turned off except the video projector light. Visual stimuli were shown by means of back projection with a video projector onto a translucent screen in front of the scanner. Participants viewed this screen with a mirror system on top of the head coil. The total field-of-view extended 21° horizontally and 17° vertically. Stimuli were presented by the stimulation software package, Presentation (Neurobehavioral Systems).
Functional Image Analysis
The functional imaging data were analyzed using statistical parametric mapping software (SPM 5, distributed by the Wellcome Department of Cognitive Neurology, University College London, UK) implemented in MATLAB (Version 6.5, Mathworks, Sherborn, MA, USA). Motion correction and co-registration were done according to the methodology provided by SPM5. Brain volumes were normalized to the standard space defined by the Montreal Neurological Institute (MNI) template. The normalized data had a resolution of 2 × 2 × 2 mm and were spatially smoothed with a 3D isotropic Gaussian kernel, with a full width half maximum of 8 mm. Statistical parametric maps were calculated for each subject. Movement parameters resulting from the realignment pre-processing were included as regressors of no interest in order to further reduce motion artifacts. The model was estimated with a high-pass filter with a cut-off period of 128 s. For each participant, contrast maps were calculated between each condition. The individual contrast maps were used for second-level random effects (group) analysis in the regression analyses. One sample t tests were performed for each comparison (e.g., negative faces versus moving geometric shapes for the MN experiment, and imitation versus observation for the IT experiment). All tests were thresholded at p < 0.05 with false discovery rate (FDR) correction for multiple comparisons and with a minimum cluster size of 5 voxels. Anatomic labeling of the observed areas of activation in SPM was done using the macroscopic anatomic parcellation procedure of the MNI MRI single-subject brain [26].
Results
The quantitative results of the random effects group analyses comparing the impacts of the emotionally laden (positive and negative) faces with that of the moving geometric shapes are shown in Tables 2 and 3, respectively.
Positive faces versus moving geometric shapes: When positive faces were contrasted with moving geometric shapes, the analysis revealed only one cerebellar area in which the activity was significantly increased, i.e., the left crus 2 area. The activation size of that region was restricted to 6 voxels only, which is not significantly different (one sample t test with p = 0.5 corrected for multiple comparison with false discovery rate, FDR) from that observed in the same region following the presentation of neutral stimuli (see below). In contrast, the cerebral cortex showed a much more widespread distribution of prominently elevated activations (Table 2): These included bilateral activations in the superior and middle temporal gyri as well as in the middle temporal pole and the inferior occipital gyri; a unilateral activation in the left superior and middle temporal pole as well as in the left middle occipital gyrus; and a unilateral activation in the right precentral gyrus. These data suggest that involvement of the cerebellum in processing positive emotionally laden facial stimuli is very limited.
Negative faces versus moving geometric shapes: The analysis of the results obtained with the negative faces revealed a much more prominent role for the cerebellum (Fig. 1 and Table 3). Following these stimuli, we found significantly elevated, bilateral activations in lobules VI and IX as well as crus 1 and crus 2 in the hemispheres, and in lobules VIII and IX in the vermis. In hemispheric lobule VIII, we only observed unilateral activation on the left side. With regard to concomitant activations in the cerebral cortex, we observed that many of the areas that were involved in processing positive stimuli were also involved in processing negative stimuli (Tables 2 and 3); these included bilateral activations of the precentral gyri; the inferior, middle, and superior temporal gyri; the middle and superior temporal poles; the inferior, middle, and superior occipital gyri; and the fusiform gyri. In addition, the negative stimuli induced cerebral activations of areas that were not activated by the positive stimuli. Most prominently, these included bilateral activations of the amygdala, insula, and inferior and middle frontal gyri. Since these three latter regions are all involved in the so-called mirror neuron system [27], it is interesting to note that areas adjacent to this putative mirror neuron system in the temporal and parietal gyri were also activated (for more details see Table 3). Thus, the cerebral cortex in general responded with prominent activations to both positive and negative stimuli, whereas both the cerebellum and the presumptive mirror neuron system showed a preference for negative stimuli.
Neutral faces versus moving geometric shapes: Contrasting neutral faces with moving geometric shapes revealed limited cerebellar activity. Like the activity following stimulation with positively emotionally laden faces, only the left crus 2 area was activated; and the size of this activation was also very minimal, covering 4 voxels only. The cerebral cortex and the subcortical regions including the mirror neuron system were also hardly activated by neutral stimuli; we observed only bilateral activation of the occipital gyri (Table 4).
Table 2.
Positive emotional faces vs moving geometric shapes: areas of activation in the mirror neurons experiment with cluster size, T values of the local maximum, Montreal Neurological Institute (MNI) coordinates, the anatomical areas within a cluster, the percentage of the cluster size, and the functional area
| Positive emotional faces vs moving geometric objects | |||||||
|---|---|---|---|---|---|---|---|
| Cluster size | T value | MNI coordinate (mm) | Anatomic area | Side | Functional area | ||
| x | y | z | |||||
| 6 | 4.8 | −16 | −82 | −42 | Cerebellum crus 2 | L | Cerebellum |
| 23 | 6.09 | −56 | −8 | −8 | Superior temporal gyrus | L | MN system |
| 65 | 6.57 | 52 | −8 | −8 | Superior temporal gyrus | R | MN system |
| 8 | 4.39 | −42 | 24 | −2 | Inferior orbital frontal gyrus | L | MN system |
| 12 | 4.39 | −50 | 28 | 8 | Inferior triangular frontal gyrus | L | MN system |
| 14 | 5.43 | 32 | 10 | 56 | Middle frontal gyrus | R | MN system |
| 265 | 6.09 | −58 | −8 | −20 | Middle temporal gyrus | L | |
| 338 | 6.57 | 54 | −10 | −20 | Middle temporal gyrus | R | |
| 7 | 5.52 | −34 | 8 | −32 | Superior temporal pole | L | |
| 13 | 5.52 | −40 | 6 | −16 | Middle temporal pole | L | |
| 7 | 4.39 | 46 | 12 | −36 | Middle temporal pole | R | |
| 51 | 9.89 | −6 | −80 | 8 | Calcarine | L | |
| 42 | 7.65 | 8 | −80 | 8 | Calcarine | R | |
| 11 | 9.89 | −8 | −84 | −6 | Lingual | L | |
| 67 | 12.87 | −46 | −70 | 4 | Inferior occipital gyrus | L | |
| 25 | 7.65 | 38 | −72 | 4 | Inferior occipital gyrus | R | |
| 50 | 9.89 | −39 | −100 | 42 | Middle occipital gyrus | L | |
All areas were thresholded at p < 0.05 with FDR correction for multiple comparisons and with a minimum cluster size of 5 voxels
L left hemisphere, R right hemisphere
Table 3.
Negative emotional faces vs moving geometric shapes: areas of activation in the mirror neurons experiment with cluster size, T values of the local maximum, Montreal Neurological Institute (MNI) coordinates, the anatomical areas within a cluster, the percentage of the cluster size and the functional area
| Negative emotional faces vs moving geometric shapes | |||||||
|---|---|---|---|---|---|---|---|
| Cluster size | T value | MNI coordinate (mm) | Anatomic area | Side | Functional area | ||
| x | y | z | |||||
| 135 | 5.49 | −42 | −66 | −34 | Cerebellum crus 1 | L | Cerebellum |
| 147 | 6.71 | 42 | −66 | −32 | Cerebellum crus 1 | R | Cerebellum |
| 257 | 12.87 | −16 | −82 | −42 | Cerebellum crus 2 | L | Cerebellum |
| 84 | 4.13 | 18 | −82 | −40 | Cerebellum crus 2 | R | Cerebellum |
| 15 | 5.49 | −14 | −70 | −22 | Cerebellum VI | L | Cerebellum |
| 53 | 6.71 | 18 | −68 | −24 | Cerebellum VI | R | Cerebellum |
| 14 | 5.02 | −24 | −60 | −56 | Cerebellum VIII | L | Cerebellum |
| 92 | 5.02 | −6 | −54 | −50 | Cerebellum IX | L | Cerebellum |
| 31 | 5.02 | 8 | −56 | −48 | Cerebellum IX | R | Cerebellum |
| 80 | 5.02 | 2 | −58 | −38 | Vermis IX | Cerebellum | |
| 11 | 5.02 | 2 | −64 | −42 | Vermis VIII | Cerebellum | |
| 60 | 5.6 | −24 | −2 | −22 | Amygdala | L | MN system |
| 76 | 6.24 | 26 | 0 | −22 | Amygdala | R | MN system |
| 280 | 6.64 | −40 | −22 | −2 | Insula | L | MN system |
| 85 | 6.24 | 42 | −20 | −6 | Insula | R | MN system |
| 41 | 4.11 | −4 | −24 | 62 | Precentral gyrus | L | MN system |
| 265 | 6.24 | 4 | −24 | 62 | Precentral gyrus | R | MN system |
| 548 | 5.24 | −12 | −14 | 66 | Supplementary motor area | L | MN system |
| 402 | 5.24 | 14 | −16 | 70 | Supplementary motor area | R | MN system |
| 104 | 7.79 | −56 | −8 | −8 | Superior temporal gyrus | L | MN system |
| 393 | 7.91 | 52 | −8 | −8 | Superior temporal gyrus | R | MN system |
| 971 | 6.64 | −50 | 28 | 8 | Inferior triangular frontal gyrus | L | MN system |
| 571 | 6.24 | −8 | −24 | 64 | Inferior triangular frontal gyrus | R | MN system |
| 31 | 4.11 | −44 | 8 | 56 | Middle frontal gyrus | L | MN system |
| 250 | 6.24 | 32 | 10 | 56 | Middle frontal gyrus | R | MN system |
| 27 | 7.79 | −56 | −56 | 38 | Angular | L | |
| 9 | 3.85 | 48 | −52 | 38 | Angular | R | |
| 12 | 7.91 | 28 | −14 | −20 | Hippocampus | R | |
| 67 | 6.24 | −26 | −16 | −20 | Hippocampus | L | |
| 23 | 4.38 | 18 | −2 | −4 | Pallidum | R | |
| 20 | 5.6 | −26 | −36 | −16 | Parahippocampal | L | |
| 65 | 6.24 | 22 | −36 | −14 | Parahippocampal | R | |
| 72 | 3.79 | −22 | 8 | −4 | Putamen | L | |
| 185 | 4.38 | 22 | 10 | −4 | Putamen | R | |
| 15 | 7.91 | 62 | −46 | 30 | Supramarginal | R | |
| 1,346 | 7.79 | −58 | −8 | −20 | Middle temporal gyrus | L | |
| 885 | 7.91 | 54 | −10 | −20 | Middle temporal gyrus | R | |
| 12 | 5.49 | −44 | −4 | −28 | Inferior temporal gyrus | L | |
| 23 | 6.71 | 42 | 4 | −38 | Inferior temporal gyrus | R | |
| 128 | 6.64 | −34 | 8 | −32 | Superior temporal pole | L | |
| 7 | 6.24 | 36 | −4 | −32 | Superior temporal pole | R | |
| 19 | 6.64 | −40 | 6 | −16 | Middle temporal pole | L | |
| 53 | 4.35 | 46 | 12 | −36 | Middle temporal pole | R | |
| 124 | 12.87 | −6 | −80 | 8 | Calcarine | L | |
| 110 | 6.45 | 8 | −80 | 8 | Calcarine | R | |
| 41 | 5.49 | −18 | −80 | −12 | Fusiform | L | |
| 106 | 6.71 | 24 | −80 | −12 | Fusiform | R | |
| 82 | 12.87 | −8 | −84 | −6 | Lingual | L | |
| 25 | 6.45 | 8 | −82 | −6 | Lingual | R | |
| 11 | 12.87 | −30 | −70 | 42 | Superior occipital gyrus | L | |
| 14 | 6.45 | 30 | −70 | 38 | Superior occipital gyrus | R | |
| 191 | 12.87 | −38 | −100 | −23 | Middle occipital gyrus | L | |
| 10 | 6.45 | 20 | −104 | 0 | Middle occipital gyrus | R | |
| 146 | 12.87 | −46 | −70 | 4 | Inferior occipital gyrus | L | |
| 98 | 6.45 | 38 | −72 | 4 | Inferior occipital gyrus | R | |
All areas were thresholded at p < 0.05 with FDR correction for multiple comparisons and with a minimum cluster size of 5 voxels
L left hemisphere, R right hemisphere
Fig. 1.
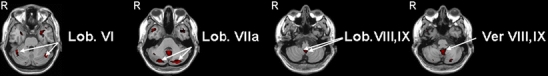
Negative emotional faces vs moving geometric shapes: four axial slices showing areas of activation of the negative faces vs moving geometric shapes in the mirror neurons experiment (Lob lobule, Ver vermis, R right hemisphere). All areas were thresholded at p < 0.05 corrected for multiple comparisons at cluster level and a minimum cluster size of 5 voxels
Table 4.
Neutral faces vs moving geometric shapes: areas of activation in the mirror neurons experiment with cluster size, T values of the local maximum, Montreal Neurological Institute (MNI) coordinates, the anatomical areas within a cluster, the percentage of the cluster size and the functional area
| Neutral faces vs moving geometric shapes | |||||||
|---|---|---|---|---|---|---|---|
| Cluster size | T value | MNI coordinate (mm) | Anatomic area | Side | Functional area | ||
| x | y | z | |||||
| 4 | 5.81 | −16 | −82 | −42 | Cerebellum crus 2 | L | Cerebellum |
| 15 | 8.34 | −6 | −80 | 8 | Calcarine | L | |
| 23 | 6.64 | 8 | −80 | 8 | Calcarine | R | |
| 29 | 8.34 | −46 | −70 | 4 | Inferior occipital gyrus | L | |
| 6 | 6.64 | 38 | −72 | 4 | Inferior occipital gyrus | R | |
All areas were thresholded at p < 0.05 with FDR correction for multiple comparisons and with a minimum cluster size of 5 voxels
L left hemisphere, R right hemisphere
The restricted involvement of the cerebellum during the viewing of positive and neutral faces and the relatively elaborate activations of the cerebellum in response to negative emotions suggest that the cerebellum plays a salient role during the processing of negative emotions.
The quantitative results of the random effects group analyses comparing the impacts of the emotionally laden (positive, negative, and neutral) faces with that of the natural faces are supplied in the appendix section for reference only (Appendix Tables 5 and 6).
Imitation versus Observation: The quantitative results of the random effects group analyses comparing the impacts of the imitation task with the observation task from the imitation experiment (the control experiment) are supplied in the appendix section (Appendix Table 7). The results of the control experiment show that similar activations are observed under the observation task (described under 1, 2, 3 above), however one can observe more significant, bilateral activation when imitating the emotional (either positive or negative) stimuli. Furthermore, bilateral activations in the crus 1, cerebellum IV-I and VI are shown comparing imitation and observation.
Table 5.
Positive emotional faces vs neutral faces: areas of activation in the mirror neurons experiment with cluster size, T values of the local maximum, Montreal Neurological Institute (MNI) coordinates, the anatomical areas within a cluster, the percentage of the cluster size and the functional area
| Positive emotional faces vs neutral faces | |||||||
|---|---|---|---|---|---|---|---|
| Cluster size | T value | MNI coordinate (mm) | Anatomic area | Side | Functional area | ||
| x | y | z | |||||
| 47 | 6.6 | −42 | −66 | −34 | Cerebellum crus 1 | L | Cerebellum |
| 46 | 7.84 | 42 | −72 | −32 | Cerebellum crus 1 | R | Cerebellum |
| 89 | 6.6 | −14 | −70 | −22 | Cerebellum VI | L | Cerebellum |
| 145 | 7.84 | 18 | −68 | −24 | Cerebellum VI | R | Cerebellum |
| 9 | 3.77 | −24 | −2 | −22 | Amygdala | L | MN system |
| 55 | 4.17 | 26 | 0 | −22 | Amygdala | R | MN system |
| 39 | 4.28 | −40 | −22 | −2 | Insula | L | MN system |
| 158 | 5.67 | 4 | −24 | 62 | Precentral gyrus | R | MN system |
| 9 | 5.67 | −14 | −42 | 66 | Postcentral gyrus | R | MN system |
| 31 | 3.88 | 14 | −16 | 70 | Supplementary motor area | R | MN system |
| 160 | 6.6 | −56 | −8 | −8 | Superior temporal gyrus | L | MN system |
| 613 | 7.84 | 52 | −8 | −8 | Superior temporal gyrus | R | MN system |
| 48 | 5.67 | 32 | 10 | 56 | Middle frontal gyrus | R | MN system |
| 18 | 4.72 | −26 | −16 | −20 | Hippocampus | L | |
| 88 | 4.17 | 28 | −14 | −20 | Hippocampus | R | |
| 45 | 4.72 | −26 | −36 | −16 | Parahippocampal gyrus | L | |
| 19 | 4.17 | 22 | −36 | −14 | Parahippocampal gyrus | R | |
| 25 | 6.6 | −54 | −48 | 30 | Supramarginal | L | |
| 1,077 | 6.6 | −58 | −8 | −20 | Middle temporal gyrus | L | |
| 54 | 4.92 | 54 | −10 | −20 | Middle temporal gyrus | R | |
| 46 | 6.6 | −44 | −4 | −28 | Inferior temporal gyrus | L | |
| 444 | 7.84 | 42 | 4 | −38 | Inferior temporal gyrus | R | |
| 23 | 3.77 | −34 | 8 | −32 | Superior temporal pole | L | |
| 7 | 4.17 | 36 | −4 | −32 | Superior temporal pole | R | |
| 28 | 4.28 | −40 | 6 | −16 | Middle temporal pole | L | |
| 125 | 4.92 | 46 | 12 | −36 | Middle temporal pole | R | |
| 35 | 7.84 | 8 | −80 | 8 | Calcarine | R | |
| 13 | 7.84 | 0 | −80 | 26 | Cuneus | R | |
| 304 | 6.6 | −18 | −80 | −12 | Fusiform | L | |
| 377 | 7.84 | 24 | −80 | −12 | Fusiform | R | |
| 13 | 7.84 | 8 | −82 | −6 | Lingual | R | |
| 65 | 7.84 | 30 | −70 | 38 | Superior Occipital gyrus | R | |
| 743 | 6.6 | −38 | −100 | −23 | Middle occipital gyrus | L | |
| 388 | 7.84 | 20 | −104 | 0 | Middle occipital gyrus | R | |
| 275 | 6.6 | −46 | −70 | 4 | Inferior occipital gyrus | L | |
| 441 | 7.84 | 38 | −72 | 4 | Inferior occipital gyrus | R | |
| 10 | 3.89 | −12 | 60 | 34 | Superior frontal gyrus | L | |
Table 6.
Negative emotional faces vs neutral faces: areas of activation in the mirror neurons experiment with cluster size, T values of the local maximum, Montreal Neurological Institute (MNI) coordinates, the anatomical areas within a cluster, the percentage of the cluster size and the functional area
| Negative emotional faces vs neutral faces | |||||||
|---|---|---|---|---|---|---|---|
| Cluster size | T value | MNI coordinate (mm) | Anatomic area | Side | Functional area | ||
| x | y | z | |||||
| 706 | 16.74 | 42 | −66 | −32 | Cerebellum crus 1 | R | Cerebellum |
| 362 | 16.74 | 18 | −82 | −40 | Cerebellum crus 2 | R | Cerebellum |
| 267 | 16.74 | −16 | −82 | −42 | Cerebellum crus 2 | L | Cerebellum |
| 643 | 16.74 | −42 | −66 | −34 | Cerebellum crus 1 | L | Cerebellum |
| 18 | 16.74 | −6 | −46 | −18 | Cerebellum IV-I | L | Cerebellum |
| 86 | 16.74 | 8 | −46 | −18 | Cerebellum IV-I | R | Cerebellum |
| 72 | 16.74 | −6 | −54 | −50 | Cerebellum IX | L | Cerebellum |
| 27 | 16.74 | 8 | −56 | −48 | Cerebellum IX | R | Cerebellum |
| 820 | 16.74 | −14 | −70 | −22 | Cerebellum VI | L | Cerebellum |
| 792 | 16.74 | 18 | −68 | −24 | Cerebellum VI | R | Cerebellum |
| 63 | 16.74 | −34 | −64 | −54 | Cerebellum VIIb | L | Cerebellum |
| 45 | 16.74 | 20 | −54 | −56 | Cerebellum VIIb | R | Cerebellum |
| 95 | 16.74 | −24 | −60 | −56 | Cerebellum VIII | L | Cerebellum |
| 9 | 16.74 | 28 | −60 | −56 | Cerebellum VIII | R | Cerebellum |
| 41 | 16.74 | −24 | −38 | −46 | Cerebellum X | L | Cerebellum |
| 68 | 16.74 | 2 | −58 | −38 | Vermis IX | Cerebellum | |
| 6 | 2.97 | 2 | −70 | −22 | Vermis VI | Cerebellum | |
| 32 | 16.74 | 2 | −64 | −42 | Vermis VIII | Cerebellum | |
| 127 | 16.74 | −24 | −2 | −22 | Amygdala | L | MN system |
| 122 | 16.74 | 26 | 0 | −22 | Amygdala | R | MN system |
| 394 | 16.74 | −40 | −22 | −2 | Insula | L | MN system |
| 63 | 16.74 | 42 | −20 | −6 | Insula | R | MN system |
| 539 | 16.74 | 4 | −24 | 62 | Precentral gyrus | L | MN system |
| 538 | 4.67 | −12 | −14 | 66 | Supplementary motor area | L | MN system |
| 1,530 | 16.74 | 52 | −8 | −8 | Superior temporal gyrus | R | MN system |
| 684 | 16.74 | −56 | −8 | −8 | Superior temporal gyrus | L | MN system |
| 625 | 16.74 | −42 | 22 | 2 | Inferior opercular frontal gyrus | L | MN system |
| 657 | 16.74 | −52 | 16 | 22 | Inferior opercular frontal gyrus | R | MN system |
| 910 | 16.74 | −42 | 24 | −2 | Inferior orbital frontal gyrus | L | MN system |
| 530 | 16.74 | 36 | 26 | −2 | Inferior orbital frontal gyrus | R | MN system |
| 1,300 | 16.74 | −50 | 28 | 8 | Inferior triangular frontal gyrus | L | MN system |
| 643 | 16.74 | −8 | −24 | 64 | Inferior triangular frontal gyrus | R | MN system |
| 36 | 16.74 | −44 | 8 | 56 | Middle frontal gyrus | L | MN system |
| 226 | 16.74 | 32 | 10 | 56 | Middle frontal gyrus | R | MN system |
All areas were thresholded at p < 0.05 with FDR correction for multiple comparisons and with a minimum cluster size of 5 voxels
L left hemisphere, R right hemisphere
Table 7.
Imitation task vs observation task: areas of activation in the imitation task experiment with cluster size, T values of the local maximum, Montreal Neurological Institute (MNI) coordinates, the anatomical areas within a cluster, the percentage of the cluster size and the functional area
| Imitation Task vs Observation Task | |||||||
|---|---|---|---|---|---|---|---|
| Cluster Size | T value | MNI coordinate (mm) | Anatomic Area | Side | Functional area | ||
| x | y | z | |||||
| 163 | 10.00 | −42 | −66 | −34 | Cerebellum crus 1 | L | Cerebellum |
| 255 | 10.00 | 42 | −66 | −32 | Cerebellum crus 1 | R | Cerebellum |
| 5 | 5.21 | 18 | −82 | −40 | Cerebellum crus 2 | R | Cerebellum |
| 16 | 10.00 | −6 | −46 | −18 | Cerebellum IV-I | L | Cerebellum/motor system |
| 90 | 10.00 | 8 | −46 | −18 | Cerebellum IV-I | R | Cerebellum/motor system |
| 225 | 10.00 | −14 | −70 | −22 | Cerebellum VI | L | Cerebellum/motor system |
| 122 | 10.00 | 18 | −68 | −24 | Cerebellum VI | R | Cerebellum/motor system |
| 19 | 5.21 | 20 | −54 | −56 | Cerebellum VIIb | R | Cerebellum |
| 50 | 5.21 | 28 | −60 | −56 | Cerebellum VIII | R | Cerebellum |
| 15 | 10.00 | 2 | −70 | −22 | Vermis VI | Cerebellum | |
| 116 | 10.00 | −40 | −22 | −2 | Insula | L | MN system |
| 26 | 4.45 | 42 | −20 | −6 | Insula | R | MN system |
| 687 | 10.00 | −4 | −24 | 62 | Precentral gyrus | L | MN system |
| 47 | 10.67 | 4 | −24 | 62 | Precentral gyrus | R | MN system |
| 327 | 10.00 | −12 | −14 | 66 | Supplementary motor area | L | Motor system |
| 847 | 10.00 | −14 | −42 | 68 | Postcentral gyrus | L | MN system |
| 123 | 10.67 | −14 | −42 | 66 | Postcentral gyrus | R | MN system |
| 19 | 10.00 | 12 | 4 | 74 | Paracentral lobule | L | MN system |
| 7 | 10.00 | −54 | −8 | 36 | Paracentral lobule | R | MN system |
| 163 | 10.00 | −56 | −8 | −8 | Superior temporal gyrus | L | MN system |
| 11 | 4.57 | 52 | −8 | −8 | Superior temporal gyrus | R | MN system |
| 49 | 10.00 | −42 | 22 | 2 | Inferior operculus frontal gyrus | L | MN system/imitation |
| 74 | 10.00 | −52 | 16 | 22 | Inferior operculus frontal gyrus | R | MN system/Imitation |
| 15 | 10.00 | −50 | 28 | 8 | Inferior triangular frontal gyrus | L | MN system/Imitation |
| 9 | 3.53 | −44 | 8 | 56 | Middle frontal gyrus | L | MN system |
| 13 | 10.00 | 32 | 10 | 56 | Middle frontal gyrus | R | MN system |
| 99 | 10.00 | −12 | 60 | 34 | Superior frontal gyrus | L | MN system |
| 46 | 5.56 | −24 | −2 | −2 | Pallidum | L | |
| 44 | 5.26 | 18 | −2 | −4 | Pallidum | R | |
| 6 | 4.03 | −26 | −16 | −20 | Hippocampus | L | |
| 6 | 3.72 | 28 | −14 | −20 | Hippocampus | R | |
| 9 | 5.07 | 22 | −36 | −14 | Parahippocampal | R | |
| 176 | 10.00 | −10 | −58 | 38 | Precuneus | L | |
| 134 | 10.00 | 8 | −52 | 38 | Precuneus | R | |
| 16 | 5.56 | −22 | 8 | −4 | Putamen | L | |
| 32 | 5.05 | 22 | 10 | −4 | Putamen | R | |
| 282 | 10.00 | −54 | −48 | 30 | Supramarginal | L | |
| 8 | 4.81 | 14 | −24 | 6 | Thalamus | R | |
| 17 | 5.97 | −44 | −4 | −28 | Inferior temporal gyrus | L | |
| 44 | 10.00 | 42 | 4 | −38 | Inferior temporal gyrus | R | |
| 11 | 10.00 | −56 | −8 | −20 | Middle temporal gyrus | L | |
| 32 | 10.00 | 54 | −10 | −20 | Middle temporal gyrus | R | |
| 9 | 4.23 | −40 | 6 | −16 | Middle temporal pole | L | |
| 37 | 5.07 | 46 | 12 | −36 | Middle temporal pole | R | |
| 56 | 10.00 | 36 | −4 | −32 | Superior temporal pole | R | |
| 100 | 10.00 | −8 | −84 | −6 | Lingual | L | |
| 36 | 10.00 | −18 | −80 | −12 | Fusiform gyrus | L | |
| 47 | 10.00 | 24 | −80 | −12 | Fusiform gyrus | R | |
| 38 | 5.97 | −46 | −70 | 4 | Inferior occipital gyrus | L | |
| 24 | 10.00 | 38 | −72 | 4 | Inferior occipital gyrus | R | |
| 126 | 10.00 | −38 | −100 | −23 | Middle occipital gyrus | L | |
| 274 | 10.00 | 20 | −104 | 0 | Middle occipital gyrus | R | |
| 229 | 10.00 | −30 | −70 | 42 | Superior occipital gyrus | L | |
| 200 | 10.00 | 30 | −70 | 38 | Superior occipital gyrus | R | |
All areas were thresholded at p < 0.05 with FDR correction for multiple comparisons and with a minimum cluster size of 5 voxels
L left hemisphere, R right hemisphere
Discussion
Our main findings are that the cerebellum may be more prominently involved in control of negative emotions than positive emotions, and that this activity may be related to that of the mirror neuron system (Tables 2 and 3). As will be discussed below, these data are in line with the possibility that the cerebellum is involved in predictive and pro-active control of cognitive functions.
The cerebellum of subjects showed prominent activations in lobules VI and VII in the hemispheres and in lobules VIII and IX in the vermis following exposure to pictures with negative emotions. Several regions of the mirror neuron system including the amygdala, insula, and frontal cortex were concomitantly activated. These regions have been associated with a negative bodily state or arousal that may trigger actions aimed at overcoming this negative state [20]. As negative emotional facial expressions signal threat, activation of the cerebellum may be related to activation of motor plans associated with action preparedness such as during fight–flight behavior, [28] and hence promote processing of the confederate emotion.
As emotions activate a representation [9] or a simulation network [10], negative emotions in particular activate an adaptive network allowing people to develop quick and flexible responses involving an efficient synchronization of a large network of brain regions [17]. Negative emotions are known to be processed more quickly than positive emotions [29]. At an abstract level the observations in this study show that people more vigorously activate a large network of brain regions to a confederate who is in need than to one who experiences welfare [30]. As mirror neurons are involved in managing goal-directed behavior, [15] which may require cerebellum involvement, we can further speculate that negative emotions trigger behaviors which urge people to evoke compassionate behaviors such as altruism [30].
The control experiment performed in this study showed that imitating the emotional stimuli, more areas were significantly activated compared to the observation experiment. However, similar areas in the cerebellum and other cortical areas are significantly activated under both experimental tasks (observation and imitation). These result support current literature concerning activations of the MN system [24]. Among others, Fogassi et al. [31] showed that it is not only the imitation of actions that triggers the MN system, but also the observation that leads to activation in these areas (for more recent study see [25 and or 24]).
Our data are in line with those of Schmahmann and Sherman [2, 32, 33], who identified the Cerebellar Cognitive Affective syndrome in patients with lesions in cerebellar lobules VI and VII crus 1 and crus 2. They observed that patients with either congenital or acquired damage in these regions suffer from a wide spectrum of emotional and behavioral deficits [32, 33]. These included for example flattening of affect or disinhibition characterized by over-familiarity or impulsive actions. Such impairments may well affect the ability to communicate and empathize with perspectives of other persons [7]. Interestingly, Schmahmann and colleagues also found specific correlations in patients with damage in lobule IX [32, 34], one of the other regions that was prominently activated following exposure to pictures with negative emotions in our study. These patients often have problems to form bonds similar to patients with obsessive-compulsive disorders and panic disorders [34].
Several other studies also found similar results. Leslie and colleagues have reported significant cerebellar activation during both positive and negative subjective experiences with fMRI [35]. However, their studies combined both positive and negative emotions together for analysis and only found activation bilaterally in crus 1. Damasio performed a similar whole brain study using PET and reported activation bilaterally at the mesial cerebellum for negative emotions and unilaterally left at the mesial cerebellum for positive emotions [36]. In our study, we were probably able to report activation in the cerebellum at higher spatial resolution than those by Leslie [35] and Damasio [36], because we employed high-field (3T) MRI. Moreover, different from their studies, in our study we used dynamically moving objects instead of the neutral faces as the baseline condition. We did so to circumvent the potential bias induced by the motion that can be induced during exposure to faces with emotions (positive and negative).
Taken together, the current data show that the posterior cerebellum and the mirror neuron system are conceitedly activated when negative emotions laden faces are presented, which raises the possibility that this part of the cerebellum is particularly relevant for empathic responses towards confederates.
Acknowledgments
Conflict of Interest
There is no conflict of interest.
Open Access
This article is distributed under the terms of the Creative Commons Attribution Noncommercial License which permits any noncommercial use, distribution, and reproduction in any medium, provided the original author(s) and source are credited.
Appendix
Table 8.
Scheme for the mirror neuron experiment
| Experimental condition | Positive emotion | inter-stimulus interval (ISI) | Positive emotion | ISI | Positive emotion | ISI | Moving geometric shape | ISI | Moving geometric shape | ISI | Moving geometric shape | ISI |
|---|---|---|---|---|---|---|---|---|---|---|---|---|
| Time (s) | 3 | 1 | 3 | 1 | 3 | 1 | 3 | 1 | 3 | 1 | 3 | 1 |
| Experimental condition | Negative emotion | inter-stimulus interval (ISI) | Negative emotion | ISI | Negative emotion | ISI | Neutral face | ISI | Neutral face | ISI | Neutral face | ISI |
| Time (s) | 3 | 1 | 3 | 1 | 3 | 1 | 3 | 1 | 3 | 1 | 3 | 1 |
12 times
The MN experimental stimuli consisted of full-face, full-color, 3-s video clips of five males and five females displaying various emotional states (anger, disgust, happiness, surprise, and neutrality). The control stimuli were clips of moving geometric shapes. Thus the four experimental conditions included specific clips of a single category: (1) positive emotional faces: happy and surprised, (2) negative emotional faces: angry and disgust, (3) neutral faces, and (4) moving geometric shapes. Each condition was presented 12 times in pseudo-randomized (counterbalanced between subjects) blocks lasting 12 s and comprising three clips. Clips were separated by a 1-s inter-stimulus interval (ISI), and conditions were separated by a 2-s ISI.
Table 9.
Scheme for the imitation task experiment
| Experimental condition | Observation task (show with a red cross) | Emotion | Observation task (show with a red cross) | Emotion | Observation task (show with a red cross) | Emotion | Observation task (show with a red cross) | Emotion | Observation task (show with a red cross) | Emotion |
|---|---|---|---|---|---|---|---|---|---|---|
| Time (s) | 1 | 3 | 1 | 3 | 1 | 3 | 1 | 3 | 1 | 3 |
| Experimental condition | Observation task (show with a red cross) | Emotion | Imitation task (show with a green cross) | Emotion | Imitation task (show with a green cross) | Emotion | Imitation task (show with a green cross) | Emotion | Imitation task (show with a green cross) | Emotion |
| Time (s) | 1 | 3 | 1 | 3 | 1 | 3 | 1 | 3 | 1 | 3 |
| Experimental condition | Imitation task (show with a green cross) | Emotion | Imitation task (show with a green cross) | Emotion | ….. | X5 times | ||||
| Time (s) | 1 | 3 | 1 | 3 |
The IT experimental stimuli consisted of a mixture of happy, surprised, angry, and disgust emotional faces. The two main conditions that were tested are “observation” and “observation-execution” (i.e., imitation). In the observation condition, subjects were shown with a red cross for 1 s and then followed by one of the four emotional faces for 3 s and this pattern repeated six times with every time randomly with another emotional faces. Subjects were instructed to observe only. In the imitation condition, subjects were shown with a green cross instead and followed by again one of the emotional faces for 3 s and this pattern repeated six times with every time randomly with another emotional faces. However, subjects were instructed to imitate the observed emotional faces. All emotional faces were having the same amount of occurrence. The observation task and the imitation task were alternated five times each.
References
- 1.Ivry RB, Spencer RM. The neural representation of time. Curr. Opin. Neurobiol. 2004;14(2):225–232. doi: 10.1016/j.conb.2004.03.013. [DOI] [PubMed] [Google Scholar]
- 2.Schmahmann JD, Sherman JC. The cerebellar cognitive affective syndrome. Brain. 1998;121(Pt 4):561–579. doi: 10.1093/brain/121.4.561. [DOI] [PubMed] [Google Scholar]
- 3.Fredrickson BL. What good are positive emotions? Rev. Gen. Psychol. 1998;2(3):300–319. doi: 10.1037/1089-2680.2.3.300. [DOI] [PMC free article] [PubMed] [Google Scholar]
- 4.Fredrickson BL. The broaden-and-build theory of positive emotions. Philos Trans R Soc Lond B Biol Sci. 2004;359(1449):1367–1378. doi: 10.1098/rstb.2004.1512. [DOI] [PMC free article] [PubMed] [Google Scholar]
- 5.LeDoux JE. Emotion circuits in the brain. Annu. Rev. Neurosci. 2000;23:155–184. doi: 10.1146/annurev.neuro.23.1.155. [DOI] [PubMed] [Google Scholar]
- 6.Oberman LM, Pineda JA, Ramachandran VS. The human mirror neuron system: A link between action observation and social skills. Soc Cogn Affect Neurosci. 2007;2(1):62–66. doi: 10.1093/scan/nsl022. [DOI] [PMC free article] [PubMed] [Google Scholar]
- 7.Oberman LM, Ramachandran VS. The simulating social mind: the role of the mirror neuron system and simulation in the social and communicative deficits of autism spectrum disorders. Psychol. Bull. 2007;133(2):310–327. doi: 10.1037/0033-2909.133.2.310. [DOI] [PubMed] [Google Scholar]
- 8.Oberman LM, Winkielman P, Ramachandran VS. Face to face: blocking facial mimicry can selectively impair recognition of emotional expressions. Soc. Neurosci. 2007;2(3–4):167–178. doi: 10.1080/17470910701391943. [DOI] [PubMed] [Google Scholar]
- 9.Preston SD, de Waal FB. Empathy: Its ultimate and proximate bases. Behav Brain Sci. 2002;25(1):1–20. doi: 10.1017/s0140525x02000018. [DOI] [PubMed] [Google Scholar]
- 10.Barsalou LW. Perceptual symbol systems. Behav Brain Sci. 1999;22(4):577–609. doi: 10.1017/s0140525x99002149. [DOI] [PubMed] [Google Scholar]
- 11.Carr L, et al. Neural mechanisms of empathy in humans: A relay from neural systems for limitation to limbic areas. PNAS. 2003;100(April):5497–5502. doi: 10.1073/pnas.0935845100. [DOI] [PMC free article] [PubMed] [Google Scholar]
- 12.Iacoboni M, Dapretto M. The mirror neuron system and the consequences of its dysfunction. Nat. Rev. Neurosci. 2006;7(12):942–951. doi: 10.1038/nrn2024. [DOI] [PubMed] [Google Scholar]
- 13.Lamm C, Batson CD, Decety J. The neural substrate of human empathy: effects of perspective-taking and cognitive appraisal. J. Cogn. Neurosci. 2007;19(1):42–58. doi: 10.1162/jocn.2007.19.1.42. [DOI] [PubMed] [Google Scholar]
- 14.Wager TD, Lindquist M, Kaplan L. Meta-analysis of functional neuroimaging data: current and future directions. Soc Cogn Affect Neurosci. 2007;2(2):150–158. doi: 10.1093/scan/nsm015. [DOI] [PMC free article] [PubMed] [Google Scholar]
- 15.Buccino G, et al. Neural circuits underlying imitation learning of hand actions: an event-related fMRI study. Neuron. 2004;42(2):323–334. doi: 10.1016/S0896-6273(04)00181-3. [DOI] [PubMed] [Google Scholar]
- 16.Lane RD, et al. Neuroanatomical correlates of happiness, sadness, and disgust. Am J Psychiatry. 1997;154(7):926–933. doi: 10.1176/ajp.154.7.926. [DOI] [PubMed] [Google Scholar]
- 17.Turner BM, et al. The cerebellum and emotional experience. Neuropsychologia. 2007;45(6):1331–1341. doi: 10.1016/j.neuropsychologia.2006.09.023. [DOI] [PMC free article] [PubMed] [Google Scholar]
- 18.Garrett AS, Maddock RJ. Separating subjective emotion from the perception of emotion-inducing stimuli: an fMRI study. NeuroImage. 2006;33(1):263–274. doi: 10.1016/j.neuroimage.2006.05.024. [DOI] [PubMed] [Google Scholar]
- 19.Liotti M, Mayberg HS. The role of functional neuroimaging in the neuropsychology of depression. J. Clin. Exp. Neuropsychol. 2001;23(1):121–136. doi: 10.1076/jcen.23.1.121.1223. [DOI] [PubMed] [Google Scholar]
- 20.van der Gaag C, Minderaa RB, Keysers C. Facial expressions: what the mirror neuron system can and cannot tell us. Soc. Neurosci. 2007;2(3–4):179–222. doi: 10.1080/17470910701376878. [DOI] [PubMed] [Google Scholar]
- 21.Rizzolatti, G. and M. Fabbri-Destro, Mirror neurons: from discovery to autism. Exp Brain Res, 2009. [DOI] [PubMed]
- 22.Iacoboni M, et al. Cortical mechanisms of human imitation. Science. 1999;286(5449):2526–2528. doi: 10.1126/science.286.5449.2526. [DOI] [PubMed] [Google Scholar]
- 23.Wicker B, et al. Both of us disgusted in My insula: the common neural basis of seeing and feeling disgust. Neuron. 2003;40(3):655–664. doi: 10.1016/S0896-6273(03)00679-2. [DOI] [PubMed] [Google Scholar]
- 24.Bastiaanse JA, et al. Age-Related Increase in Inferior Frontal Gyrus Activity and Social Functioning in Autism Spectrum Disorder. Biol Psych. 2011;69(9):832. doi: 10.1016/j.biopsych.2010.11.007. [DOI] [PubMed] [Google Scholar]
- 25.Gallese V., et al. Action representation and the inferior parietal lobule. In Attention & Performance XIX.CommonMechanisms inPerception and Action, ed.WPrinz, B Hommel, (2002) pp. 247–66. Oxford, UK: Oxford Univ. Press
- 26.Tzourio-Mazoyer N, et al. Automated anatomical labeling of activations in SPM using a macroscopic anatomical parcellation of the MNI MRI single-subject brain. NeuroImage. 2002;15(1):273–289. doi: 10.1006/nimg.2001.0978. [DOI] [PubMed] [Google Scholar]
- 27.Carr L, et al. Neural mechanisms of empathy in humans: a relay from neural systems for imitation to limbic areas. Proc Natl Acad Sci U S A. 2003;100(9):5497–5502. doi: 10.1073/pnas.0935845100. [DOI] [PMC free article] [PubMed] [Google Scholar]
- 28.Han S, et al. Neural processing of threat cues in social environments. Hum Brain Mapp. 2008;29(8):945–957. doi: 10.1002/hbm.20439. [DOI] [PMC free article] [PubMed] [Google Scholar]
- 29.Cacioppo JT, Gardner WL. Emotion. Annu. Rev. Psychol. 1999;50:191–214. doi: 10.1146/annurev.psych.50.1.191. [DOI] [PubMed] [Google Scholar]
- 30.de Waal FBW. Putting the altruism back into altruism: The evolution of Empathy. Annu. Rev. Psychol. 2008;59:279–300. doi: 10.1146/annurev.psych.59.103006.093625. [DOI] [PubMed] [Google Scholar]
- 31.Fogassi L, et al. Neurons responding to the sight of goal directed hand/arm actions in the parietal area PF (7b) of the macaque monkey. Soc. Neurosci. 1998;24:257.5. [Google Scholar]
- 32.Schmahmann JD. The role of the cerebellum in affect and psychosis. J Neurolinguist. 2000;13:189–214. doi: 10.1016/S0911-6044(00)00011-7. [DOI] [Google Scholar]
- 33.Schmahmann JD. Disorders of the cerebellum: ataxia, dysmetria of thought, and the cerebellar cognitive affective syndrome. J Neuropsychiatry Clin Neurosci. 2004;16(3):367–378. doi: 10.1176/appi.neuropsych.16.3.367. [DOI] [PubMed] [Google Scholar]
- 34.Schmahmann JD, Weilburg JB, Sherman JC. The neuropsychiatry of the cerebellum - insights from the clinic. Cerebellum. 2007;6(3):254–267. doi: 10.1080/14734220701490995. [DOI] [PubMed] [Google Scholar]
- 35.Leslie KR, Johnson-Frey SH, Grafton ST. Functional imaging of face and hand imitation: towards a motor theory of empathy. NeuroImage. 2004;21(2):601–607. doi: 10.1016/j.neuroimage.2003.09.038. [DOI] [PubMed] [Google Scholar]
- 36.Damasio AR, et al. Subcortical and cortical brain activity during the feeling of self-generated emotions. Nat. Neurosci. 2000;3(10):1049–1056. doi: 10.1038/79871. [DOI] [PubMed] [Google Scholar]