

Abstract
Objectives
To quantify the recovery of voice following a 2-hour vocal loading exercise (oral reading).
Methods
86 adult participants tracked their voice recovery using short vocal tasks and perceptual ratings after an initial vocal loading exercise and for the following two days.
Results
Short-term recovery was apparent with 90% recovery within 4-6 hours and full recovery at 12-18 hours. Recovery was shown to be similar to a dermal wound healing trajectory.
Conclusions
The new recovery trajectory highlighted by the vocal loading exercise in the current study is called a vocal recovery trajectory. By comparing vocal fatigue to dermal wound healing, this trajectory is parallel to a chronic wound healing trajectory (as opposed to an acute wound healing trajectory). This parallel suggests that vocal fatigue from the daily use of the voice could be treated as a chronic wound, with the healing and repair mechanisms in a state of constant repair. In addition, there is likely a vocal fatigue threshold at which point the level of tissue damage would shift the chronic healing trajectory to an acute healing trajectory.
Keywords: Vocal Fold, Fatigue, Recovery of Function
INTRODUCTION
Nearly one quarter of the U.S. workforce, or approximately 37 million individuals, depend on a healthy, versatile voice as a professional tool (Titze et al., 1997). These are individuals who, by losing vocal endurance and/or voice quality, would be negatively impacted in their ability to perform their primary job responsibility. Hereafter referred to as occupational voice users, they include professionals such as teachers, counselors, emergency dispatchers, ministers, air traffic controllers, and vocal performers. Of these groups, teachers have received the greatest amount of attention and their vocal health issues have been well documented (e.g., Laukkanen et al., 2008; Titze et al., 2007; Roy et al., 2004; Verdolini and Ramig, 2001; Sapir et al., 1993).
A common complaint of teachers and other occupational voice users is a tired voice, or vocal fatigue (Welham and Maclagan, 2003). Nevertheless, vocal fatigue has not yet received a universally accepted definition. In their review of vocal fatigue, Welham and Maclagan state that “a link between vocal fatigue and other laryngeal pathologies is plausible, [but] it is unclear whether vocal fatigue primarily contributes to, results from, or exists independently of other voice conditions” (emphasis added). Indeed, vocal fatigue is used by patients as a lay description of the symptoms of vocal overuse, and it is also used by practitioners as a clinical diagnosis of the result of these symptoms. Further, it is possible that there might be a genetic disposition for vocal fatigue (“tender larynx”), which would have a yet-undiscovered identifiable marker.
One possible means of exploring vocal fatigue is to examine its physiological source. Titze (1999) describes two such aspects of vocal fatigue. The first, laryngeal muscle fatigue, is potentially caused by the reduction in short-term strength and speed of contraction as the muscle chemistry is unbalanced by overuse and byproducts of muscle contractions need to be removed. The second, laryngeal tissue fatigue, is caused by temporary changes or damage to the lamina propria from phonation (i.e., vibration exposure); excessive damage is sometimes called phonotrauma.
One potentially significant source of laryngeal muscle fatigue is the amount of movement of these muscles (i.e., vocal fold posturing or adduction and abduction). In fact, phonation during everyday occupational voice use causes these muscles to engage more than 1800 times an hour (Titze et al., 2007). This type of muscle engagement might be compared to repetitive submaximal isotonic contractions in larger muscles, in which 90% muscle recovery is complete in about 20 minutes after fatigue from repeated contractions (e.g., Yates et al., 1987). While it is likely that laryngeal muscles would have similar fatigue and recovery, two differences exist which make such comparisons less straightforward. First, measuring laryngeal muscle fatigue is more invasive and more complicated because of its hard-to-reach location as well as its diminutive size (Boucher et al., 2006). Second, it is not clear that the behavior and characteristics of these muscles can be directly compared to larger skeletal muscles; for example, while larger skeletal muscles are usually slow twitch and fast fatiguing, laryngeal muscles are fast twitch and slow fatiguing because of their constant role in airway protection (e.g., Hunter and Titze, 2007). Nevertheless, fatigued laryngeal muscles may result in soreness, discomfort and/or muscle tension in the neck region. Further, if laryngeal muscles are fatigued, it would be reasonable that an increased effort would be needed to produce or sustain voicing, which might cause an increased number of voice breaks.
Laryngeal tissue fatigue likely stems from damage caused by vibration exposure of the vocal fold lamina propria. This type of fatigue is based on the engineering model of material fatigue, or a molecular breakdown of the material when it is subject to cyclic stress loadings. Tissue fatigue may be manifested in two ways. First, shear and collision stress during excessive phonation may cause epithelial cells to die and collagen and elastin fibers to separate from the structural matrix at the basement membrane (Gray and Titze, 1988). Second, inertial stress could cause fluid redistribution within tissue during phonation (Zhang et al., 2008) or strangulation of the vascular system with ultimate bursts of infused fluid by increased intravascular pressure (Czerwonka et al., 2008). Any of these potential sources of laryngeal tissue fatigue would likely change the biomechanical properties of the tissue (e.g., viscosity) and, therefore, cause a change in the tissue’s vibratory characteristics. The results of these tissue changes could be discomfort (pain or scratchy voice sensation) and/or a change in the viscoelastic properties of the tissue, which would shift the phonation threshold pressure and cause less stable vocalizations (e.g., increased voice breaks or instability).
Nevertheless, these potential causes of fatigue are still only speculative. With no clear definition or etiology of vocal fatigue, it has been difficult to identify which metrics could be used to consistently and accurately measure the occurrence or severity of fatigue. Many objective metrics have proven unsuccessful. For example, in a study to evaluate whether a vocal endurance test could be used to evaluate vocal fatigue, Buekers (1998) found that vocal fatigue could not be conclusively identified using self-ratings of pain and fatigue, electroglottography (EGG), standard acoustic metrics (i.e., the Multi-Dimensional Voice Program), or pitch/loudness measures (monitored throughout the day on a subset of subjects). Further, Laukkanen et al. (2008) studied the relation between reported vocal fatigue symptoms and acoustic variables in 79 female primary school teachers and found that neither acoustic parameters nor voice production type had real relevance to reported vocal fatigue; in addition, they observed that the acoustic parameters only seemed to reflect an increased muscle activity in response to extended vocal use. Finally, Boucher et al. (2006) noted signs of laryngeal muscle fatigue after systematic vocal loading but later found no correlating acoustic parameter (Boucher, 2008).
In contrast to these inconclusive objective metrics, certain perceptual ratings appear to capture some aspect of vocal fatigue. McCabe and Titze (2002) showed that subjective ratings of vocal effort and vocal quality seemed to track the effects of tissue loading and recovery as a continuum of vocal dysfunction. Their pilot study of four teachers suggested that vocal function mostly recovered in 2 hours after a vocal loading exercise, with residual recovery taking several days. Further, Chang and Karnell (2004) also seemed to successfully tract vocal function changes after a vocal loading exercise. In 10 subjects, phonation threshold pressure and speaking effort level ratings were found to increase significantly during a vocal loading exercise. Interestingly, phonation threshold pressure recovered almost immediately after the vocal loading activity was finished, while speaking effort level ratings stayed statistically elevated for about two hours afterwards. While McCabe and Titze (2002) and Chang and Karnell (2004) found success with a vocal effort rating, another perceptual method which may prove to be valuable is the inability to produce soft voice (IPSV, described in more detail below in methodology but initially introduced in Bastian et al., 1990). In this self-evaluation task, subjects attempt to produce a specific soft, high-pitched vocal task and rate their ability to produce it. The IPSV might prove distinctly useful because, while it is a perceptual self-rating, it is based on the ability to complete a task (a vocal output) rather than just an internal sensation (e.g., sensation of effort).
In a pair of studies, Carroll et al. (2006) and Hunter (2008) explored the possibility of finding a rating which would be simple and easy to administer, but which would still correlate well with fatigue symptoms. In these studies, three ratings were used to track the current vocal state after vocal loading events. Two of these ratings were adapted from the above three studies: [1] current speaking effort level (EFFT) based on McCabe and Titze (2002) and Chang and Karnell (2004); and [2] a modified IPSV task/rating adapted from Bastian et al. (1990). The third rating, a laryngeal discomfort measure (DISC), was used to parallel the three types of questions (i.e., emotional, functional, and physical) found in the widely used Vocal Handicap Index (Jacobson et al., 1997).
These two studies suggested that the three ratings could be used to capture and track potential symptoms of vocal loading discussed by Sapir et al. (1993) using: [1] objective performance (i.e., frequency of vocal breaks); [2] subjective discomfort (i.e., throat discomfort); and [3] subjective general effort. First, Carroll et al. (2006) used the National Center for Voice and Speech Voice Dosimeter (Popolo, et al., 2005) to track voice use in a pilot study of 7 classical singers; the dosimeter allowed the subjects to simultaneously log the three ratings throughout the study. The ratings changed on the day there was significant voice loading (as indicated by the Voice Dosimeter). In addition, the IPSV and EFFT peaked 24-72 hours after high voice loading. Second, Hunter (2008) examined the stability of the three ratings by calculating their distribution from repeated measures (13,857 rating events) using 51 subjects over two weeks. He showed that the distribution of IPSV was normal and slightly skewed for EFFT and DISC. The ratings were also shown to be moderately correlated. These results might mean that the ratings are tracking different physiological processes from the same vocal event but with some cross-over. On the other hand, it is possible this correlation might stem from one subject identifying a particular symptom as perceived increased discomfort, with another identifying the same symptom as perceived increased vocal effort.
Another possible method of tracking the effects of vocal loading is based on the previously discussed hypothesis that vocal fatigue from excessive phonation is caused in part by a temporary tissue damage (Titze, 1999). If true, then this damage is likely focused in the epithelium and lamina propria of the vocal folds (Gray and Titze, 1988) and, therefore, studies examining general dermal wound healing might be used to understand the lamina propria vibration fatigue-recovery cycle. Generally, dermal wound healing is described as having three phases: “inflammation, extracellular matrix (ECM) deposition and epithelialization, and remodeling” (Branski et al., 2006). In an extensive review of wound healing, Robson et al. (2001) described the overall effects of these phases in terms of dynamic healing trajectories (healing time curves), which integrate each of the individual healing phases into a continuum of the wound healing process. Further, two kinds of wound healing/recovery trajectories were discussed: [1] acute wounds (e.g., a sutured incision), which recover in an exponential fashion (Fig. 1: right); and [2] chronic wounds (e.g., a pressure ulcer), which recover in a sigmoid fashion (Fig. 1: left). Systemic and local factors (e.g., infection or continued injury) deter wound healing, effectively prolonging overall healing time.
Figure 1.

Stylized trajectories showing the overall wound healing recovery for [left] chronic and [right] acute wounds.
The validity of applying these patterns to vocal loading-recovery is demonstrated by Branski et al. (2006), in which the wound healing phases are used to tutor vocal health professionals about various sources of phonotrauma and consequent vocal recovery. Further, several vocal fold studies have examined individual phases of this multistage wound healing process; for example, biomechanical markers associated with wound healing have been detected in induced phonotrauma in animals (e.g., Rousseau et al., 2007) and humans (e.g., Verdolini et al., 2003). Nevertheless, although studies such as these, as well as Branski’s review, are all valuable steps in understanding the mechanisms of vocal healing, they do not address the overall vocal wound healing cycle (i.e., loading-recovery) in terms of a recovery trajectory with quantifiable time constants that could be predictable for a voice user.
In summary, the body of scientific literature has not yet reached a clear consensus on what vocal fatigue is. Neither has an objective metric been universally accepted, with perceptual-based ratings being the most feasible existing method to successfully track or quantify the effects of vocal loading events. Theoretically, tissue changes or damage in the vocal folds because of vibration exposure could result in laryngeal discomfort, more frequent voice breaks, or in an increased inability to produce a soft voice. The IPSV and DISC ratings would likely note such changes and/or damage. However, because the voice is an adaptable system, increased laryngeal control and effort with proper breath support may produce a quality soft voice even with compromised tissue. In such a situation, the EEFT rating would note the increased effort the subject needs to produce the soft voice task. These ratings presumably would correlate with the wound healing trajectory (e.g. inflammation).
In the current study, we will not attempt to further define vocal fatigue. Instead, we have assumed that the focus of the current study, laryngeal tissue fatigue, is one of at least two primary aspects of the presently ill-defined general description, vocal fatigue. Using this assumption, we will explore vocal health issues which might result from an overused or under-recovered voice, as caused by repeated vocal fold posturing or excessive tissue vibration (i.e., vocal loading). The following three hypotheses are addressed in the current study: [1] specific vocal tasks and self-perception measures can be used to track laryngeal tissue fatigue if we focus on the acute lamina propria changes like swelling and recovery to baseline; [2] the recovery of this rating will follow generic dynamic wound recovery trajectories with embedded time constants; and [3] vocal tissue fatigue can be described in the context of wound healing, with occupational voice users perceiving fatigue and recovery as an integrated continuum.
METHODS
Elementary and secondary school teachers (21 males and 66 females, reflecting the U.S. public school female teacher population of about 80%) of a variety of experience, classrooms, and ages were recruited to participate in a larger voice study at the NCVS. To begin the study, the teacher needed to be off track (i.e., having not taught for the previous 3 weeks) to provide a pre-study vocally unstressed period. While off track, all teachers completed a laryngostroboscopic exam, a variety of vocal questionnaires (e.g., Vocal Handicap Index, Jacobson et al., 1997; and Vocal Health Questionnaire, adapted from Sapir et al., 1996), and an extensive acoustic analysis to screen out any who had current voice or speech pathologies. As part of this vocal screening, each teacher was asked to perform a two-hour vocal loading exercise (i.e., oral reading) away from the voice clinic and laboratory, followed by a series of simple voice tasks and self-ratings to track any changes to her/his voice. Only teachers who passed this vocal health screening (as judged by our on-site clinical staff) were allowed to participate. The pre-loading baseline measure (described below) and the recovery portion of the data, which consisted of the subsequent voice tasks and self-ratings, were used to address the current study’s three hypotheses described above.
VOCAL LOADING EXERCISE
Each teacher was asked to complete a vocal loading exercise within two days after the initial voice exam. The exercise consisted of reading out loud from a book for two hours with the specific instructions: “Keep your volume commensurate with your teaching voice loudness.” This length of time was chosen based on Titze et al. (2007), who illustrated that a teacher vocalizes on average 23% of their time at work, or approximately 110 minutes each day. Before beginning the exercise, and every fifteen minutes while reading, the teachers were asked to pause and perform three short vocal tasks and perceptual ratings (from Carroll et al., 2006; and Hunter, 2008; described in more detail below). The first two of these ratings for a subject (0 min. and 15 min.) together became the assumed baseline for a subject. After completing the vocal loading exercise, the teachers were asked to repeat the same self-rating task every two hours throughout the remainder of the day until bedtime (Recovery Day 1). During the following two days (Recovery Day 2 and Recovery Day 3), teachers were asked to perform the same self-rating task every two hours, beginning at the time they woke up and continuing until they went to bed.
Conducting the vocal loading exercise in the voice laboratory might have provided a more controlled study. However, we chose to conduct it outside the laboratory for two reasons. First, we wanted the teachers to complete the vocal loading exercise in the least artificial setting to approximate the vocal fatigue environment from a regular day of teaching. Second, because of the large time commitment which the larger study already required, it was a priority to reduce each teacher’s time commitment in the voice laboratory (the comprehensive voice evaluation alone usually took about two hours).
PERCEPTUAL RATING
Every two hours after the vocal loading exercise, the teachers were asked to continue to self-monitor the signs of vocal changes through the same short vocal tasks and perceptual ratings. These three ratings, discussed in Hunter (2008), were also used in the current study: [1] current speaking effort level (EFFT, 1-10 scale; 1 for no effort, 10 for an extreme effort to speak); [2] inability to produce soft voice (IPSV, evaluated on a 1-10 scale, 1 used for unproblematic soft voice, 10 for extreme problems with producing a specific soft voice task; see Appendix for specific vocal task and instructions); and [3] laryngeal discomfort (DISC, 1-10 scale; 1 for no discomfort, 10 for extreme discomfort). Teachers were trained in the ratings at the voice laboratory and were sent home with a review CD. Written instructions (Appendix) and rating forms were also sent with the teachers along with a pre-metered return envelope.
As mentioned above, Hunter (2008) indicated that there was not only some independence, but also considerable correlation, between the three ratings. Further, as also discussed above, it is possible that the laryngeal system is able to compensate for weaknesses in one aspect of a compromised system. Thus, a combined average of the three was used as an indicator of a general vocal fatigue index. This combined, cumulative rating allowed us to track vocal loading recovery regardless of how the overuse was perceived by the subject.
ANALYSIS
The rating data for each teacher were analyzed using scripts written in MATLAB. All data were time normalized so that the start time of recovery began at the end of the vocal loading exercise. Further, because some teachers used a larger portion of the 10-point scale than others, the range of ratings were normalized to increase consistency across teachers. This was done in three steps: [1] scale each teacher’s rating data to the whole by finding the mean and standard deviation of the ratings across all teachers across all days; [2] scale each teacher’s individual data points to match the standard deviation for a teacher’s rating to the overall standard deviation, shifting the teacher’s individual data points so that each mean matched the overall mean; and [3] scale the overall data set to fill the 10-point scale as a whole.
With this adjustment, the data were analyzed using the following post vocal loading time segmentations: [1] Recovery Day 1 (remainder of the day post vocal loading); [2] Recovery Day 2; [3] Recovery Day 3; [4] Combined Recovery Day 2 and Recovery Day 3, or Combined Recovery Days; and [5] Overall Recovery Time. For each time segmentation, a linear slope was fit to each teacher’s rating sets. Group statistics of each of these slopes (e.g., mean, median, and standard deviation) were made across all teachers. Using these slope values from a simple linear regression model of recovery, a predicted time for return to baseline (or predicted time of recovery) for both Recovery Day 1 and Overall Recovery Time was calculated for each teacher and across all teachers.
Analysis focused on quantifying the correlation between the three ratings (i.e., IPSV, EFFT, and DISC) and the five different time segments (i.e., Recovery Day 1; Recovery Day 2; Recovery Day 3; Combined Recovery Days; Overall Recovery Time). Analysis was conducted for each teacher individually and as a group.
EXCLUSION OF DATA IN THE ANALYSIS
Two exclusion criteria were used. First, a teacher’s ratings were excluded if he/she did not use more than a 2-point range over the entire 3-day rating time. This exclusion criterion was necessary to eliminate those teachers who may not have fatigued and, thus, for whom recovery would not be necessary. Alternately, this criterion would eliminate those teachers who either were not compliant with study protocol or who did not recognize voice changes. In either case, the data would not be reliable. Second, a teacher’s ratings were excluded if she/he had increasingly worse ratings over Combined Recovery Days. This criterion removed any teachers who likely had other significant vocal loading experiences during the recovery period. For example, one teacher reported that she had spent the afternoon/evening of Recovery Day 2 at a wedding and had used her voice a lot in the loud environment of the reception. However, because some teachers would likely not have reported such activities during the recovery days, this criterion allowed us to eliminate all such teachers whether they provided information or not. Using these criteria, 15 teachers involved in the vocal loading exercise were excluded from the present analysis, leaving the data from 72 teachers (54 females; 18 males) to be analyzed.
RESULTS AND DISCUSSION
Fig. 2 illustrates two general types of post vocal loading responses, as seen in two teachers. The first type of response seemed to be the most prevalent and is exemplified in Subject M057, Fig. 2.a. This response is characterized by a general improvement of the voice (after fatigue) on Recovery Day 1 and lasting over Recovery Day 2 and Recovery Day 3. There may in fact be a warm-up effect (particularly in the IPSV) on Recovery Day 2 and then a worsening effect later in the day. This warm-up effect, or an improvement of the first few ratings in a day, appears to take place even during the gradual recovery of the voice over the three days. A less common type of response is characterized by the voice being rated continually worse in the hours after the vocal loading exercise (e.g., Subject F072, Fig. 2.b). It is possible that these worsening ratings may result from a delayed onset of slight swelling, similar to what was reported by Verdolini et al. (2003). Further, this teacher’s ratings may point to the importance of sleep (or perhaps complete vocal rest) as the teacher’s results suggest near full recovery had been reached by the beginning of Recovery Day 2.
Figure 2.

Typical results of all three ratings shown for two teachers; (a) male teacher and (b) female teacher.
Table I illustrates the correlation between the ratings for all teachers across the entire recovery time and at specific intervals. Generally, EFFT and DISC ratings had the highest correlation. Further, all ratings were most correlated on Recovery Day 1, when the most dramatic recovery took place (to be shown later). While each of the three ratings track vocal recovery, the moderate correlation between the three ratings for Recovery Day 2 and Recovery Day 3 might indicate as suggested previously by Hunter (2008) that they quantify different symptoms or aspects of the vocal recovery process which may not be found in combination in a particular individual.
Table I.
Each teacher’s three rating types inner correlation were calculated and the across-teacher mean and median of correlation coefficient were listed below. The highest average and median correlation for a time frame is shown in bold
| Time Segment | IPSV vs Effort | Effort vs Discomfort |
Discomfort vs IPSV |
|
|---|---|---|---|---|
| Same Recovery Day | mean | 0.81 | 0.86 | 0.80 |
| median | 0.94 | 0.95 | 0.88 | |
| 1st Recovery Day | mean | 0.59 | 0.69 | 0.56 |
| median | 0.71 | 0.76 | 0.71 | |
| 2nd Recovery Day | mean | 0.62 | 0.59 | 0.58 |
| median | 0.75 | 0.73 | 0.66 | |
| Combined Recovery Days | mean | 0.57 | 0.63 | 0.56 |
| median | 0.61 | 0.71 | 0.63 | |
| Overall Recovery Time | mean | 0.69 | 0.76 | 0.68 |
| median | 0.75 | 0.86 | 0.71 |
Figure 3 isolates the IPSV ratings for a separate male and female teacher over Overall Recovery Time. In this figure, Recovery Day 1, Recovery Day 2, and Recovery Day 3 were marked (box) and the general linear recovery slope of Overall Recovery Time was plotted versus participation time. The recovery slope for each teacher in Fig. 3 increased for Recovery Day 2, which means that the teachers rated symptoms of vocal fatigue as progressively worse one day after the fatiguing activity. However, Overall Recovery Time slope values for each of these teachers simultaneously indicate a general recovery towards baseline. This common finding in almost all of the teachers in the current study may demonstrate a pattern in occupational voice users who continue to use their voice before recovery is complete. For example, if we examine Recovery Day 1, Recovery Day 2 and Recovery Day 3 in Fig. 3b individually, the IPSV actually slopes up while the overall slope of Recovery Day 2 is down. Therefore, there was overall recovery by the end of Recovery Day 3; nevertheless, within a day, the voice worsened as vocalization occurred.
Figure 3.
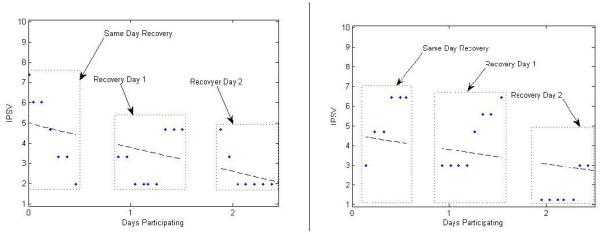
Two examples of the Overall Recovery Time IPSV ratings. Linear slope of the entire measurement time is shown.
Figure 4 shows the unadjusted data for the ratings of all subjects included in the current study. Because each subject’s data had not yet been expanded to range from 1-10, it would be difficult to determine the general trend of the data without the representative trend line (solid bold) on the figure. The average baseline (i.e., the first two ratings taken during the vocal loading exercise, 0 min. and 15 min.) is represented by the dotted line. Figure 5 contains the adjusted data contained in Fig. 4. With this adjusted data, the general trend of vocal improvement (i.e., downward slope of the ratings) is more apparent without the trend line.
Figure 4.
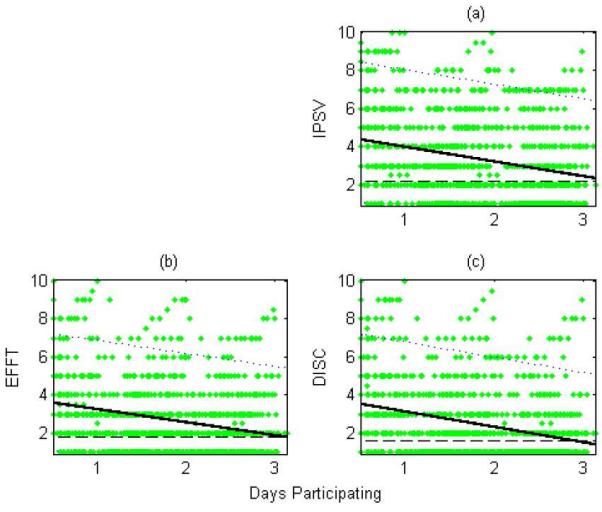
The cumulative raw ratings from each teacher plotted together over the Overall Recovery Time. Dots indicate individual ratings. Solid lines represent the linear slope with parallel dotted lines indicating the 95% confidence interval. The dashed line at the bottom represents the average baseline rating.
Figure 5.
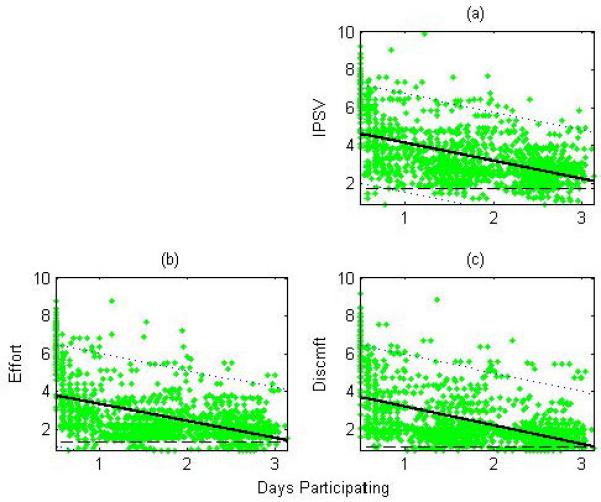
The cumulative scaled ratings from each teacher plotted together over the Overall Recovery Time. The average baseline value and slope are also illustrated similar to Figure 4.
Recovery Day 1 data consists of post-loading ratings from the same day as the vocal loading exercise. These ratings (for all subjects) are shown in Fig. 6. Note that during Recovery Day 1, 8 of the 72 subjects started the vocal loading exercise late enough in the day that there were less than 3 recovery points. For these subjects, their data were not used in calculating slope values for that time period (N=64 in Tables II-V). Using the recovery slopes (linear trend lines) for each teacher, Table II was calculated, listing the mean and standard deviation of the individual slope values across all of the teachers. To account for the potential effect of outliers on the average slope, the median slope across teachers was also obtained (Table III). Using a similar approach, individual subject rating slope values were also obtained for Recovery Day 2, Recovery Day 3, and Combined Recovery Days. Note that the median slope of Recovery Day 2 and Recovery Day 3 individually is essentially zero while the median slope of Combined Recovery Days is not. While there was little recovery during a post-loading recovery day, larger recovery is seen between the two days, suggesting recovery is likely occurring at night during sleep.
Figure 6.
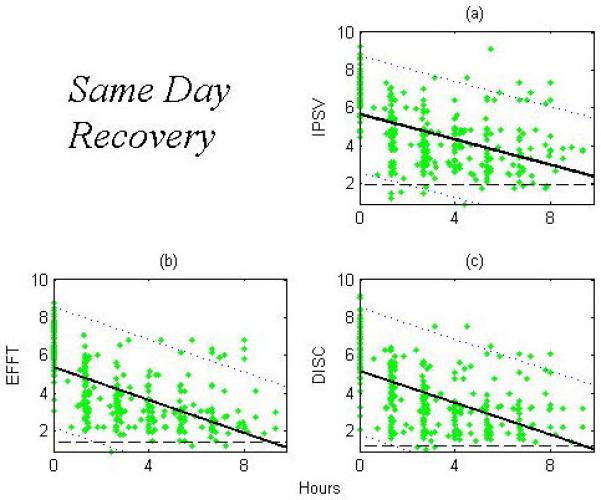
The scaled ratings for each teacher for the ratings occurring during Same Recovery Day. The average baseline value and slope are also illustrated similar to Figure 4
Table II.
Average slope, in rating change per hour, and the standard deviation (±) across all subject are listed under the respective rating. The number of subjects used in the calculation is also listed
| IPSV | EFFT | DISC | N | |
|---|---|---|---|---|
| Same Recovery Day | −0.41±0.35 | −0.50±0.40 | −0.44±0.37 | 64 |
| 1st Recovery Day | −0.019±0.16 | 0.011±0.15 | −0.010±0.14 | 72 |
| 2nd Recovery Day | −0.021±0.10 | −0.016±0.14 | −0.0070±0.12 | 72 |
| Combined Recovery Days | −0.018±0.052 | −0.0090±0.047 | −0.016±0.062 | 72 |
| Overall Recovery Time | −0.060±0.070 | −0.063±0.12 | −0.063±0.091 | 72 |
Table V.
Predicted recovery times assuming a linear recovery model for Same Recovery Day and Overall Recovery Time. Recovery time is in hours [days]. Median and first and third quartile times are shown
| Predicted Hours [Days] to Full Recovery | Baseline Rating | N | |||
|---|---|---|---|---|---|
| Ql | Median | Q2 | Median | ||
|
Same
Recovery Day |
5.82 [0.243] |
8.84
[0.368] |
12.3 [0.513] |
1.41 | 64 |
|
Overall
Recovery Time |
45.5 [1.89] |
55.9
[2.33] |
3.02 [72.5] |
1.41 | 72 |
Table III.
Median slope, in rating change per hour across all subject are listed under the respective rating.
| IPSV | EFFT | DISC | N | |
|---|---|---|---|---|
| Same Recovery Day | −0.40 | −0.50 | −0.42 | 64 |
| 1st Recovery Day | −0.011 | 0 | 0 | 72 |
| 2nd Recovery Day | 0 | 0 | 0 | 72 |
| Combined Recovery Days | −0.016 | −0.0030 | −0.010 | 72 |
| Overall Recovery Time | −0.045 | −0.041 | −0.052 | 72 |
Tables II and III were calculated from individual subjects’ slope values for a specific time segment. However, by combining all of the ratings for all subjects for each of these time segments, the recovery of vocal rating seems more apparent. All data from all subjects were combined together and the rate of change (slope) was calculated. Table IV lists the overall slope for each rating and time segment as well as the combined overall slope (COMB) when all subject ratings are combined. For Recovery Day 1, IPSV seems to recover at the slowest rate (0.20 points per hour for IPSV vs. 0.25 points per hour for DISC and EFFT). Figure 6 illustrates these slight differences, where the linear slope line for both the EFFT and DISC ratings crosses the average baseline within the time segment even though the IPSV does not. However, given that these differences are small, it is possible that they may stem from uncertainty in the dataset.
Table IV.
Overall slope, in rating change per hour, for all ratings individually (combined across teachers) and for all ratings combined (COMB)
| COMB | IPSV | EFFT | DISC | N | |
|---|---|---|---|---|---|
| Same Recovery Day | −0.23 | −0.20 | −0.25 | −0.25 | 64 |
| 1st Recovery Day | −0.0050 | −0.021 | 0.012 | −0.0050 | 72 |
| 2nd Recovery Day | −0.0080 | −0.018 | −0.0070 | 0.0020 | 72 |
| Combined Recovery Days | −0.017 | −0.022 | −0.011 | −0.019 | 72 |
| Overall Recovery Time | −0.041 | −0.041 | −0.038 | −0.042 | 72 |
The greatest slopes of rating recovery occurred on Recovery Day 1 (−0.23 per hour for the combined slope). The average slopes for Recovery Day 2 and Recovery Day 3 individually were essentially 0 (−0.005 and −0.008 per hour), and often the median slope for those days were 0 for all ratings. However, while most of the recovery was completed in the first day, there was a small residual recovery that appeared to occur if Recovery Day 2 and Recovery Day 3 were joined together (Combined Recovery Days, −0.017 per hour). No gender differences between any of the metrics were found to be significant (p=0.05, 2 tailed t-test).
Using the linear regression model of the ratings, a predicted time of recovery to baseline can be calculated. Given the slope of Recovery Day 1 (0.43 per hour across all teachers, Table III) and assuming that this recovery pattern continued, full recovery from the vocal loading exercise would be completed in about 9 hours for all teachers (Table V). By using the same method to predict a return to baseline for Overall Recovery Time slope, teachers appeared to fully recover after about 2.3 days. As the range of predicted recovery times was large, the median was used in this calculation to alleviate the effect of outliers. The skewing of the distribution of recovery time can be seen in the first and third quartile score. Thus, if we used a linear model and if this recovery rate were maintained, short-term recovery would occur in about 9 hours while the longer term recovery would occur in about 2.3 days.
Figure 7 shows a healing trajectory, calculated by inverting the cumulative ratings for all teachers and then scaling them between 0 and 100 percent. These data were fit to a 4th-order polynomial, an exponential with a residual slope, a straight exponential function (commonly used to model muscle fatigue recovery and chronic healing curves), and a sigmoid function (commonly used for modeling acute healing curves). Each fit had a correlation coefficient fit to the data of between 0.709-0.735 (a likely inconsequential difference in light of other experimental uncertainties), with the two exponential fits being the highest. The sigmoid curve, when optimized to the data, resulted in a curve where the sigmoid’s characteristic ‘s’ shape was de-emphasized. Looking only at the curves, an 80% recovery occurred within the first 5-8 hours after the vocal loading exercise; a small, residual recovery occurred over the following days. These results can be compared to those of McCabe and Titze (2002), in which the “effort” rating of 4 teachers mostly returned to baseline in 2 hours after a vocal loading exercise with the residual recovery taking several days.
Figure 7.
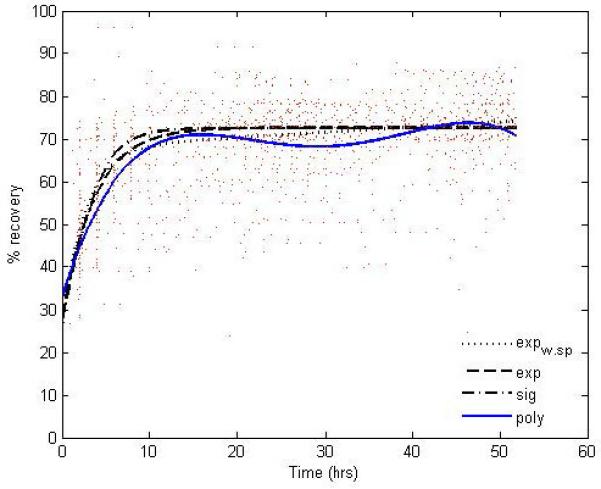
Vocal recovery as a healing trajectory. Majority of recovery (80%) occurring in the first 5-8 hours after the fatiguing task.
The sigmoid, polynomial and exponential curves to the recovery trajectory resulted in very similar representations of the full recovery. Comparing the vocal wound recovery trajectories from vocal fatigue as elicited in this study to the two types of wound healing trajectories described by Robson et al. (2001), we see a trajectory similar to the chronic wound recovery. This result is not unexpected. An occupational voice user by necessity uses his/her voice every day; thus, damage is likely continually occurring, creating a chronic wound. However, it is also likely that if the intensity of the vocal load reached a certain level, particularly without the necessary vocal recovery time, an acute wound would at some point be manifest. Such an example of acute phonotrama might be what we see in Fig. 2b and 3b. Here, Recovery Day 1 did not slope in the recovery direction. It is possible that these slopes parallel the results shown by Verdolini et al. (2003), where biochemical markers of swelling showed an increase at 10 and 20 minutes after a 1-hour oral phonation task. It is likely that such post vocal use swelling would increase both IPSV and perhaps EFFT ratings. However, because post vocal loading ratings in the current study occurred at 2-hour time increments, such swelling may have already begun to subside at 2 hours post loading in most of the subjects and, thus, may not have been evidenced in the ratings.
Further, exponential curves may be quantified by a time constant, which is the time it takes for the curve to drop to 37% from starting value. Applying that definition to all four curves would give the mean time it would take for the average subject’s rating to recover 63 percent to baseline. For the current subjects, the result is 3.7±0.9 hrs.
In summary, those persons whose vocal healing follows a chronic recovery trajectory have likely experienced vocal fatigue. On the other hand, those persons whose vocal healing follows an acute wound recovery trajectory may have experienced a phonotrama where additional vocal damage from vocal loading would require more extensive recovery. Indeed, Branski et al. (2006) suggests that a precurser to acute phonotrama is vocal fatigue. Thus, it is likely that, when vocal fatigue is experienced in a moderate and repeated fashon (e.g., every day or every weekday), the voice would have the opportunity to completely recover at night or over a vocally reduced weekend. However, regular vocal fatigue may leave an occupational voice weakened and susceptible to phonotrauma. This phonotrauma may result from a period of significant vocal loading or from the accumulation of residual slow recovery. In either situation, a typical vocal rest (e.g., weekend) may not be adequate. Thus, it is likely that without additional reduced vocal load (or rest) and behavior modification, there would be a risk for a more severe vocal injury. There may be some hint of this pattern in the recovery trajectory, in which a secondary peak can be seen about 28 hours post loading. This secondary peak may also indicate a second, more involved repair mechanism when more severe vocal damage occurs.
The above results also shed light on the observation of Carroll et al. (2006): [1] spikes in vocal load were reflected in a worsening of subjective ratings on the same day as well as a delayed secondary worsening around 24-72 hours later; and [2] improved subjective evaluations were seen after the loading activity when at least 48 hours of vocal rest occurred before a vocal load. It is possible that there could be two mechanisms at play here. First is the dramatic, short-term recovery which primarily takes place in the few hours post vocal loading. It may be the result of muscle recovery or minor fluid redistribution in the tissue (i.e., lamina propria). Second is the delayed recovery from acute damage to the vocal tissue, with peak changes to the voice (likely caused by some process in the dermal repair) occurring approximately 28 hours post vocal loading. Nevertheless, without further studies these propositions are purely speculative.
One limitation of the current study was the lack of a laboratory-controlled environment for the vocal loading exercise; however, as described above, we believe the advantages of the subjects doing this exercise away from the performance setting of the clinical environment compensate for this limitation. In addition, no control or monitoring (besides the ratings and some basic comments by the teachers) could be done during the recovery period. Teachers were trusted to be compliant with the instructions they were given. In an attempt to compensate for these two factors, some teachers were excluded from the analysis as discussed above. Other limitations not accounted for in the current study that may have affected the results were hydration, food intake (i.e., reflux component), or hormonal fluctuations in females (i.e., menses, pregnancy, perimenopause, menopause; as discussed in, for example, Abitbol et al., 1999). Further, we assumed that our self-perception ratings (especially IPSV which relates to vocal fold swelling) correlates with laryngeal tissue fatigue, but we did not control for potential crossover of various laryngeal muscle fatigue, the other aspect of vocal fatigue we have discussed. Thus, it is possible that some aspects of laryngeal muscle fatigue would also affect our self-perception ratings to some degree. At this point we don’t know which, if any, of the ratings would correlate to a specific type of fatigue. Even with ideal training and instruction, we cannot rule out that one subject used little vocal effort resulting in a high IPSV rating where another subject used a lot of effort giving a low IPSV rating. In such a situation, either might have been at an identical place in the recovery trajectory but had very different ratings. Therefore, at this point, we suggest only the cumulative rating be used with any degree of confidence.
CONCLUSIONS
For the current study, we assumed that laryngeal tissue fatigue is one of two primary aspects of the nebulous general description, vocal fatigue (the other being laryngeal muscle fatigue). The results from 72 teachers who participated in a two-hour vocal loading (oral reading) exercise were presented above. Because the diagnosis of vocal fatigue is largely a subjective phenomenon, their recovery from this vocal loading exercise was tracked using a short vocal task and 3 self-administered, perceptual ratings (Hunter, 2008). Fifty percent recovery occurred within 4-6 hours; 90 percent recovery occurred within 12-18 hours.
Key to understanding vocal fatigue was that the apparent vocal healing trajectory curve shape was very similar to chronic dermal wound trajectories, rather than to acute dermal wound trajectories (Robson et al., 2001). This similarity provides valuable information on the pattern of vocal fatigue recovery, suggesting that vocal fatigue is comparable to a chronic dermal wound. Thus, with daily use of the voice, there is continual damage and the healing mechanism is in a state of constant repair, even for non-diagnosed pathologies such as laryngitis or vocal mass.
Furthermore, it is probable that a more intense vocal loading exercise would result in greater fatigue and, thus, damage (e.g., increased post vocal load swelling), which would then extend the necessary healing time. Such a healing trajectory would likely look more like the acute wound trajectory. However, a more intense vocal loading exercise that would create such damage, which might be of more interest for healthcare providers than for preventative vocal training, should be very controlled with post-fatigue vocalizations kept to a minimum.
While the rating tasks described in this study are easy to use and show promise in tracking vocal recovery, their validity must be verified through additional studies of tissue damage or vocal fold swelling. However, such future studies will be hampered by the current lack of consensus on the definition or etiology of vocal fatigue. Further, the poor accessibility of the vocal folds impairs the ability to objectively monitor the physiological byproducts of vocal loading tasks. Nevertheless, potential metrics of tissue damage, though somewhat invasive, are being developed. For example, Verdolini et al. (2003) measured the increase of several inflammatory indicators on the vocal folds after a vocal loading exercise by swabbing the vocal folds. Such studies with repeated objective physiological measures following a vocal loading exercise could be compared to the subjective ratings to refine their accuracy.
If the etiology of vocal fatigue were better defined, a quick repeatable diagnostic tool (such as the three-part tool used in the current study) could be developed and verified. Such a tool could be used to regulate voice use when symptoms of moderate tissue injury from phonation first present themselves. For example, with minor amounts of vocal fold inflammation and discomfort, it is possible to still produce vocalizations by driving the vocal folds with the respiratory system. However, this would likely further damage tissue and could eventually shift the healing trajectory from a chronic to an acute recovery trajectory. Thus, an occupational voice user could use a diagnostic tool to identify the early signs of vocal fatigue symptoms and be taught to adjust her/his voice use to reduce vocal loading. The tool could also be used to track vocal therapy progress and monitor recovery so moderately damaged tissues would not be further affected.
Supplementary Material
ACKNOWLEDGMENTS
Funding for this work was provided by the National Institute on Deafness and Other Communication Disorders, grant number 1R01 DC04224. The authors would like to thank the research team (both past and present) at the National Center for Voice and Speech with many supporting roles in this work. Thank you to Laura M. Hunter for data entry work and for the technical review.
Support: NIDCD R01-DC004224
REFERENCES
- Abitbol J, Abitbol P, Abitbol B. Sex hormones and the female voice. J.Voice. 1999;13(3):424–446. doi: 10.1016/s0892-1997(99)80048-4. [DOI] [PubMed] [Google Scholar]
- Bastian RW, Keidar A, Verdolini-Marston K. Simple vocal tasks for detecting vocal fold swelling. J.Voice. 1990;4(2):172–183. [Google Scholar]
- Boucher VJ, Ahmarani C, Ayad T. Physiologic features of vocal fatigue: electromyographic spectral-compression in laryngeal muscles. Laryngoscope. 2006;116(6):959–965. doi: 10.1097/01.MLG.0000216824.07244.00. [DOI] [PubMed] [Google Scholar]
- Boucher VJ. Acoustic correlates of fatigue in laryngeal muscles: findings for a criterion-based prevention of acquired voice pathologies. J.Speech Lang Hear.Res. 2008;51(5):1161–1170. doi: 10.1044/1092-4388(2008/07-0005). [DOI] [PubMed] [Google Scholar]
- Branski RC, Verdolini K, Sandulache V, Rosen CA, Hebda PA. Vocal fold wound healing: a review for clinicians. J.Voice. 2006;20(3):432–442. doi: 10.1016/j.jvoice.2005.08.005. [DOI] [PubMed] [Google Scholar]
- Buekers R. Are voice endurance tests able to assess vocal fatigue? Clin.Otolaryngol.Allied Sci. 1998;23(6):533–538. doi: 10.1046/j.1365-2273.1998.2360533.x. [DOI] [PubMed] [Google Scholar]
- Carroll T, Nix J, Hunter E, Emerich K, Titze I, Abaza M. Objective measurement of vocal fatigue in classical singers: A vocal dosimetry pilot study. Otolaryngol.Head Neck Surg. 2006;135(4):595–602. doi: 10.1016/j.otohns.2006.06.1268. [DOI] [PMC free article] [PubMed] [Google Scholar]
- Chang A, Karnell MP. Perceived phonatory effort and phonation threshold pressure across a prolonged voice loading task: a study of vocal fatigue. J.Voice. 2004;18(4):454–466. doi: 10.1016/j.jvoice.2004.01.004. [DOI] [PubMed] [Google Scholar]
- Czerwonka L, Jiang JJ, Tao C. Vocal nodules and edema may be due to vibration-induced rises in capillary pressure. Laryngoscope. 2008;118(4):748–752. doi: 10.1097/MLG.0b013e31815fdeee. [DOI] [PMC free article] [PubMed] [Google Scholar]
- Gray S, Titze I. Histologic Investigation of Hyperphonated Canine Vocal Cords. Ann.Otol.Rhinol.Laryngol. 1988;97(4):381–388. doi: 10.1177/000348948809700410. [DOI] [PubMed] [Google Scholar]
- Hunter EJ, Titze IR. Refinements in modeling the passive properties of laryngeal soft tissue. J.Appl.Physiol. 2007;103(1):206–219. doi: 10.1152/japplphysiol.00892.2006. [DOI] [PubMed] [Google Scholar]
- Hunter EJ. NCVS Memo No 11. General Statistics of the NCVS Self-Administered Vocal Rating (SAVRa) 2008 http://www.ncvs.org/ncvs/library/tech.
- Jacobson BH, Johnson A, Grywalski C, Silbergleit AK, Jacobson GP, Benninger Michael S., Newman CW. The voice handicap index (VHI): development and validation. American Journal of Speech-Language Pathology. 1997;6(3):66–70. [Google Scholar]
- Laukkanen AM, Jarvinen K, Artkoski M, Waaramaa-Maki-Kulmala T, Kankare E, Sippola S, Syrja T, Salo A. Changes in voice and subjective sensations during a 45-min vocal loading test in female subjects with vocal training. Folia Phoniatr.Logop. 2004;56(6):335–346. doi: 10.1159/000081081. [DOI] [PubMed] [Google Scholar]
- Laukkanen AM, Kankare E. Vocal loading-related changes in male teachers’ voices investigated before and after a working day. Folia Phoniatr.Logop. 2006;58(4):229–239. doi: 10.1159/000093180. [DOI] [PubMed] [Google Scholar]
- Leanderson R, Sundberg J, von Euler C. Breathing muscle activity and subglottal pressure dynamics in singing and speech. J.Voice. 1987;1(3):258–261. [Google Scholar]
- McCabe DJ, Titze IR. Chant therapy for treating vocal fatigue among public school teachers: a preliminary study. American Journal of Speech-Language Pathology. 2002;11:356–369. [Google Scholar]
- Popolo PS, Svec JG, Titze IR. Adaptation of a Pocket PC for use as a wearable voice dosimeter. Journal of Speech Language and Hearing Research. 2005;48(4):780–791. doi: 10.1044/1092-4388(2005/054). [DOI] [PubMed] [Google Scholar]
- Robson MC, Steed DL, Franz MG. Wound healing: biologic features and approaches to maximize healing trajectories. Curr.Probl.Surg. 2001;38(2):72–140. doi: 10.1067/msg.2001.111167. [DOI] [PubMed] [Google Scholar]
- Rousseau B, Ge P, French LC, Zealear DL, Thibeault SL, Ossoff RH. Experimentally induced phonation increases matrix metalloproteinase-1 gene expression in normal rabbit vocal fold. Otolaryngol.Head Neck Surg. 2008;138(1):62–68. doi: 10.1016/j.otohns.2007.10.024. [DOI] [PMC free article] [PubMed] [Google Scholar]
- Roy N, Merrill RM, Thibeault S, Parsa RA, Gray SD, Smith EM. Prevalence of voice disorders in teachers and the general population. Journal of Speech and Hearing Research. 2004;47(2):281–293. doi: 10.1044/1092-4388(2004/023). [DOI] [PubMed] [Google Scholar]
- Sapir S, Keidar A, Mathers-Schmidt B. Vocal attrition in teachers: survey findings. Eur.J.Disord.Commun. 1993;28(2):177–185. doi: 10.3109/13682829309041465. [DOI] [PubMed] [Google Scholar]
- Sapir S, Mathers-Schmidt B, Larson GW. Singers’ and non-singers’ vocal health, vocal behaviours, and attitudes towards voice and singing: indirect findings from a questionnaire. Eur.J.Disord.Commun. 1996;31(2):193–209. doi: 10.3109/13682829609042221. [DOI] [PubMed] [Google Scholar]
- Titze IR, Lemke J, Montequin D. Populations in the U.S. workforce who rely on voice as a primary tool of trade: a preliminary report. J.Voice. 1997;11(3):254–259. doi: 10.1016/s0892-1997(97)80002-1. [DOI] [PubMed] [Google Scholar]
- Titze IR. Toward occupational safety criteria for vocalization. Log.Phon.Vocol. 1999;24:49–54. [Google Scholar]
- Titze IR, Hunter EJ, Svec JG. Voicing and silence periods in daily and weekly vocalizations of teachers. J.Acoust.Soc.Am. 2007;121(1):469–478. doi: 10.1121/1.2390676. [DOI] [PMC free article] [PubMed] [Google Scholar]
- Verdolini K, Ramig LO. Review: occupational risks for voice problems. Logoped.Phoniatr.Vocol. 2001;26(1):37–46. [PubMed] [Google Scholar]
- Verdolini K, Rosen CA, Branski RC, Hebda PA. Shifts in biochemical markers associated with wound healing in laryngeal secretions following phonotrauma: a preliminary study. Ann.Otol.Rhinol.Laryngol. 2003;112(12):1021–1025. doi: 10.1177/000348940311201205. [DOI] [PubMed] [Google Scholar]
- Welham NV, Maclagan MA. Vocal fatigue: current knowledge and future directions. J.Voice. 2003;17(1):21–30. doi: 10.1016/s0892-1997(03)00033-x. [DOI] [PubMed] [Google Scholar]
- Yates JW, Kearney JT, Noland MP, Felts WM. Recovery of dynamic muscular endurance. Eur.J.Appl.Physiol Occup.Physiol. 1987;56(6):662–667. doi: 10.1007/BF00424807. [DOI] [PubMed] [Google Scholar]
- Zhang Y, Czerwonka L, Tao C, Jiang JJ. A biphasic theory for the viscoelastic behaviors of vocal fold lamina propria in stress relaxation. J.Acoust.Soc.Am. 2008;123(3):1627–1636. doi: 10.1121/1.2831739. [DOI] [PubMed] [Google Scholar]
Associated Data
This section collects any data citations, data availability statements, or supplementary materials included in this article.