Abstract
Quality of substitution voicing—i.e., phonation with a voice that is not generated by the vibration of two vocal folds—cannot be adequately evaluated with routinely used software for acoustic voice analysis that is aimed at ‘common’ dysphonias and nearly periodic voice signals. The AMPEX analysis program (Van Immerseel and Martens) has been shown previously to be able to detect periodicity in irregular signals with background noise, and to be suited for running speech. The validity of this analysis program is first tested using realistic synthesized voice signals with known levels of cycle-to-cycle perturbations and additive noise. Second, exhaustive acoustic analysis is performed of the voices of 116 patients surgically treated for advanced laryngeal cancer and recorded in seven European academic centers. All of them read out a short phonetically balanced passage. Patients were divided into six groups according to the oscillating structures they used to phonate. Results show that features related to quantification of voicing enable a distinction between the different groups, while the features reporting F0-instability fail to do so. Acoustic evaluation of voice quality in substitution voices thus best relies upon voicing quantification.
Keywords: Substitution voices, Acoustic analysis, Jitter, Perturbation, Voicing
Introduction
Substitution voicing (SV)—i.e., phonation with a voice that is not generated by both vocal folds [1]—cannot be adequately evaluated with routinely used programs for acoustic voice analysis that are aimed at ‘common’ dysphonias and quasi-periodic voices. Indeed, the basic protocol for multidimensional voice assessment as recommended by the European Laryngological Society [2] specifically mentions that the protocol is not suitable for special categories of voices, such as substitution voices and spasmodic dysphonia. Nevertheless, valid quality evaluation is essential for substitution voices, because in laryngeal oncology different therapeutic options may exist that are comparable with regard to survival rate for the same type and stage of cancer. In such cases, functional outcomes (voice, respiration, swallowing) are of major significance. The strong irregularity that characterizes substitution voices is a major problem for usual acoustic analyses. In a summary statement of the National Center for Voice and Speech, Titze [3] confirms that for type 1 signals (i.e., pseudo-periodic signals without strong sub-harmonics), perturbation analysis has considerable utility and reliability, but recommends considering—as a practical guideline—that only cycle length perturbations less than about 5% are measured reliably. This is mainly related to period extraction methods. Van As [4] concludes that only 30% of the tracheo-esophageal voices can be reliably analyzed with the Multi-Dimensional Voice Program (Kay Elemetrics, USA). The program either denies to quantify perturbations, indicating that the signal is (mainly) unvoiced, or provides aberrant/irreproducible results.
One acoustic analysis program (AMPEX: Van Immerseel and Martens) [5] has been shown in former research [1] to be an interesting assessment tool, because it is able to detect periodicity in very irregular signals with background noise, and it is suited for running speech. It also detects frequency components <0.1 kHz. However, to test its performance in cycle detection, it is necessary to use a reliable reference, e.g., a wide range of voice signals of which the degree of period perturbation and noise are known exactly. Recently, Fraj et al. [6, 7] have developed a synthesizer of deviant voices generating sustained vowels that cannot be distinguished from true pathological voices by expert raters. This enables controlling the parameters of the signal, and particularly the amount of input period perturbation and additive noise.
Once the performances and limitations of the acoustic analysis program are known, it is possible to analyze different types of substitution voices, and to investigate which acoustic characteristics are best suited to compare their quality. Because a major problem posed by substitution voices is the co-existence of aphonic (unvoiced) speech fragments with an extreme roughness/creakiness of the voiced ones, both limiting intelligibility and fluency, it appears reasonable to consider the amount of voicing and the regularity of the vibrations as quality criteria. An exception is substitution voicing with an electronic artificial larynx, which has become infrequent, and of which no case occurs in the present study. To make meaningful comparisons, the set of patients was divided into six groups based on clinical videolaryngoscopy according to the anatomical vibratory structures used for voice production.
Materials and methods
The AMPEX acoustic analysis program
The acoustic analysis is performed in three stages. In the first stage, short-term acoustic features are extracted every 10 ms by the auditory model described in [5]. Then, these features are employed to distinguish speech frames from background (silence) frames. Finally, a global analysis of the short-term acoustic feature patterns over the entire recording is performed to produce a limited set of features that are expected to characterize the voice of the recorded speaker.
Every 10 ms, the auditory model produces a set of more than 30 features, but for the present study, only 4 of them are relevant, namely, the energy (E), the voicing evidence (VE), the voiced/unvoiced nature (VU) and the pitch frequency (F0) (in case of voicing) of the frame. The reader is referred to [5] for more details on how these features are actually computed.
The speech/background classification of the frames is based on an analysis of the smoothed energy pattern. The smoothed energy of frame i is computed as the mean of the energies in frames i − 2 to i + 2. In a first step, a background threshold is determined as 1.1 times the minimal energy plus 0.05 times the maximum energy found in the recording. All frames exceeding this threshold are initially labeled as speech and the others as background. However, to avoid that too many weak parts of speech (e.g., closures of plosives, weak consonants) are classified as background, any interval shorter than 100 ms that was labeled as background was converted to speech again.
The first feature emerging from the global analysis stage characterizes the ability of the speaker to produce voicing. It comes in two flavors: the proportion of voiced frames (PVF) in the entire recording and the proportion of voiced speech frames (PVS). Because pauses and weak speech sounds are typically unvoiced, PVS is expected to be larger than PVF.
The second feature is the average voicing evidence (AVE) in the voiced frames. It characterizes the degree of regularity/periodicity in the voiced frames. Since the real background frames are normally unvoiced, the analysis is performed on all frames, and not just on the speech frames, in the hope of being more robust against possible errors of the speech/background classification, which is after all purely energy based, whereas the voicing evidence is derived from an analysis of all the subband signals created by the auditory model.
The third feature being assessed here is the average F0 modulation depth (MD) in the voiced frames. The square of MD is computed as
The mean F0(i) is the average F0 in the voiced frames found in an interval from 0.5 s before to 0.5 s after the current analysis frame (i). Thus, MD is the weighted root mean square of the relative deviation of the pitch from the (slowly evolving) pitch trend. The MD thus measures to what extent the speaker can introduce fast movements (e.g., for intonation) on top of the pitch pattern. On the other hand, MD can also be large if uncontrolled movements occur in the pitch pattern. By introducing VE(i) as the weight of frame i, one attains that MD is dominated by the voiced frames with the largest voicing evidence. The corrected MD (MDc) goes even one step further and reports the average MD only in frames with a “reliable” F0 estimate. The vocal frequency estimate F0 is designated reliable if it deviates less than 25% from the average over all voiced frames.
The fourth feature is the traditional ‘Jitter’: Jit and Jitc (corrected jitter) represent the F0-jitter in all voiced frame pairs (=2 consecutive frames) and in the voiced frame pairs with a reliable F0 in each of the two frames. The formula which is used to compute the jitter is
A fifth and last feature is the 90th percentile (VL 90) of the voicing length distribution. It is considered to be a robust estimate of the maximum voicing duration. The voicing length is defined as the number of consecutive voiced frames in the data.
Testing the acoustic analysis software by means of realistic synthetic voice signals
Fourteen synthesized sustained vowels (2 s, 7 levels of cycle length perturbations, with two levels of additive noise) were used to test the AMPEX program. The synthesis of the disordered voices involves four stages that are, first, the generation of a sinusoidal driving function, the instantaneous frequency of which is disturbed to simulate vocal frequency perturbation; second, the modeling of the glottal area via a pair of polynomial distortion functions into which the (pseudo-)harmonic driving function is inserted; third, the generation of the airflow rate at the glottis, including acoustic tract–source interactions, via an algebraic model; fourth, a simulation of the propagation of the acoustic waves in the trachea and vocal tract. Additional details regarding the simulation of irregular vocal fold vibrations can be found in Fraj et al. [6, 7] and Schoentgen [8, 9].
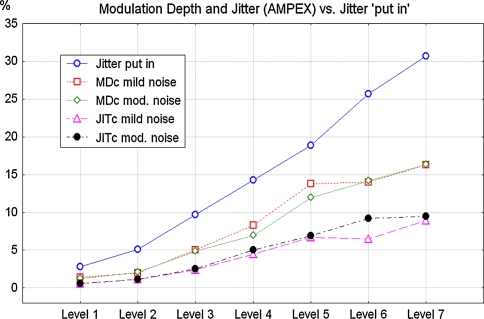
Figure 1 shows the MDc and JITc as given by AMPEX, for seven levels of period perturbation (jitter) ‘put in’ with two levels of additive noise. The levels of jitter put in are: 2.8, 5.1, 9.7, 14.3, 18.9, 25.7 and 30.72%. The two levels of additive pulsed noise (17 and 23 dB signal-to-noise ratio at the glottis, respectively) correspond to mild or moderate breathiness when perceptually evaluated by three trained clinicians (B1 and B2 on the conventional GRBAS-scale). The AMPEX program demonstrates a satisfactory performance when tested with synthetic deviant voices, although one observes for MDc an underestimation of about 50% of the genuine levels of cycle length perturbations. For JITc, the underestimation is about 65% [10].
Fig. 1.
MDc and JITc as computed by AMPEX, for seven levels of period perturbation (jitter) ‘put in’ with two levels of additive noise. The levels of jitter put in are: 2.8, 5.1, 9.7, 14.3, 18.9, 25.7 and 30.72%. The two levels of additive pulsed noise are 17 and 23 dB signal-to-noise ratio at the glottis
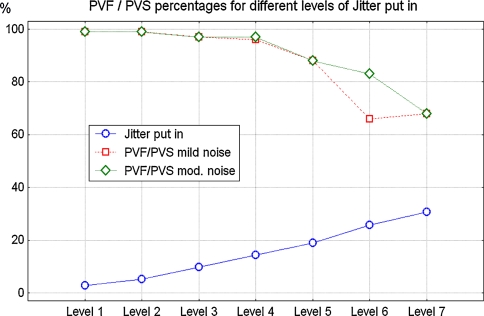
Figure 2 shows the PVF/PVS scores (here always identical) provided by AMPEX for the same seven levels of perturbation and two levels of noise. Up to about 20% period perturbation (level 5), the program classes a high percentage (about 90%) of the frames as voiced.
Fig. 2.
PVF/PVS scores (here always identical) as computed by AMPEX for the same seven levels of perturbation and two levels of noise
In these first experiments, the program is tested with sustained vowels (2 s) in order to have a reasonable check of its goodness of fit for the analysis of these strongly perturbed voices. In running speech, such voices can also comprise breaks, octave-jumps and other so-called ‘bifurcations’ (non-linear dynamics); a next step—currently in development—is synthetic deviant speech including such accidents.
Patient data
Data (voice signals) of 122 patients (16 female, 105 male, 1 unidentified) with substitution voices resulting from surgery for advanced laryngeal cancer were recorded in seven European academic centers: Lille (F), Graz (A), Hamburg (D), Louvain (B), Izmir (Turkey), Maastricht (NL) and Toulouse (F). All subjects gave their informed consent.
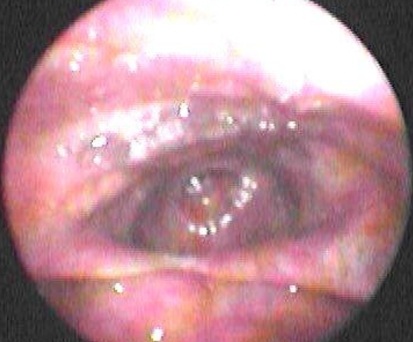
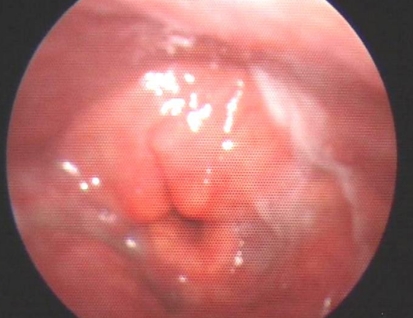
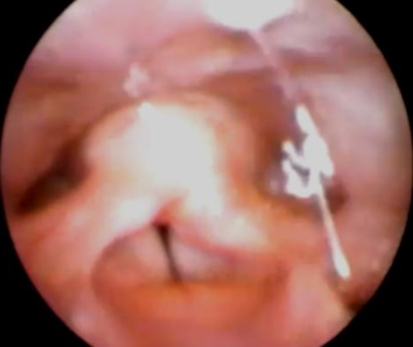
The exact diagnosis was not specified for two of them or did not concur with the definition of SV for four other cases (e.g., supraglottic laryngectomy). The distribution of the 116 remaining cases categorized according to five main surgery types was: 11 cases of front-lateral laryngectomy/Tucker; 31 cases of total laryngectomy with cricopharyngeal myotomy; 15 cases of total laryngectomy without myotomy; 22 cases of cricohyoido(epiglotto)pexy; 37 cases of cordectomy (from type III on). A majority of patients (38/46) with total laryngectomy also underwent radiotherapy, but only six of the patients from all other categories were irradiated (4 cordectomies, 1 cricohyoidopexy and 1 Tucker). For classification and statistical analysis, the main anatomical vibratory structure is referred to rather than the surgery type, as this better reflects the physiology of the substitution voice. Six categories could be defined on the base of videoendoscopic examination: esophageal (without button) (E), 12 cases; tracheo-esophageal (TE), 34 cases; one arytenoid (1Ary), 13 cases; two arytenoids (2Ary), 13 cases; ventricular folds (or false vocal cords FVC), 16 cases; single true vocal fold (TVC), 28 cases. Figures 3, 4 and 5 show examples of a tracheo-esophageal voice, of a voice obtained by vibration of two arytenoids after cricohyoidopexy, and of a voice obtained by ventricular fold vibration after cordectomy III.
Fig. 3.
Videoendoscopic example of substitution voice during phonation: tracheo-esophageal voice in a case of total laryngectomy. Vibration is observed at the level of the esophageal mucosa
Fig. 4.
Videoendoscopic example of substitution voice during phonation: vibration is observed at the level of two arytenoids in a case of cricohyoidoepiglottopexy (CHEP)
Fig. 5.
Videoendoscopic example of substitution voice during phonation: vibration is observed at the level of the ventricular folds in a case of type III cordectomy
The voice material consisted of standardized phonetically balanced sentences followed by counting from 0 to 9 (in 4 different languages: Dutch, German, French and Turkish), for a total time of recording of 20–30 s. All texts were those traditionally utilized in voice clinics (e.g., “Einst stritten sich Nordwind und Sonne…” in German, “Papa en Marloes staan op het station…” in Dutch). Patients read with their spontaneous voice in a quiet room. All recordings were made digitally, with a sample frequency of 44.1 KHz in voice laboratory conditions.
Acoustic measurements
With AMPEX, the following features have been estimated.
PVF/PVS
The proportion of voiced frames and voiced speech frames. The better the voice, the higher is the percentage.
AVE
The average voicing evidence in voiced frames. The more regular (periodic) the voiced frames, the higher is the AVE.
VL 90
The 90th percentile of the voicing length distribution. The voicing length is defined as the number of consecutive voiced frames found in the data. The 90th percentile of the voicing length distribution may be considered to be a robust estimate of the maximum voicing duration. Phonatory breaks decrease the value of this feature.
MD and MDc
The modulation depth and corrected modulation depth. The correction means that only frames with a reliable F0 are considered.
JIT and JITc
The cycle-to-cycle period perturbation and the corrected cycle-to-cycle period perturbation.
PFU
The percentage of frames with an “unreliable” F0. For example, observed sudden frequency shifts suggest that the F0 estimate is unreliable.
Statistics
The nonparametric Kruskal–Wallis statistical test was applied for comparing the six categories of substitution voices, with the type of voice source as grouping variable. The Statistica-program (Statsoft Inc., Tusla, USA) was used for analysis.
Results
The proportion of voiced frames and of voiced speech frames
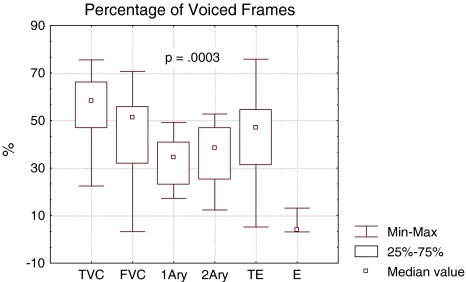
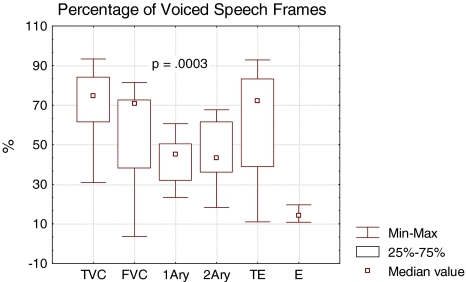
The proportion of voiced frames depends on the number and lengths of pauses/interruptions in speech. There is a highly significant difference among categories (p = 0.0003). Voices with one vocal cord left (TVC) perform best, and esophageal voices (E) worst. Similarly, there is a highly significant difference among categories (p = 0.0003) for the voiced speech frames, i.e., considering only frames that are classified as speech in the first step of the analysis. Since pauses and weak sounds are typically unvoiced, PVS is expected to be larger than PVF. For sustained vowels, PVS would be expected to be equal to 100%: the better the voice, the higher is the percentage. Voices with one true vocal cord (TVC), ventricular voices (false vocal cords: FVC) and tracheo-esophageal (TE) voices perform best, and esophageal voices (E) worst. Figures 6 and 7 show the box plots (median/25th and 75th percentiles) of PVF and PVS for the six categories.
Fig. 6.
Proportion of voiced frames (PVF) for the six categories of main anatomical vibrating structure
Fig. 7.
Proportion of voiced speech frames (PVS) for the six categories of main anatomical vibrating structure
The voicing evidence
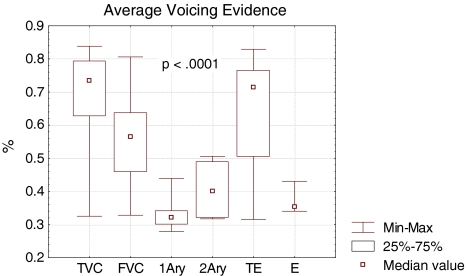
There is a highly significant difference among categories (p < 0.0001). The more regular the voice frames are, the higher the AVE is. Voices with one true vocal cord (TVC) and tracheo-esophageal (TE) voices perform best, and esophageal voices (E) and voices with one arytenoid (1Ary) as main vibratory structure worst. This appears in the box plots of Fig. 8.
Fig. 8.
Voicing evidence VE for the six categories of main anatomical vibrating structure
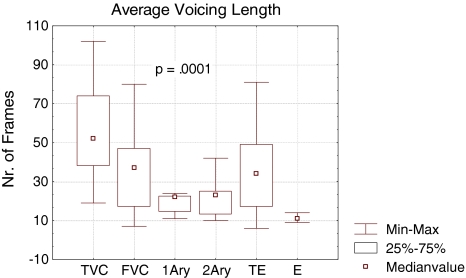
The average voicing length
The average voicing length (VL 90) is considered to be a valid estimate of the maximum voicing duration. There is a highly significant difference among categories (p = 0.0001). As seen in Fig. 9, voices with one true vocal fold left (TVC) perform best, and esophageal voices (E) worst.
Fig. 9.
Average voicing length VL 90 for the six categories of main anatomical vibrating structure
The modulation depth and the corrected modulation depth
The (underestimated) modulation depth (MD) reflects the cycle length excursion computed by AMPEX for the six categories. Better voices are expected to show less (uncontrolled) F0-variability, although MD could also reflect intonation, but most of these voices have a very limited intonation. There is, however, no significant difference (p > 0.05) among the categories. In several categories (FVC, 1Ary, 2Ary), a large spreading of data is observed. The correction (MDc) means that only frames with a reliably estimated fundamental frequency (F0) are taken into account. No significant differences (p > 0.05) among categories are observed.
The jitter and corrected jitter
No significant difference (p > 0.05) among categories is observed for the (underestimated) jitter. The same is true for corrected jitter. The correction (JITc) means that only frames with a reliably estimated fundamental frequency (F0) are taken in account.
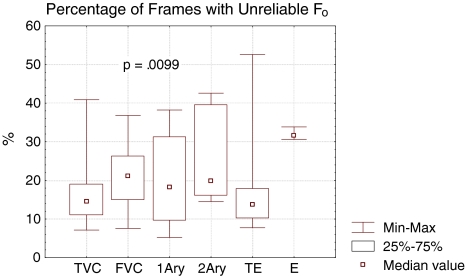
The percentage of frames with “unreliable” F0
Frames are classified with “unreliable” F0 due to abrupt frequency shifts (e.g., ‘chaotic bifurcations’, period doubling) for the six categories. There is a significant difference among categories (p = 0.0099) owing to esophageal voices (E) that show a higher percentage of frames with “unreliable” F0 (Fig. 10). However, as seven statistical comparisons are computed for the same patient groups (Bonferroni correction), the critical level of p = 0.05 needs to be adjusted to 0.007: this actually means that the five F0-related features lack statistical significance.
Fig. 10.
Percentage of frames with “unreliable” F0 due to abrupt frequency shifts (e.g., ‘chaotic bifurcations’, period doubling) for the six categories of main anatomical vibrating structure
Discussion
In summary, our results demonstrate that features related to quantification of voicing succeed in distinguishing between different groups of voice sources, while the features related to F0-variability fail to do so, although the perturbation measurements are reliable. Acoustic evaluation of voice quality in substitution voices thus best relies upon voicing quantification.
Very few data are available regarding comparative acoustic analyses of different types of substitution voices. In a study comparing total laryngectomy and laser partial laryngectomy, Olthoff et al. [11] notice that, due to the pronounced irregularity of these voices, usual computerized analysis systems (MDVP by Kay Elemetrics Corp., Pine Brook, NJ and Göttingen Hoarseness Diagram by Frölich et al. [12]) cannot meaningfully extract fundamental frequency, even in a sustained vowel, and fail to differentiate between these types of voices. A similar restriction concerning the examination and comparison of irregular voices (voice prosthesis vs. esophageal voice) with MDVP was also found by Bertino et al. [13] and Crevier-Buchman et al. [14]. In a recent study limited to tracheo-esophageal voices, Maryn et al. [15] also found that, after removing the unvoiced fragments within the continuous speech samples, the prominence of the cepstral peak (or dominant harmonic, reflecting cycle irregularity) and of the first two spectral harmonics appeared to be the strongest correlates of tracheo-esophageal voice quality. This appears to confirm the relevance of the voicing criterion. For the category of substitution voices they investigated, these authors also conclude that perturbation measures and other properties of the spectral harmonics are less sensitive to differences in voice quality, calling in question their clinical usefulness and applicability.
From a clinical point of view, substitution voices in which one vocal fold still operates as an oscillator emerge as the best ones, while the esophageal voices (actually, often failures of tracheo-esophageal voices) show the worst scores, also when specifically compared to tracheo-esophageal voices. This observation confirms that the (true) vocal fold is the best oscillator and needs to be preserved as far as possible.
Multidimensionality is an essential condition for a comprehensive evaluation of substitution voices [16]. This implies that, for example, acoustic analysis is an approach distinct from the auditory-perceptual one, and that validating acoustic measures by their correlation with the subjective rating scores is not necessary. The physical level is different from the perceptual level. Nevertheless, the computed acoustic features (as the degree of voicing) must have a physiological basis and pragmatic evidence must be available for what is better and what is worse. In this case, considering that all surgical treatments have damaged the vocal oscillator, more voicing is better than less voicing. In a second step, confronting the results of the different approaches (perception and acoustics, but also energetics, biomechanics and self-evaluation) will help in understanding the real functional outcome.
Conclusion
Acoustic analysis of running speech is possible and relevant in substitution voices, when using suitable software and algorithms. A program such as AMPEX, mainly based on waveform analysis, is able to compute validly the level of F0-variability, up to higher levels than generally allowed so far, although the true value is systematically underestimated. This is shown by testing with realistic synthetic deviant voice signals. However, it appears that computing the degree of period perturbation is—contrary to common dysphonias—of limited interest for substitution voices, because F0-variability does not succeed in discriminating between six different types of substitution voices generated by distinct anatomical structures. The degree of voicing appears to be more relevant in that regard. It further confirms that the (true) vocal fold is the best physiological oscillator, which needs preserving as far as possible. Results presented here show that tracheo-esophageal voice considerably outperforms esophageal voice.
In summary, there are objective, physiologically based features for quantifying acoustic quality of substitution voices. They may be considered—in balance with other arguments—when discussing therapeutic options for laryngeal cancer.
Acknowledgments
The authors are particularly indebted to the following colleagues, who provided the voice signals analyzed in the current study: D. Chevalier, MD, PhD, Service ORL Hopital Huriez CHU, Lille, France; G. Friedrich, MD, PhD, Department of Phoniatrics, Speech and Swallowing, Graz, Austria; M. Hess, MD, PhD, University Medical Center Hamburg-Eppendorf, Hamburg, Germany; G. Lawson, MD, PhD; Marc Remacle MD, PhD, Service ORL et chirurgie cervico-faciale, Cliniques Universitaires UCL de Mont Godinne, Yvoir, Belgique. F; Ogut, MD, PhD, Ege Univ. KBB Anabilim Dali Bornova İzmir; Turkey; R. Speyer PhD, Department of ENT, University Hospital Maastricht, the Netherlands; V. Woisard, MD, PhD, ORL-Chirurgie cervico-faciale, CHU-Hôpital Larrey, Toulouse, France. This research has been achieved within the frame of COST-Action 2103 “Advanced Voice Function Assessment”.
Conflict of interest
The authors have no financial relationship with any organization. The current research was not sponsored.
Open Access
This article is distributed under the terms of the Creative Commons Attribution Noncommercial License which permits any noncommercial use, distribution, and reproduction in any medium, provided the original author(s) and source are credited.
References
- 1.Moerman M, Pieters G, Martens JP, Van der Borgt MJ, Dejonckere PH. Objective evaluation of quality of substitution voices. Eur Arch Otorhinolaryngol. 2004;261:541–547. doi: 10.1007/s00405-003-0681-0. [DOI] [PubMed] [Google Scholar]
- 2.Dejonckere PH, Bradley P, Clemente P, Cornut G, Crevier-Buchman L, Friedrich G, Van De Heyning P, Remacle M, Woisard V. A basic protocol for functional assessment of voice pathology, especially for investigating the efficacy of (phonosurgical) treatments and evaluating new assessment techniques. Guideline elaborated by the Committee on Phoniatrics of the European Laryngological Society (ELS) Eur Arch Otorhinolaryngol. 2001;258:77–82. doi: 10.1007/s004050000299. [DOI] [PubMed] [Google Scholar]
- 3.Titze IR (1995) Workshop on acoustic voice Analysis. Summary statement. In: National Center for Voice and Speech, the University of Iowa. Ames
- 4.Van As CJ, Hilgers FJM, Verdonck-de Leeuw IM, Koopmans-van Beinum FJ. Acoustical analysis and perceptual evaluation of tracheoesophageal prosthetic voice. J Voice. 1998;12:239–248. doi: 10.1016/S0892-1997(98)80044-1. [DOI] [PubMed] [Google Scholar]
- 5.Van Immerseel LM, Martens JP. Pitch and voiced unvoiced determination with an auditory model. J Acoustical Soc Am. 1992;91:3511–3526. doi: 10.1121/1.402840. [DOI] [PubMed] [Google Scholar]
- 6.Fraj S, Grenez F, Schoentgen J (2009a) Evaluation of a synthesizer of disordered voices. In: Proceedings 3rd advanced voice function assessment international workshop. Madrid, pp 18–20, 69–72
- 7.Fraj S, Grenez F, Schoentgen J (2009b) Perceived naturalness of a synthesizer of disordered voices. In: Proceedings INTERSPEECH 2009. Brighton
- 8.Schoentgen J. Stochastic models of Jitter. JASA. 2001;109:1631–1650. doi: 10.1121/1.1350557. [DOI] [PubMed] [Google Scholar]
- 9.Schoentgen J. Shaping function models of the phonatory excitation signal. JASA. 2003;114:2906–2912. doi: 10.1121/1.1612485. [DOI] [PubMed] [Google Scholar]
- 10.Manfredi C, Giordano A, Schoentgen J, Fraj S, Bocchi L, Dejonckere PH. Validity of jitter measures in non-quasi-periodic voices. Part II: The effect of noise. Logoped Phoniatr Vocol. 2011;36:78–89. doi: 10.3109/14015439.2011.578077. [DOI] [PubMed] [Google Scholar]
- 11.Olthoff A, Mrugalla S, Laskawi R, Fröhlich M, Stuermer I, Kruse E, Ambrosch P, Steiner W. Assessment of irregular voices after total and laser partial laryngectomy. Arch Otolaryngol Head Neck Surg. 2003;129:994–999. doi: 10.1001/archotol.129.9.994. [DOI] [PubMed] [Google Scholar]
- 12.Fröhlich M, Michaelis D, Strube HW, Kruse E. Acoustic voice analysis by means of the hoarseness diagram. J Speech Lang Hear Res. 2000;43:706–720. doi: 10.1044/jslhr.4303.706. [DOI] [PubMed] [Google Scholar]
- 13.Bertino G, Bellomo A, Miani C, Ferrero F, Staffieri A. Spectrographic differences between tracheo-esophageal and esophageal voice. Folia Phoniatr Logop. 1996;48:255–261. doi: 10.1159/000266416. [DOI] [PubMed] [Google Scholar]
- 14.Crevier-Buchman L, Lacourreye O, Papon JF, Monfrais-Pfauwadel MC, Brasnu D. Apports et limites de l’analyse acoustique de la voix et de la parole alaryngée au moyen d’un système informatique. Ann Otolaryngol Chir Cervicofac. 1996;113:61–68. [PubMed] [Google Scholar]
- 15.Maryn Y, Dick C, Vandenbruaene C, Vauterin T, Jacobs T. Spectral, cepstral, and multivariate exploration of tracheoesophageal voice quality in continuous speech and sustained vowels. Laryngoscope. 2009;119:2384–2394. doi: 10.1002/lary.20620. [DOI] [PubMed] [Google Scholar]
- 16.Moerman M, Martens JP, Crevier-Buchman L, de Haan E, Grand S, Tessier C, Woisard V, Dejonckere P. The INFVo perceptual rating scale for substitution voicing: development and reliability. Eur Arch Otorhinolaryngol. 2006;263:435–439. doi: 10.1007/s00405-005-1033-z. [DOI] [PubMed] [Google Scholar]


