Abstract
PI3K signaling plays important roles in cell differentiation, proliferation, and migration. Increased mutations and expression levels of PI3K are hallmarks for the development of certain cancers. Pharmacological targeting of PI3K activity has also been actively pursued as a novel cancer therapeutic. Consequently, measurement of PI3K activity in different cell types or patient samples holds the promise as being a novel diagnostic tool. However, the direct measurement of cellular PI3K activity has been a challenging task. We report here the characterization of two fluorescent PIP2 derivatives as reporters for PI3K enzymatic activity. The reporters are efficiently separated from their corresponding PI3K enzymatic products through either thin layer chromatography (TLC) or capillary electrophoresis (CE), and can be detected with high sensitivity by fluorescence. The biophysical and kinetic properties of the two probes are measured, and their suitability to characterize PI3K inhibitors is explored. Both probes show similar capacity as PI3K substrates for inhibitor characterization, yet also possess distinct properties that may suggest their different applications. These characterizations have laid the groundwork to systematically measure cellular PI3K activity, and have the potential to generate molecular fingerprints for diagnostic and therapeutic applications.
Keywords: PI3K assay, fluorescent phosphatidylinositides, TLC analysis, capillary electrophoresis
1. Introduction
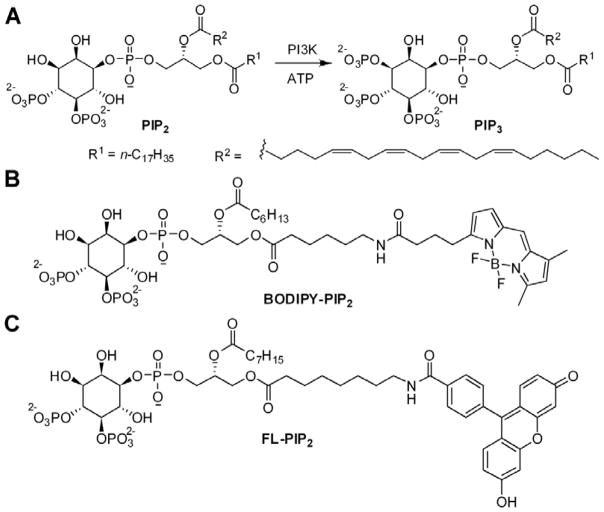
Phosphatidylinositides (PIs) are not only integral components of cell membranes, but also among the most versatile endogenous signaling molecules 1. Dynamic changes of PIs in the membranes, particularly phosphatidylinositol 4,5-bisphosphate (PIP2) and phosphatidylinositol 3,4,5-trisphosphate (PIP3), are fundamental to many functional processes including cell proliferation and migration 2. Phosphatidylinositol 3-kinase (PI3K) catalyzes the phosphorylation of PIP2 to form PIP3 (Fig. 1A), while phosphatase and tensin homolog (PTEN) dephosphorylates PIP3 to regenerate PIP2. Dysfunction of either PI3K or PTEN has been linked to various diseases including cancer and diabetes 3–5. For example, the somatic mutation or amplification of PI3K has been found in breast, colorectal, glioblastoma, and pancreatic cancer 6–7. Consequently, small molecule PI3K inhibitors have been actively pursued by pharmaceutical companies, and a number of compounds are in clinical trials in oncology 8–10.
Figure 1.
Schematic illustration of the PI3K reaction. A. the endogenous PIP2 is phosphorylated at the 3′-OH to form PIP3; B, C. Chemical structures of fluorescent PIP2 derivatives BODIPY-PIP2 (B) and FL-PIP2 (C).
Although PI3K mutation and amplification have been firmly linked to various diseases, whether and how genetic changes quantitatively impact enzymatic activity has not been well established. This is partly due to the lack of suitable reporters and analytical tools to directly measure cellular PI3K activity. Among the known methods for PI3K activity measurement, radioactivity-based assays have been the most widely used 11. In these methods, the cells are metabolically labeled with radioactive materials extracted with organic solvents. The lipid fraction is separated by thin-layer chromatography (TLC) or high performance liquid chromatography (HPLC) and detected by autoradiography. This approach has the advantage of yielding quantitative results, and can be optimized to differentiate various lipids. However, the assays are subject to cell-dependent differences in steady-state PI metabolism and variable expression of PI3K. In addition, the incorporation efficiency of the radioactive material may be low, and the sensitivity and specificity of the incorporation are limited. To avoid metabolic labeling, matrix-assisted laser desorption ionization mass spectrometry (MALDI-MS) has gained popularity for the rapid analysis of lipids in various biological samples 12–13. A solvent extraction procedure of the lipids from the unpurified sample is typically carried out prior to the MALDI-MS measurements. This method distinguishes different lipids by their molecular weights; however, it does not distinguish between isomers and requires sophisticated and expensive equipment. In addition, the dynamic range of lipid concentrations in the cells makes the detection of low abundance lipids very difficult. The phosphorylation of downstream proteins, such as protein kinase B (PKB, aka Akt), has also been used to evaluate cellular PI3K activity. However, phosphorylation of Akt is an indirect measure and confounded by the phosphorylation of Akt by other kinases. Finally, fluorescently labeled pleckstrin homology (PH) domains have been used as an indirect assay of the enzymatic activities of PI3K and PTEN. Cells are transfected with a PH domain that binds to the substrate PI of interest, and is tagged with a fluorescent protein such as green fluorescent protein (GFP) 14. A change in membrane-associated fluorescence signal will occur if the level of the PI in the membrane changes. The major problems are that binding specificity and affinity of the PI-binding domains towards various PIs are not very high, and they are known to interact with other protein ligands. In addition, these molecularly engineered cell-based assays cannot be used in clinical samples.
For in vitro assays, PI3K activity can be measured by monitoring the incorporation of 32P into PIP2 to form radioactive PIP3. In addition, PH domains have been used as detectors in measuring the production or localization of PIP3 15. In a competitive assay of PI3K activity, the PIP2 is combined with PI3K and a PH domain that specifically detects the reaction product PIP3. The reaction mixture is then added to a plate coated with PIP3 and the binding of the probe is detected through fluorescence polarization or luminescence to reflect the PI3K activity 16. These assays have gained popularity because of their relative simplicity and suitability for high throughput screens, but such assays measure PI3K activity indirectly and the accuracy is affected by many factors. These various limitations require new techniques for analysis of PI3K activity directly and rapidly which can also be used in clinically relevant situations where the amount of sample, such as from a patient, is limited.
To address this need, lipids tagged with fluorophores have been developed as substrates for a variety of lipid metabolic enzymes, often with similar kinetics to the endogenous substrates 17–18. BODIPY-tagged BODIPY-PIP2 (Fig. 1B) and fluorescein-tagged FL-PIP2 (Fig. 1C) have been used to image cellular localization of PIP2 19. Recently, Caliper Lifesciences employed FL-PIP2 as a PI3K substrate for an in vitro assay in which conversion of the FL-PIP2 to FL-PIP3 was monitored by electrophoretic chemical separation with laser-induced fluorescence detection in a microfabricated fluidic chip. Such highly-sensitive, chemical separation techniques for monitoring phosphorylation lend themselves to cell-based assays, and several examples using capillary electrophoresis (CE) with fluorescent peptide- and lipid-based probes have been reported in single-cell biochemical measurements 20–21. However, the amphiphilic nature of PI lipids renders them to potential loss on the column during CE separation. Consequently, the accuracy of PI3K activity measurement has to be validated. Toward the goal to adapt fluorescent PIP2 derivatives to measure PI3K activity in patient samples, we carried out detailed kinetic studies using both thin layer chromatography (TLC) and capillary electrophoresis (CE) analyses.
2. Materials and Methods
Materials
Purified PI3K (PIK3CA/PIK3R1) was obtained from Invitrogen. FL-PIP2 and FL-PIP3 were purchased from Cayman Chemical. BODIPY-PIP3 was purchased from Echelon Bioscience. BODIPY-PIP2 was synthesized according to the literature protocols 22. EOTrol LR was obtained from Target Discovery. Wortmannin, LY294002, ATP, sodium deoxycholate (SDC), 1-propanol and TLC plates with silica gel 60 were purchased from Sigma. Dynamic light scattering data were recorded on a Wyatt DynaPro dynamic light scattering plate reader. The fluorescence spectra were recorded with a QM-4 PTI spectra fluorometer with rhodamine B (3 g/L in CH3OH) as the standard.
General PI3K Assay
The fluorescent PIP2 derivative (2 μM, final concentration) was added to the assay buffer (60 μL, final volume) composed of MOPS (50 mM, pH 6.5), NaCl (100 mM), sodium cholate (0.5 mM), DTT (1 mM), MgCl2 (10 mM), and ATP (2 mM). The reaction was initiated by the addition of purified PI3K (2 ng/μL). After incubation at room temperature for the indicated time, the enzymatic reaction was quenched by adding aqueous HCl (2.0 M, 25 μL). The resulting mixture was extracted with CHCl3/MeOH (v/v = 2:1, 250 μL) for 3 times. The organic layers were separated, combined, and concentrated under vacuum. The resulting residue was re-suspended in CHCl3/MeOH (v/v = 1:1) for TLC analysis. TLC plates (Merck, Silica Gel-60) were pretreated with a solvent system containing 1.2% potassium oxalate and 1.2 mM EGTA in MeOH/water (v/v = 2:3) and heated at 110 °C for 20 min before use. The TLC plate was then developed in CHCl3/acetone/MeOH/AcOH/water (v/v/v/v/v = 40:15:13:12:7) and scanned on a Typhoon 9400 Variable Mode Imager (λex/λem = 488 nm/520 nm). The fluorescence intensity of different spots on the TLC plate was quantified with ImageQuant software (V.5.0). Alternatively, the reaction mixture was diluted in CHCl3/MeOH (v/v = 1:1, 10 μL) and spotted on a TLC plate directly for separation and detection.
IC50 measurement of PI3K inhibitors
PI3K was incubated with the inhibitors in the assay buffer for 10 min at room temperature before the assay was initiated by the addition of ATP. The final reaction mixture contained: PIP2 (2 μM for BODIPY-PIP2 and 4 μM for FL-PIP2), ATP (20 μM), 2% DMSO, MOPS (50 mM, pH 6.5), NaCl (100 mM), sodium cholate (0.5 mM), DTT (1 mM), MgCl2 (10 mM), and PI3K (2 ng/μL). After incubation at room temperature (90 min for BODIPY-PIP2, and 180 min for FL-PIP2), the reaction mixture was diluted with CHCl3/MeOH (v/v = 1:1) and analyzed as described above.
Capillary electrophoresis
CE analysis of lipid analytes was performed using a custom-built CE system with laser-induced fluorescence detection as previously described 21. Fused-silica capillaries (40 cm length, 50 μm i.d., 360 μm o.d., Polymicro Technologies, Phoenix, AZ) were used for the analyte separations. A voltage of 16 kV was applied across the capillary during electrophoresis. For CE analysis of the mixtures, sample volumes (0.6 nL) were loaded by hydrodynamic injection. Separation of FL-PIP2, FL-PIP3, BODIPY-PIP2 and BODIPY-PIP3 was performed in 100 mM Tris, 10 mM SDC, 1 mM MgCl2, 30% 1-propanol, and 5% EOTrol LR, at pH 8.5. Prior to each run, the capillary was flushed with 1 M NaOH for 3 min, deionized H2O for 3 min, and the separation buffer for 3 min using a pressurized washing system at 20 psi. To directly compare the phosphorylation of reporters with different fluorescent groups, BODIPY-PIP2 (1 μM) and FL-PIP2 (1 μM) were reacted with PI3K for 1 h under the conditions described above. The reaction mixture was quenched by adding 1-propanol and the sample was diluted 200-fold in water immediately prior to CE analysis.
3. Results and Discussion
Characterization of FL-PIP2 and BODIPY-PIP2
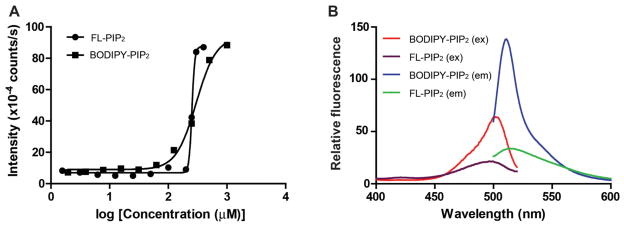
PI3K catalyzes the phosphorylation of the endogenous PIP2 at the lipid-water interface where the substrate PIP2 is in the lipid membranes while the phosphate donor ATP is in the aqueous phase 23. Accordingly, most studies on PI3K reactions have been carried out in lipid vesicles or micelles where the kinetic measurements are complex 11, 24. Because the fluorescent PIP2 derivatives have shorter alkyl chains and are relatively more water soluble compared to endogenous PIP2, we chose to characterize the two probes under soluble conditions. When the lipid substrate was mono-dispersed in the assay buffer, the enzymatic kinetics analysis followed the classical Michaelis-Menton equation. To ensure that the probes did not form micelles under the assay conditions, the critical micelle concentration (CMC), the amphiphile concentration at which the surface tension of the aqueous phase reaches its minimum, was measured for both FL-PIP2 and BODIPY-PIP2. The light scattering 25 of different concentrations of BODIPY-PIP2 and FL-PIP2 in deionized water at 25 °C was measured and plotted (Fig. 2A). The CMC of FL-PIP2 was approximately 225 μM while that of BODIPY-PIP2 was 65 μM. The CMC of endogenous PIP2 was also measured by this method as 10 μM, which is consistent with the value obtained through other methods reported in the literature 26.
Figure 2.
Biophysical characterization of FL-PIP2 and BODIPY-PIP2. A. Measurement of critical micelle concentrations (CMCs) of FL-PIP2 and BODIPY-PIP2. B. Fluorescence excitation and emission spectra of FL-PIP2 and BODIPY-PIP2.
The fluorescence excitation and emission spectra of both BODIPY-PIP2 and FL-PIP2 were also measured (Fig. 2B). Both spectra of BODIPY-PIP2 and FL-PIP2 are similar as those of the parent fluorophores BODIPY and fluorescein, respectively 27–29. Compared with FL-PIP2, BODIPY-PIP2 possesses a higher extinction coefficient and narrower emission bandwidth. The excitation maximum is 502 nm for BODIPY-PIP2 and 496 nm for FL-PIP2, while the emission maximum is 511 nm for BODIPY-PIP2 and 516 nm for FL-PIP2. The kinetic measurements of the fluorophore-tagged PIP2 and PIP3 in the subsequent experiments were recorded with excitation at 488 nm and detected at 520 nm.
Validation of the PI3K reaction and separation of the reaction mixtures on TLC and CE
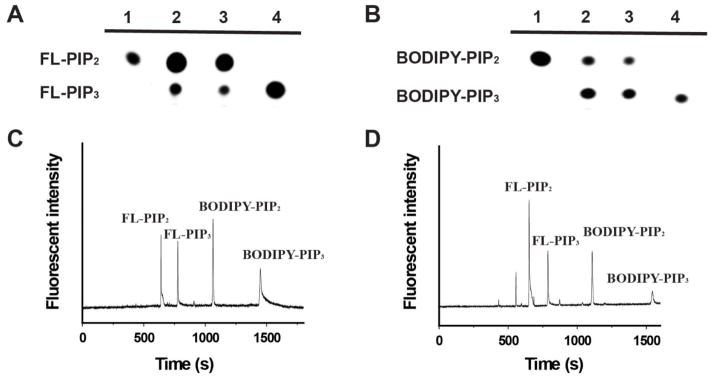
The canonical method for detection of PI3K enzymatic activity in vitro uses radioactive ATP to incorporate 32P into the reaction product, which is subsequently separated from other components in the reaction mixture on TLC and detected through autoradiography 30–31. Likewise, we envisioned that the fluorescent PIP2 derivatives could be used to report PI3K activity by first separating fluorescent PIP2 from its PI3K reaction product on a TLC plate and then quantifying the ratio of the substrate to product through fluorescence detection. To optimize the separation efficiency, the TLC plates were pretreated with potassium oxalate and EDTA followed by heating at 110 °C for 20 min. The PI3K reaction mixture was extracted with CHCl3/MeOH (v/v = 2:1) four times and the products were separated on TLC. Under suitable developing solutions (see methods), the BODIPY-PIP2 and BODIPY-PIP3 were well separated (Fig. 3A, lane 2). The extraction efficiency, as measured by fluorescence recovery, was approximately 97%. However, it was not clear if BODIPY-PIP2 and BODIPY-PIP3 were extracted with the same efficiency, raising concern about the accuracy of the measurement. Moreover, the extraction process was tedious and time-consuming. We thus explored the possibility of analysis without the extraction process. Thus, the reaction mixture was diluted with CHCl3/MeOH (v/v = 1:1) to quench the PI3K-catalyzed reaction and directly separated by TLC (Fig. 3A, lane 3). Interestingly, the separation of BODIPY-PIP2 from BODIPY-PIP3 proceeded with almost identical efficiency. Likewise, the FL-PIP3 was also efficiently separated from FL-PIP2 on TLC, either with or without the extraction process (Fig. 3B).
Figure 3.
Separation of the PI3K reaction mixtures with fluorescent PIP2 derivatives through TLC or CE analysis. A. the separation of the reaction mixture of FL-PIP2 on TLC. lane 1: FL-PIP2; lane 2: the reaction mixture was extracted with CHCl3/MeOH (v/v = 2:1) before TLC separation; lane 3: the reaction mixture was diluted with CHCl3/MeOH (v/v = 1:1) and separated on TLC; lane 4: FL-PIP3. B. the separation of the reaction mixture of BODIPY-PIP2 on TLC. lane 1: BODIPY-PIP2; lane 2: the reaction mixture was extracted with CHCl3/MeOH (v/v = 2:1) before TLC separation; lane 3: the reaction mixture was diluted with CHCl3/MeOH (v/v = 1:1) and separated on TLC; lane 4: BODIPY-PIP3. C. The separation of a mixture of FL-PIP2, FL-PIP3, BODIPY-PIP2, and BODIPY-PIP3 by CE; D. A 1:1 mixture of FL-PIP2 and BODIPY-PIP2 were used for the PI3K reaction, and the reaction mixture was separated by CE.
We have also attempted to separate a mixture of BODIPY-PIP2, BODIPY-PIP3, FL-PIP2, and FL-PIP3 on TLC, but did not have success due to the similar Rf values between the FL-tagged and BODIPY-tagged lipids. In contrast, these four fluorescent molecules could be simultaneously measured by CE analysis. As shown in Fig. 3C, a mixture of BODIPY-PIP2, BODIPY-PIP3, FL-PIP2, and FL-PIP3 were readily separated by CE. We then analyzed an aqueous in vitro kinase reaction with PI3K after one hour incubation with both BODIPY-PIP2 and FL-PIP2. Under the assay conditions used, 24 ± 5% of FL-PIP2 and 17 ± 3% of BODIPY-PIP2 were phosphorylated (n = 5), (Fig. 3D). The difference in phosphorylation of the two fluorescently labeled PIP2’s may be caused by greater loss of the more hydrophobic BODIPY-labeled substrate during sample preparation and incubation thereby reducing its concentration relative to its KM for PI3K. Under the assay conditions, the detection limits for the fluorescently labeled PIP2 and PIP3 were approximately 0.3–1.2 × 10⁻¹² for TLC analysis and 1–10 × 10−20 mol for CE separation. These are comparable or better than the detection limit (0.5–1 x10⁻¹² mol) when the traditional radioactivity-based assay was used.
Kinetics analysis of PI3K activity with fluorescent PIP2 derivatives
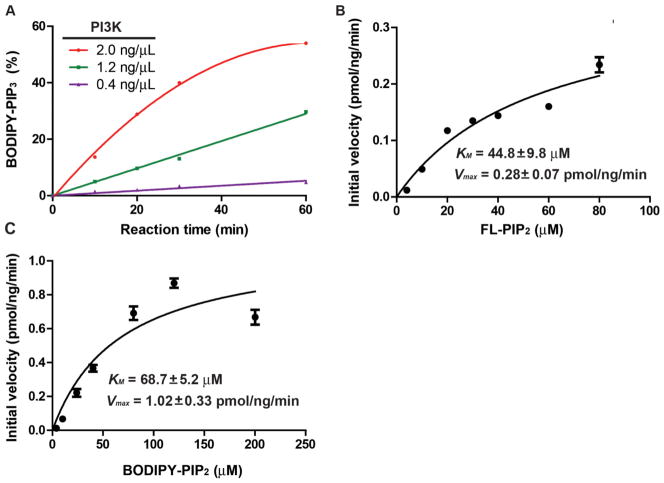
To quantify the kinetic properties of BODIPY-PIP2 and FL-PIP2, we measured the KM and Vmax of these two probes in the PI3K reaction. To ensure that the measurement was under initial velocity conditions, we explored the effects of reaction time and amount of enzyme on the conversion of BODIPY-PIP2 (Fig. 4A). When 1.2 ng/μL PI3K was used in the assay, the conversion of BODIPY-PIP2 was within 10% after 30 min at room temperature while the reaction product could still be easily detected and quantified by fluorescence intensity. These conditions were thus used for subsequent experiments. In the cellular environment, the ATP concentration is in the range of 1–10 mM. The KM for ATP with endogenous PIP2 as the substrate is in the range of 20–80 μM 30. Consequently, we used 2 mM ATP in all the experiments for the KM and Vmax measurement.
Figure 4.
Kinetic analysis of PI3K reaction with fluorescent PIP2 derivatives. A. The reaction progress curves with different amounts of PI3K were used. B. Kinetic studies on PI3K reaction with FL-PIP2. C. Kinetic studies on PI3K reaction with BODIPY-PIP2. Each experiment was carried out in duplicate and repeated three times.
To carry out the assay, PI3K was added to the assay buffer containing the fluorescent PIP2 derivative (2 μM) and ATP (2 mM). The concentration of the lipid substrate was varied to generate a series of initial velocities. KM and Vmax were then calculated by fitting the data to the Michaelis-Menton equation. Each experiment was carried out in duplicates and repeated three times. The KM for FL-PIP2 was 44.8 ± 9.8 μM with a Vmax of 0.28 ± 0.07 pmol/ng/min (Fig. 4B), while the KM for BODIPY-PIP2 was 68.7 ± 5.2 μM with a Vmax of 1.02 ± 0.33 pmol/ng/min (Fig. 4C).
Measurement of the IC50 of PI3K inhibitors using fluorescent PIP2 derivatives
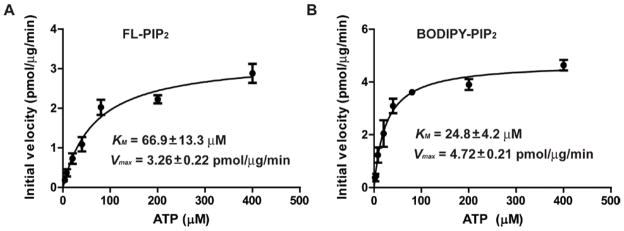
To test whether this in vitro assay system could be used to measure the effects of specific pharmaceutical agents on PI3K activity, the IC50 of two known PI3K inhibitors were measured using the two fluorescent PIP2 derivatives. Both LY294002 and wortmannin are considered to be ATP competitive inhibitors, with LY294002 being reversible and wortmannin irreversible 32–33. In contrast to the measurement for substrate kinetics where ATP must be saturated, the IC50 measurement for ATP competitive inhibitors requires that the ATP concentration is at or below the KM for ATP. Accordingly, the KM for ATP was measured when FL-PIP2 (Fig. 5A) or BODIPY-PIP2 (Fig. 5B) was used in the PI3K reaction. The KM, ATP was 66.9 ± 13.3 μM for FL-PIP2 and 24.8 ± 4.2 μM for BODIPY-PIP2, while Vmax, ATP was 3.26 ± 0.22 pmol/μg/min for FL-PIP2 and 4.72 ± 0.21 pmol/μg/min for BODIPY-PIP2. Based on these results, 20 μM ATP was used in the reaction mixture to measure the IC50 of the PI3K inhibitors.
Figure 5.
Measurement of KM for ATP for the PI3K reactions with FL-PIP2 (A) or BODIPY-PIP2 (B) as the lipid substrate. Each experiment was carried out in duplicate and repeated three times.
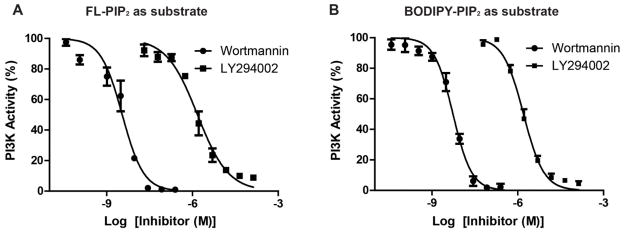
LY294002 or wortmannin were incubated with PI3K at room temperature for 10 min before the enzyme was added to the assay buffer to initiate the reaction. When FL-PIP2 was used as the PI3K substrate, the IC50 was 1.43 μM for LY294002 and 4.6 nM for wortmannin (Fig. 6A). Both of these values were consistent with those obtained with other methods 32, 34. Similarly, the IC50 for LY294002 and wortmannin (Fig. 6B) were carried out with BODIPY-PIP2 as the PI3K substrate. The IC50 was 1.41 μM and 6.2 nM, respectively.
Figure 6.
Dose response curves of PI3K inhibitors LY294002 and wortmannin. A. IC50 values of LY294002 and wortmannin were measured with FL-PIP2 as the PI3K substrate; B. IC50 values of LY294002 and wortmannin were measured with BODIPY-PIP2 as the PI3K substrate. Each experiment was carried out in duplicate and repeated three times.
In summary, we have established an in vitro assay system to directly measure PI3K activity. This assay takes advantage of the ready separation of a fluorphore-tagged PIP2 derivative from its PI3K reaction product on TLC or CE, and the high sensitivity of fluorescence detection. Both FL-PIP2 and BODIPY-PIP2 have similar KM when used as the PI3K substrate, and appear to function equally well to characterize PI3K inhibitors. On the other hand, the Vmax for BODIPY-PIP2 is approximately 4-fold greater than that for FL-PIP2. In addition, the BODIPY-PIP2 more easily forms micelles, a key character of endogenous PIP2, than FL-PIP2 as judged by their CMCs. Finally, the BODIPY fluorophore offers many advantages compared to fluorescein, including a narrow emission bandwidth, spectra that are less sensitive to polarity and pH, longer excited state lifetimes, and a large two-photon cross-section for multiphoton excitation. Taken together, these results suggest that both fluorescent probes are effective PI3K substrates that can be used to measure PI3K activity, but with fine differences. Given the important roles that PI3K plays in cell signaling and disease, this work will facilitate the use of fluorescent PIP2 derivatives in measuring PI3K activity in cell-based assays, including those using patient samples.
Acknowledgments
We thank the North Carolina University Cancer Research Fund and NIH (CA139599) for financial support.
References
- 1.Di Paolo G, De Camilli P. Phosphoinositides in cell regulation and membrane dynamics. Nature. 2006;443:651–657. doi: 10.1038/nature05185. [DOI] [PubMed] [Google Scholar]
- 2.Balla T, Szentpetery Z, Kim YJ. Phosphoinositide signaling: new tools and insights. Physiology (Bethesda) 2009;24:231–244. doi: 10.1152/physiol.00014.2009. [DOI] [PMC free article] [PubMed] [Google Scholar]
- 3.Castellino RC, Durden DL. Mechanisms of disease: the PI3K-Akt-PTEN signaling node--an intercept point for the control of angiogenesis in brain tumors. Nat Clin Pract Neurol. 2007;3:682–693. doi: 10.1038/ncpneuro0661. [DOI] [PubMed] [Google Scholar]
- 4.Wymann MP, Schneiter R. Lipid signalling in disease. Nat Rev Mol Cell Biol. 2008;9:162–176. doi: 10.1038/nrm2335. [DOI] [PubMed] [Google Scholar]
- 5.Liu ZN, Roberts TM. Human tumor mutants in the p110 alpha subunit of PI3K. Cell Cycle. 2006;5:675–677. doi: 10.4161/cc.5.7.2605. [DOI] [PubMed] [Google Scholar]
- 6.Anonymous. Comprehensive genomic characterization defines human glioblastoma genes and core pathways. Nature. 2008;455:1061–1068. doi: 10.1038/nature07385. [DOI] [PMC free article] [PubMed] [Google Scholar]
- 7.Yuan TL, Cantley LC. PI3K pathway alterations in cancer: variations on a theme. Oncogene. 2008;27:5497–5510. doi: 10.1038/onc.2008.245. [DOI] [PMC free article] [PubMed] [Google Scholar]
- 8.Liu P, Cheng H, Roberts TM, Zhao JJ. Targeting the phosphoinositide 3-kinase pathway in cancer. Nat Rev Drug Discov. 2009;8:627–644. doi: 10.1038/nrd2926. [DOI] [PMC free article] [PubMed] [Google Scholar]
- 9.Courtney KD, Corcoran RB, Engelman JA. The PI3K pathway as drug target in human cancer. J Clin Oncol. 2010;28:1075–1083. doi: 10.1200/JCO.2009.25.3641. [DOI] [PMC free article] [PubMed] [Google Scholar]
- 10.Workman P, Clarke PA, Raynaud FI, van Montfort RL. Drugging the PI3 kinome: from chemical tools to drugs in the clinic. Cancer Res. 2010;70:2146–2157. doi: 10.1158/0008-5472.CAN-09-4355. [DOI] [PMC free article] [PubMed] [Google Scholar]
- 11.Fruman DA, Meyers RE, Cantley LC. Phosphoinositide kinases. Annu Rev Biochem. 1998;67:481–507. doi: 10.1146/annurev.biochem.67.1.481. [DOI] [PubMed] [Google Scholar]
- 12.Hsu FF, Turk J. Characterization of phosphatidylinositol, phosphatidylinositol-4-phosphate, and phosphatidylinositol-4,5-bisphosphate by electrospray ionization tandem mass spectrometry: A mechanistic study. J Am Soc Mass Spectr. 2000;11:986–999. doi: 10.1016/S1044-0305(00)00172-0. [DOI] [PubMed] [Google Scholar]
- 13.Wenk MR, et al. Phosphoinositide profiling in complex lipid mixtures using electrospray ionization mass spectrometry. Nat Biotechnol. 2003;21:813–817. doi: 10.1038/nbt837. [DOI] [PubMed] [Google Scholar]
- 14.Balla T, Varnai P. Visualizing cellular phosphoinositide pools with GFP-fused protein-modules. Sci STKE. 2002;2002:pl3. doi: 10.1126/stke.2002.125.pl3. [DOI] [PubMed] [Google Scholar]
- 15.Gray A, Olsson H, Batty IH, Priganica L, Downes CP. Nonradioactive methods for the assay of phosphoinositide 3-kinases and phosphoinositide phosphatases and selective detection of signaling lipids in cell and tissue extracts. Anal Biochem. 2003;313:234–245. doi: 10.1016/s0003-2697(02)00607-3. [DOI] [PubMed] [Google Scholar]
- 16.Drees BE, et al. Competitive fluorescence polarization assays for the detection of phosphoinositide kinase and phosphatase activity. Comb Chem High T Scr. 2003;6:321–330. doi: 10.2174/138620703106298572. [DOI] [PubMed] [Google Scholar]
- 17.Taylor GS, Dixon JE. An assay for phosphoinositide phosphatases utilizing fluorescent substrates. Anal Biochem. 2001;295:122–126. doi: 10.1006/abio.2001.5179. [DOI] [PubMed] [Google Scholar]
- 18.Zhong W, Murphy DJ, Georgopapadakou NH. Inhibition of yeast inositol phosphorylceramide synthase by aureobasidin A measured by a fluorometric assay. FEBS Lett. 1999;463:241–244. doi: 10.1016/s0014-5793(99)01633-6. [DOI] [PubMed] [Google Scholar]
- 19.Ozaki S, DeWald DB, Shope JC, Chen J, Prestwich GD. Intracellular delivery of phosphoinositides and inositol phosphates using polyamine carriers. Proc Natl Acad Sci U S A. 2000;97:11286–11291. doi: 10.1073/pnas.210197897. [DOI] [PMC free article] [PubMed] [Google Scholar]
- 20.Borland LM, Kottegoda S, Phillips KS, Allbritton NL. Chemical analysis of single cells. Annu Rev Anal Chem (Palo Alto Calif) 2008;1:191–227. doi: 10.1146/annurev.anchem.1.031207.113100. [DOI] [PubMed] [Google Scholar]
- 21.Mwongela SM, Lee K, Sims CE, Allbritton NL. Separation of fluorescent phosphatidyl inositol phosphates by CE. Electrophoresis. 2007;28:1235–1242. doi: 10.1002/elps.200600594. [DOI] [PubMed] [Google Scholar]
- 22.Chen J, Profit AA, Prestwich GD. Synthesis of Photoactivatable 1,2-O-Diacyl-sn-glycerol Derivatives of 1-L-Phosphatidyl-D-myo-inositol 4,5-Bisphosphate (PtdInsP(2)) and 3,4,5-Trisphosphate (PtdInsP(3)) J Org Chem. 1996;61:6305–6312. doi: 10.1021/jo960895r. [DOI] [PubMed] [Google Scholar]
- 23.Barnett SF, et al. Interfacial catalysis by phosphoinositide 3′-hydroxykinase. Biochemistry. 1995;34:14254–14262. doi: 10.1021/bi00043a033. [DOI] [PubMed] [Google Scholar]
- 24.Carson JD, et al. Effects of oncogenic p110alpha subunit mutations on the lipid kinase activity of phosphoinositide 3-kinase. Biochem J. 2008;409:519–524. doi: 10.1042/BJ20070681. [DOI] [PubMed] [Google Scholar]
- 25.Tsamaloukas AD, Beck A, Heerklotz H. Modeling the micellization behavior of mixed and pure n-alkyl-maltosides. Langmuir. 2009;25:4393–4401. doi: 10.1021/la8033935. [DOI] [PubMed] [Google Scholar]
- 26.Walsh JP, Suen R, Glomset JA. Arachidonoyl-diacylglycerol kinase. Specific in vitro inhibition by polyphosphoinositides suggests a mechanism for regulation of phosphatidylinositol biosynthesis. J Biol Chem. 1995;270:28647–28653. doi: 10.1074/jbc.270.48.28647. [DOI] [PubMed] [Google Scholar]
- 27.Strandberg L, et al. Fluorescence studies on plasminogen activator inhibitor 1: reactive centre cysteine mutants remain active after fluorophore attachment. Thromb Res. 1994;76:253–267. doi: 10.1016/0049-3848(94)90197-x. [DOI] [PubMed] [Google Scholar]
- 28.Klonis N, Sawyer WH. Effect of solvent-water mixtures on the prototropic equilibria of fluorescein and on the spectral properties of the monoanion. Photochem Photobiol. 2000;72:179–185. doi: 10.1562/0031-8655(2000)072<0179:eoswmo>2.0.co;2. [DOI] [PubMed] [Google Scholar]
- 29.Schauenstein K, Schauenstein E, Wick G. Fluorescence properties of free and protein bound fluorescein dyes. I. Macrospectrofluorometric measurements. J Histochem Cytochem. 1978;26:277–283. doi: 10.1177/26.4.77868. [DOI] [PubMed] [Google Scholar]
- 30.Carpenter CL, et al. Purification and characterization of phosphoinositide 3-kinase from rat liver. J Biol Chem. 1990;265:19704–19711. [PubMed] [Google Scholar]
- 31.Carpenter CL, Cantley LC. Phosphoinositide kinases. Biochemistry. 1990;29:11147–11156. doi: 10.1021/bi00503a001. [DOI] [PubMed] [Google Scholar]
- 32.Vlahos CJ, Matter WF, Hui KY, Brown RF. A specific inhibitor of phosphatidylinositol 3-kinase, 2-(4-morpholinyl)-8-phenyl-4H-1-benzopyran-4-one (LY294002) J Biol Chem. 1994;269:5241–5248. [PubMed] [Google Scholar]
- 33.Vanhaesebroeck B, et al. Synthesis and function of 3-phosphorylated inositol lipids. Annu Rev Biochem. 2001;70:535–602. doi: 10.1146/annurev.biochem.70.1.535. [DOI] [PubMed] [Google Scholar]
- 34.Wymann MP, et al. Wortmannin inactivates phosphoinositide 3-kinase by covalent modification of Lys-802, a residue involved in the phosphate transfer reaction. Mol Cell Biol. 1996;16:1722–1733. doi: 10.1128/mcb.16.4.1722. [DOI] [PMC free article] [PubMed] [Google Scholar]


