

Abstract
The potential of personalized medicine to transform the treatment of mood disorders has been widely touted in psychiatry, but has not been quantified. We estimated the costs and benefits of a putative pharmacogenetic test for antidepressant response in the treatment of major depressive disorder (MDD) from the societal perspective. Specifically, we performed cost-effectiveness analyses using state-transition probability models incorporating probabilities from the multicenter STAR*D effectiveness study of MDD. Costs and quality-adjusted life years were compared for sequential antidepressant trials, with or without guidance from a pharmacogenetic test for differential response to selective serotonin reuptake inhibitors (SSRIs). Likely SSRI responders received an SSRI, while likely nonresponders received the norepinephrine/dopamine reuptake inhibitor bupropion. For a 40-year-old with major depressive disorder, applying the pharmacogenetic test and using the non-SSRI bupropion for those at higher risk for nonresponse cost $93,520 per additional quality-adjusted life-year (QALY) compared with treating all patients with an SSRI first and switching sequentially in the case of nonremission. Cost/QALY dropped below $50,000 for tests with remission rate ratios as low as 1.5, corresponding to odds ratios ~1.8–2.0. Tests for differential antidepressant response could thus become cost-effective under certain circumstances. These circumstances, particularly availability of alternative treatment strategies and test effect sizes, can be estimated and should be considered before these tests are broadly applied in clinical settings.
Keywords: pharmacogenetics, major depressive disorder, cost-effectiveness, serotonin
Introduction
Multiple antidepressant medications have demonstrated efficacy for the treatment of major depressive disorder. However, prospective comparisons and metaanalyses suggest little difference in efficacy between them. At the same time, many patients do not reach remission with initial antidepressant treatment, with consequences including greater functional impairment, greater likelihood of discontinuing treatment prematurely, and substantially increased medical costs associated with more chronic illness. It has been suggested that, by allowing patients to be matched to the treatment likely to be most effective for them, pharmacogenetic testing will provide an opportunity to improve depression treatment outcomes.
Recent studies have suggested that common genetic variations are associated with antidepressant response(Kim et al., 2006; McMahon et al., 2006; Perlis et al., 2008). Many of these results do not consistently replicate, do not address specificity of effect, or do not allow the estimation of the tests’ performance in a general clinical population. Still, with larger clinical cohorts, these limitations are being overcome and the development of pharmacogenetic predictors of treatment response has become an active area of investigation.
Surprisingly, the question of when such testing will be suitable for clinical application, commonly raised by clinicians, has received minimal attention in psychiatry(Perlis et al., 2005). Nonetheless, at least two psychiatric pharmacogenetic tests are now commercially available, with others in development.
The Sequenced Treatment Alternatives to Relieve Depression (STAR*D) study, which examined prospective outcomes in a very large cohort of patients receiving sequential antidepressant trials in a ‘real-world’ design, offers a unique opportunity to address the question of cost-effectiveness directly(Rush et al., 2004). We utilized clinical and genetic data from STAR*D to estimate the cost-effectiveness of a recently-reported pharmacogenetic test for antidepressant response which was replicated using a split-sample design(McMahon et al., 2006). Beyond examining the potential utility of that test as a ‘base case’, we developed a general-purpose model which allows the utility of any similar test to be estimated.
Methods
We modeled a population of individuals in a current episode of major depressive disorder, using a 3-year time horizon and societal perspective – that is, examining outcomes over 3 years from the perspective of the costs and health benefits to society. We incorporated data from the clinical literature in a model to estimate the outcome of alternative diagnostic and treatment strategies for a typical patient beginning outpatient treatment for MDD (see Figure 1). The treatment algorithm was based upon the ‘switch’ arms of the STAR*D study, with each treatment period lasting up to 12 weeks. Individuals are treated first with the SSRI citalopram. Those who fail to remit are then switched to bupropion, followed by nortriptyline, followed by the combination of venlafaxine and mirtazapine.
Decision analytic model for antidepressant treatment of major depressive disorder.
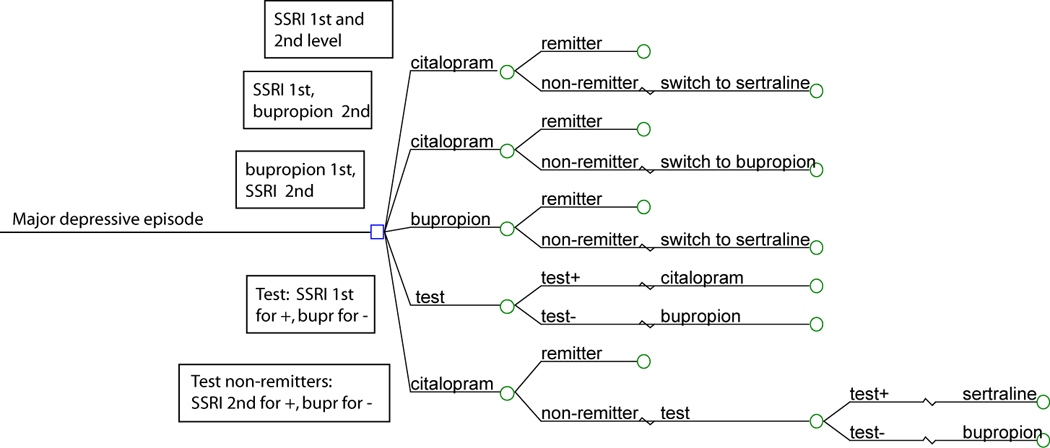
Figure 1 presents a schematic of the decision model used in this analysis. All patients begin in a major depressive episode. They may receive initial treatment with citalopram or bupropion, with or without treatment assignment based upon the result of the genetic test. Individuals who fail to respond to initial treatment may receive sertraline or bupropion.
We modeled the implementation of the test for SSRI responsiveness, either prior to any treatment (‘test-first’), or following an initial treatment failure (‘test-second’), compared to the ‘no-test’ condition (Figure 1). In the ‘test-first’ condition, those with a test result indicating greater likelihood of SSRI response are triaged to an SSRI, while those with a lesser likelihood are triaged to bupropion. In the ‘test-second’ condition, those who fail an initial SSRI receive either a second SSRI or bupropion, based upon test results. As outcomes with the atypical antidepressant bupropion or the SSRI sertraline as next-step treatments were similar in STAR*D(Rush et al., 2006b), we also varied the treatment strategies, allowing individuals to receive SSRI or bupropion as first- or second-line treatment. For purposes of comparison, we also examined a no-test, bupropion-first/citalopram-second strategy, to confirm that the test’s potential benefit did not simply derive from shifting patients to a more effective and lower cost strategy.
We developed a state-transition model of transition probabilities in which patients could occupy distinct health states, including depressed (on or off treatment) and well (on or off treatment)(Simon et al., 2006). (For a review of the application of state-transition models in cost-effectiveness research in a related field, see Hsieh(Hsieh and Meng, 2007)). We used a cohort simulation to track transitions between states representing the expected effects among patients of the alternate strategies (Supplemental Figure 1), with a cycle-length of 3 months, corresponding to the duration of each treatment level in STAR*D. In other words, every 3 months, individuals can transition from one state to another. Models were constructed using the Treeage Pro 2007 decision analysis program (TreeAge Software; Williamstown, MA).
Transition Probabilities (Table 1)
Table 1.
Parameters used in the base-case and sensitivity analyses
| Parameter | Estimate | Range* | Source |
|---|---|---|---|
| Patient age | 40.8 | 27.8–53.8 | STAR*D mean/SD(Trivedi et al., 2006) |
| Probabilities (3-month) | |||
| Background mortality rate | 0.000538 | n/a | (Arias, 2004) |
| Suicide rate for depressed | 0.0009 | 0.000275–0.0055 | (O'Carroll et al., 1996) |
| Probability of remitting on no treatment | 12% | 0 - minimum of other treatments in model | (Research, 1993) |
| Probability of relapse on no treatment | 12.4% | 4.8 – 27.3% | (Gijsman et al., 2004; Maj et al., 1992) (maximum from (McGrath et al., 2000)) |
| Probability of re-starting treatment if depressed (and quit previously) | 16.6% | 0 – 25% | (Kessler et al., 2003) |
| Treatment efficacy and tolerability | (Research, 1993; Rush et al., 2006a) | ||
| Probability of remission on SSRI (population averages) | |||
| If 1st level (citalopram) | 36.8% | 35.3 – 38.4% | (Rush et al., 2006a) |
| If 2nd level (sertraline) | 26.6% | 21.3 – 32.4% | (Rush et al., 2006a) |
| Probability of remission on bupropion | |||
| If 1st level | 36.8% | 35.3 – 38.4% | (Rush et al., 2006a) |
| If 2nd level | 26.6% | 21.3 – 32.4% | (Rush et al., 2006a) |
| Probability of remission on nortiptyline | 12.4% | 8.0 – 20.2% | (Rush et al., 2006a) |
| Probability of remission on venlafaxine + mirtzapine | 16.0% | 8.3 – 28.5% | (Rush et al., 2006a) |
| Probability of relapse on treatment | 4.8% | 0 – 14.2% | (Gijsman et al., 2004) |
| Probability of discontinuing treatment | (Rush et al., 2006a) | ||
| SSRI | 21.0% | 16.3 – 26.6% | |
| Bupropion | 27.2% | 21.9 – 33.2% | |
| Nortriptyline | 32.8% | 24.9 – 41.7% | |
| Venlafaxine/mirtazapine | 20.0% | 11.2 – 33.0% | |
| Probability of hospitalization | |||
| On treatment | 0.9% | 0.1 – 2.0% | (Valenstein et al., 2001) |
| Not on treatment | 1.4% | 0.1 – 2.0% | (Valenstein et al., 2001) |
| Test parameters | |||
| Probability of testing + | 56.8% | 5 – 95% | (McMahon et al., 2006) and Perlis RH, unpublished |
| Relative risk of recovery (test+ vs −) | 1.28 | (calculated) | (McMahon et al., 2006) and Perlis RH, unpublished |
| Implied genotype-specific 1st level recovery rates | 31.4 for test−, 40.1 for test+ | (calculated) | (calculated) |
| Implied genotype-specific 2nd level recovery rates | 22.8 for test−, 29.2 for test+ | (calculated) | (calculated) |
| Utilities | |||
| Recovered | |||
| Not on treatment | 0.88 | 0.80 – 1.0 | (Bennett et al., 2000; Revicki et al., 1995; Revicki and Wood, 1998) |
| Disutility of treatment (any) | 0.04 | 0 – 0.06 | (Revicki et al., 1995; Revicki and Wood, 1998) |
| Depressed | |||
| Not on treatment | 0.63 | 0.35 – 0.65 | (Revicki et al., 1995; Revicki and Wood, 1998; Schaffer et al., 2002) |
| Disutility on treatment (any) | 0.04 | −0.22 – 0.06 (adverse effects to partial symptom relief) | (Revicki et al., 1995;Revicki and Wood, 1998) |
| Costs | |||
| Drug costs (3 month) | (Anonymous, 2006) (Based on formulations closest in size to median dose) | ||
| SSRI (citalopram) | $251 | $188 – $314 | |
| Bupropion | $442 | $332 – $553 | |
| Nortiptyline | $248 | $186 – $310 | |
| Venlafaxine + mirtazapine | $840 | $630 – $1,050 | |
| Medication management visit costs | $191.41 | $144 – $239 | 2 visits per cycle for 70% receiving care from PCP + 4 visits per cycle from 30% seeing psychiatrist. Utilization was from(Grembowski et al., 2002); costs from Medicare fee schedule(Services, 2004). |
| Genotyping test cost | $500 | $0 – $1,000 | (Staples, 2007) |
| Cost of hospitalizations due to depression | $6889 per hospitalization. | $5,167 – $8,622 | (Quality) |
Except where specified, parameter ranges utilize 95% confidence intervals calculated from, or cited in, primary sources; for costs, parameter ranges utilize +/−25% of base case value.
For each state in the state-transition model, there is an associated mortality rate describing probability of death in a given cycle. For depressed patients, this rate is calculated by adding the rate of suicide among depressed patients(O'Carroll et al., 1996) to age-adjusted all-cause mortality rates from U.S. life tables(Statistics, 1998). For remitted patients, this is equal to the age-adjusted all-cause mortality rate. For sensitivity analyses, we used upper and lower bounds of the 95% confidence intervals around estimates of rates of death by suicide.
Probabilities of remission, discontinuation, and recurrence were drawn directly from those reported in STAR*D for each treatment level(Rush et al., 2006a). Because STAR*D and prior metaanalysis(Salloum et al., 2005) did not identify significant differences in remission between SSRI and bupropion, values for bupropion and SSRI were set to be equal. Probabilities of recurrence following remission for treated and untreated patients utilized data from a systematic review(Gijsman et al., 2004), with ranges incorporating additional long-term studies(Maj et al., 1992; McGrath et al., 2000).
Utilities (Health Effects)
Rather than simply considering whether subjects are alive or dead at each time point, the use of weights or utilities allows models to consider that different mood states may be associated with different quality of life (QOL). QOL weights for each mood and treatment state were drawn from the published literature, and can range from 0–1, with 1 representing ‘perfect’ quality of life. Remitted depression was assigned a utility of 0.88 based on values reported in studies assessing this health state directly using standard gamble and time-trade-off techniques(Bennett et al., 2000; Revicki et al., 1995; Revicki and Wood, 1998). Remitted depression without prophylaxis received utilities of 0.86 to 0.895. These values are generally consistent with the utilities reported for 40 year-olds in the Beaver Dam Health Outcomes Study(Fryback et al., 1993) and in more recent studies(Fryback et al., 2007; Sullivan et al., 2005). Untreated depression was assigned a utility of 0.63, which was varied from 0.35 to 0.65 in sensitivity analyses(Revicki et al., 1995; Revicki and Wood, 1998).Utilities reported for depression vary widely from 0.09 for severe, untreated depression to 0.75 for mild depression(Schaffer et al., 2002); the base case was selected conservatively to reflect the prevalence of mild depression in outpatient populations, as well as so-called ‘partial responders’ who improve with treatment but do not remit. Treatment was assigned a disutility of 0.04 in our base case to reflect side effects associated with treatment, varied from a disutility of 0.06 (adverse effects – that is, worse quality of life among individuals experiencing adverse effects and no symptomatic change) to a utility of 0.22 (partial symptom improvement without full remission) in sensitivity analyses.
Costs
The following direct medical costs were included in the base case model: outpatient treatment (medication management) visits, hospitalization for severe depression, and antidepressant medications. Direct costs due to suicide were not included to avoid double-counting, as hospitalization rates already include hospitalizations for suicide. All costs were inflated to 2006 U.S. dollars using the medical care component of the Consumer Price Index (CPI-M)(Gold et al., 1996). Drug costs were calculated from average wholesale generic price for the minimum number of pills necessary for median doses drawn from STAR*D.
As recommended by the Panel on Cost-effectiveness in Health and Medicine(Weinstein et al., 1996), indirect costs such as those related to lost productivity and career opportunities were not included in the analysis. Such disease effects are likely to be captured in the utility weights assigned by patients to health states such as depression, and would therefore be double-counted if included as costs as well.
Pharmacogenetic testing parameters
While a number of pharmacogenetic tests are under active development, we focused on a single nucleotide polymorphism (SNP) in the serotonin 2A receptor (HTR2A) gene, which was associated with citalopram response in the largest antidepressant pharmacogenetic study to date and replicated in a split-sample design(McMahon et al., 2006). That publication did not report effect size for association with remission, and utilized a definition of remission in which individuals with intermediate response phenotypes (i.e., significant improvement without remission) were omitted. We therefore obtained primary genotypic data from that study and calculated pertinent test parameters, including probability of a positive test in a mixed-ethnicity cohort (56.8%) and remission rate ratio (1.28; 95% CI, 1.13 to 1.42) for those with and without at least one copy of the ‘risk’ allele at rs7997012 in HTR2A. As the true mechanism of effect for this variation is not known, we assumed a dominant model of effect because it demonstrated stronger association than under a recessive model (Perlis RH, unpublished). For one-way sensitivity analysis, we assumed a range of probabilities of a positive test between 0.05 and 0.95. As the overall remission rate in the STAR*D clinical cohort was somewhat less than that observed in the genetic cohort(McMahon et al., 2006), we used weighted averages to recalculate remission rates assuming overall remission rates (36.8% for level 1 and 26.6% for level 2) equivalent to that in the clinical rather than genetic cohort. Of note, as the error rates with modern genotyping techniques are <<1%, and the reported test performance already accounts for such methodologic errors, we did not further correct for this source of error. For the one-way sensitivity analyses, as a primary purpose of this model was to examine the role of test parameters in pharmacogenetic test performance, we examined the effect of remission rate ratios ranging from 1 (i.e., no effect) to 2 (doubling of remission rate), corresponding to odds ratios for remission between 1 and 2.9 under our base assumptions for remission probability and allele frequencies. We considered effects in terms of remission rate ratios because this value is easily calculated from results in clinical trials and is not dependent on allele frequency (or probability of a positive test).
Discounting
We discounted all costs and health effects at an annual rate of 3% for the base case, with sensitivity analyses performed between 0% and 5%. This standard practice in cost-effectiveness analysis sets current costs as being worth more than those occurring in the future, reflecting the opportunity cost of spending money now (rather than, for example, investing it elsewhere) (Weinstein et al., 1996).
RESULTS
Base-Case Analysis
For a 40-year-old with MDD, the SSRI as first- and second-line strategy was both cheaper and more effective than all other no-test conditions (Table 2). This finding was driven by the lower cost and lower treatment discontinuation rate associated with SSRI treatment compared to bupropion treatment. Compared to this strategy of treating all patients with an SSRI as first and second line therapy, the strategy of testing patients first and initiating those testing negative on bupropion cost an additional $505.50 per patient but provided an additional 0.0054 quality-adjusted life years, yielding an incremental cost-effectiveness ratio (ICER) of $93,520 (Table 2). ICER refers to the marginal (increase in) cost divided by the marginal (increase in) effectiveness, compared to the next most costly option – how much additional cost would be required for each 1-year increase in quality-adjusted life years. The strategy of testing following an initial treatment failure was eliminated by extended dominance: relative to the common alternative of no testing, the strategy of testing patients first had a lower ICER, providing better value per dollar spent. (This is an example of extended dominance because testing first is more costly than testing following a treatment failure. If it were less costly, testing following a treatment failure would be eliminated through simple dominance as a more costly and less effective strategy. For additional examples, see (Center).)
Table 2.
Results of cost-effectiveness analysis
| Base Case Analysis | Incremental Values | ||||
|---|---|---|---|---|---|
| Cost-effectiveness | |||||
| Strategy | Cost | Effectiveness | Cost | Effectiveness | ratio (ICER) |
| No Test -- SSRI as level 1 and 2 | $3,380 | 2.119 | |||
| No Test -- SSRI then bupropion | $3,477 | 2.118 | Dominated* | ||
| No test -- Bupropion then SSRI | $3,481 | 2.117 | Dominated | ||
| Extended | |||||
| Test if non-response | $3,765 | 2.121 | dominance* | ||
| Test (+ gets ssri then ssri) | $3,890 | 2.124 | $510.00 | 0.0054 | $93,520 |
| Test (+ gets ssri then bupr) | $3,960 | 2.121 | Dominated | ||
Strategies are dominated if there is a competing strategy that is more effective and less costly. They are subject to extended dominance, sometimes referred to as weak dominance, if its incremental cost-effectiveness ratio is greater than, and its effectiveness less than, a competing strategy. For example, here ‘test if non-response’ is eliminated through extended dominance because its ICER is greater than the ‘test, give test positive subjects ssri followed by another ssri trial’, and its effectiveness is less. (For further examples, see (Center)).
Incremental values here are presented for non-dominated strategies only and are relative to the preceding non-dominated strategy. SSRI, selective serotonin reuptake inhibitor; bupr, bupropion
Sensitivity Analyses
In one-way sensitivity analyses, we examined the impact of varying individual model parameters bearing on costs, probabilities, and utility of mood and treatment states. In most one-way sensitivity analyses, the incremental cost-effectiveness ratio for testing fell in the $80,000 – $100,000/QALY range. As expected, the cost of the test itself had a large effect on cost-effectiveness; as test cost varied from $100 to $1000, ICER ranged from $19,152 to $186,029. When test cost was set to $0, the least costly strategy remains 2 SSRI trials, without testing. The other non-dominated strategy is the ‘test-first’ approach, which costs an additional $5.50 and adds 0.0054 QALYs for an ICER of $1,010. Costs of medication management visits, hospitalizations, and pharmacotherapies in general did not meaningfully impact ICER. In the latter case, this lack of difference is primarily attributable to the availability of generic preparations for the primary treatment options. The comparative cost of bupropion versus citalopram did impact which treatment-first option was favored, but with little meaningful effect on the ICER of testing.
We next examined the effects of varying test parameters or clinical cohorts. When we varied the response risk ratio over its 95% confidence interval (1.13 to 1.42), the ICER for testing decreased from $218,000 to $59,000 per QALY. We also considered scenarios where the genotype-specific remission rates are the same as in the base case, but the allele frequency is different. This circumstance might arise, for example, if a test identified in one ethnic group is applied in another ethnic group. In this case, the test's cost-effectiveness is greatest as the probability of a positive test approaches ~52%, the point at which the effectiveness of citalopram-first and bupropion-first strategies are equivalent. The cost/QALY is less than $100,000 for probability of a positive test between 36% and 59%. When the prevalence of a positive result is either very high or very low, the choice of initial treatment strategy is more clear-cut and testing provides relatively little improvement in overall remission rates. At prevalences of 5 or 95%, the ICER of testing exceeds $750,000/QALY.
We also explored the circumstances under which a different genetic test predicting SSRI response might be cost-effective. To do this, we held the overall level 1 and level 2 SSRI and bupropion response rates constant at 36.8% and 26.6% but varied the strength of the genotype / SSRI response association and the prevalence of the different genotypes in a 2-way analysis (that is, an analysis showing the effects of varying both parameters simultaneously) (Supplemental Figure 1). The benefit of genotyping is greatest when the prevalence of the two genotypes is approximately equal and when the absolute difference in response rates between the test+ and test- groups is the greatest. Under the base case assumptions, at a 'willingness to pay' of $50,000/QALY, the testing strategy can be cost-effective for ratios of remission between test+ and test- subjects as low as 1.5, provided the probability of a positive test is around 50%; this corresponds to an odds ratio of ~1.9.
For the primary analyses, efficacy of bupropion and SSRI were constrained to be the same as initial treatment, consistent with metaanalysis which fail to find significant efficacy differences between these treatments as first-line antidepressant options(Salloum et al., 2005). In sensitivity analysis, their efficacy was allowed to vary independently. As expected, this variation primarily impacts the relative cost-effectiveness of a bupropion-first versus SSRI-first strategy. However, in the extreme case where SSRI treatment is modeled as being substantially more efficacious, the benefit of bupropion treatment for test- subjects is reduced and therefore the benefit of testing to identify these subjects is also reduced. When the level 1 bupropion remission rate was reduced to 35.3%, testing (which triages test(−) patients to bupropion) became less effective and the ICER for this strategy increased to $145,000/QALY. Parameters of antidepressant treatment response otherwise had little impact on the model.
Finally, we varied the utility of mood states. As expected, when the disutility of depression increased (i.e., the discomfort of remaining depressed is considered to be greater), the value of testing increased, and vice versa. Notably, reducing the utility of untreated depression to 0.35 reduced the ICER to $54,128/QALY with base case assumptions, suggesting that testing may be more cost-effective in a more severely depressed population. In 3-way sensitivity analysis examining prevalence of a positive test, remission rate ratio for positive versus negative test, and utility of the depressed state (Supplemental Figure 2), for a depression utility of 0.35, testing ICER is below $50K if the likelihood of a positive test is ~50% and remission rate ratio (for test+ versus test-) is greater than 1.3.
DISCUSSION
Most genetic association studies conclude with a statement about how positive findings could be used to improve clinical outcomes, though cost-effectiveness of genetic tests has received remarkably little attention in psychiatry(Perlis et al., 2005). With our base-case assumptions, utilizing a large-scale effectiveness study intended to mimic clinical practice, the incremental cost-effectiveness of a putative pharmacogenetic test is $93,520/QALY relative to the next best strategy of using an SSRI as 1st and 2nd level treatment for all subjects. While there is no accepted threshold below which interventions should be funded, one widely-cited number, based on the cost-effectiveness of dialysis in chronic renal failure patients covered by Medicare, is $50,000/QALY(Winkelmayer et al., 2002). It has been noted that few interventions with cost-effectiveness ratios exceeding $100,000/QALY receive funding(Laupacis et al., 1992). Within psychiatry, a recent cost-effectiveness analysis suggested that a simple depression care program for employees led to an incremental cost-effectiveness ratio of $20,000 per QALY(Simon et al., 2006), consistent with other primary care quality-improvement programs yielding ratios less than $50,000(Simon et al., 2001). Relative to these numbers, the ICER for the genetic test, with our base-case assumptions, would not be considered cost-effective. Of course, as genotyping rapidly becomes a commodity, the cost of testing would likely fall substantially. In the extreme, where testing is free, the cost/QALY is ~$1,000, well within the range considered to be cost-effective. Notably, the magnitude of difference between QALYs resulting from the strategies examined is modest, and below the threshold suggested by some authors to represent clinically meaningful differences(Kaplan et al., 1993). On the other hand, given the prevalence and costliness of MDD, even modest differences in outcomes bear consideration by policymakers. In the subset of patients whose treatment is changed by testing, the initial response rate is increased by 5%. With a 0.25 QALY difference between a year of depression and a year of remission, this is arguably a clinically meaningful improvement.
With base-case assumptions, we found that a pharmacogenetic test for antidepressant response could only be considered cost-effective for tests with odds ratios ≥1.5. Multiple potential strategies could be applied by clinical researchers to identify such cost-effective tests. First, incorporating multiple informative loci will likely be necessary to achieve this threshold. Recent genomewide association studies of antidepressant response indicate that individual loci are likely to exert only modest effects(Hamilton, 2007), so any pharmacogenetic test would likely need to incorporate multiple informative loci to achieve an adequate OR. Second, more effective tests could incorporate other putative clinical predictors such as those identified in the STAR*D study (Trivedi et al., 2006). Addition of clinical predictors would simply be reflected in better test performance (i.e., greater effect sizes).
An alternate strategy would rely on tests informative about multiple treatment strategies: rather than focusing solely on SSRIs, a test which was also informative about common alternative strategies could be more cost-effective. To date, few antidepressant pharmacogenetic studies include such non-SSRI comparators and describe specific predictors for the alternate strategy. Similarly, the incorporation of predictors of adverse effects could offer another strategy for designing cost-effective tests. While modern antidepressants are quite safe and generally well-tolerated, many patients do discontinue treatment prematurely. A number of recent reports suggest that it may be possible to predict specific adverse effects(Laje et al., 2007; Perlis et al., 2003; Perlis et al., 2007).
Our results underscore the importance of understanding pharmacogenetic test performance in the population in which it is being applied. While this is true in general for any test, it becomes particularly important given the known wide variation in allele frequencies between racial groups(2003). Apart from individual studies in Southeast Asian or Latino populations(Kim et al., 2006; Wong et al., 2006), the vast majority of association studies for antidepressant responsiveness focus on Caucasians. Notably, the ‘beneficial’ allele frequency for the test considered here is less prevalent among African-Americans(McMahon et al., 2006). Our results demonstrate that the cost-effectiveness of such tests is critically dependent upon the effect size, and test probabilities, in the target population, suggesting that more representative cohorts will be required to determine the true utility of pharmacogenetic tests.
We note several caveats in interpreting our base-case results. Most importantly, our estimates rely on numerous assumptions about model parameters which are imprecise and likely to vary across clinical settings. However, a strength of this study is that it closely follows results of one of the largest antidepressant-effectiveness studies completed to date. Not only was that study designed to mirror clinical practice, but it took place in both primary care and specialty psychiatric clinics, suggesting our results can be informative about 'real-world' treatment of MDD(Rush et al., 2004). Many of the parameters not drawn from STAR*D were previously utilized in a cost-effectiveness model of an employer-based depression intervention(Wang et al., 2006) which was later validated in a prospective study(Wang et al., 2007). This model can thus be understood in terms of 'how might STAR*D outcomes have differed if initial treatment assignment was determined by a genetic test', assuming a standard set of next-step interventions. Of note, our results likely underestimate the ‘true’ cost-effectiveness of the intervention because, as with most such analyses, we do not include the costs to caregivers or other family members(Weinstein et al., 1996).
We emphasize that, although we utilized an existing genetic finding as our base case, the general model can be applied to any pharmacogenetic test of antidepressant response. The code for this model is available at [website]; simply substituting the appropriate test parameters allows cost-effectiveness of that test to be estimated. The first marketed pharmacogenetic test to be advocated for antidepressant prescribing is actually one which examines cytochrome p450 variation(Somanath et al., 2002), though it has previously been suggested that such a test is likely to have little impact on general antidepressant prescribing(Perlis, 2007). Similarly, a serotonin transporter promoter insertion/deletion polymorphism is the genetic variation most often associated with antidepressant responsiveness, albeit in small cohorts(Serretti et al., 2006). However, the specificity of its effect is not well characterized, and the largest cohort to date did not detect an association with treatment response, though incorporating an additional polymorphism did identify some association with overall citalopram tolerability(Hu et al., 2007). Therefore, we focused on the HTR2A variation because it was replicated in a split-sample design and exerts a well-defined impact on response. We note that, even if it represents a true association, its effect size is almost certainly less than that estimated here, based upon the phenomenon of the ‘winner’s curse’, or regression to the mean. Future pharmacogenetic tests will almost certainly incorporated multiple markers drawn from genomewide association studies, but the basic principles of our model can be applied regardless of the type or scale of the genetic test.
We also made the simplifying assumption that the HTR2A-based test is not informative about response to other (non-SSRI) treatments. While this appears to be the case in STAR*D (Laje and McMahon, unpublished data) and other cohorts (Perlis, unpublished data), these effects have not been fully characterized. In general, this assumption would yield an optimistic estimate in the base case, and underscores the need to understand not simply predictors of nonresponse to a given treatment, but the specificity of such predictors, prior to their clinical application. That is, it will be important to characterize not only predictors of differential response to a single treatment, but also the effects of such predictors on response to alternative treatment strategies.
Third, we included two primary types of states in our state-transition model, 'depressed' and 'well', either on- or off-antidepressant. The gradation of treatment responses in depression is well-known - based upon STAR*D, roughly one-third of patients improve with treatment but do not reach symptomatic remission(Trivedi et al., 2006). The effects of including individuals who improve but do not remit in treatment among the 'depressed' state would be to dilute or decrease the disutility of depression, rendering our model overly conservative. On the other hand, the significant impact of continued depressive symptoms even among those who improve with treatment is well-documented(Wells et al., 2007).
A further simplification was the requirement that nonremitters have their treatment switched, rather than augmented (Fava, 2001). In routine outpatient settings, augmentation is generally a much less common strategy, particularly in primary care settings. A survey of clinicians suggested that substantial variation exists in their preference for treatment sequence(Petersen et al., 2002), perhaps because other prior to STAR*D there was little controlled data bearing on the efficacy of augmentation in general(Fava, 2001).
Notwithstanding these caveats, our results suggest a means for evaluating future pharmacogenetic tests in psychiatry. To our knowledge, only one previous report addressed the value of such psychiatric tests in terms of cost-effectiveness; in that study, we found that a test for clozapine responsiveness could be cost-effective under certain conditions(Perlis et al., 2005). As with pharmacotherapy, determining the true cost-effectiveness of a diagnostic intervention will require either large randomized prospective studies or retrospective assessment of large clinical population. With the substantial public interest in personalized medicine, pressure will be great to quickly translate tests to clinical practice. Our results suggest that the cost-effectiveness of these tests can be modeled in a straightforward fashion, allowing necessary test parameters and integration with treatment algorithms to be carefully considered prior to implementation.
Supplementary Material
Supplemental Figure 1 presents a schematic diagram of the state-transition model used in this analysis. All subjects begin in the “depressed, on antidepressant” state. Probabilities of transitions between states are adjusted based upon treatment selection and test results.
Supplemental Figure 2. Three-way sensitivity analysis of prevalence of positive test for SSRI response, relative risk of remission in test+ versus test- subjects, and utility of depressed state.
Two-way sensitivity analysis of the prevalence of a positive test result and the strength of association between test result and SSRI response.
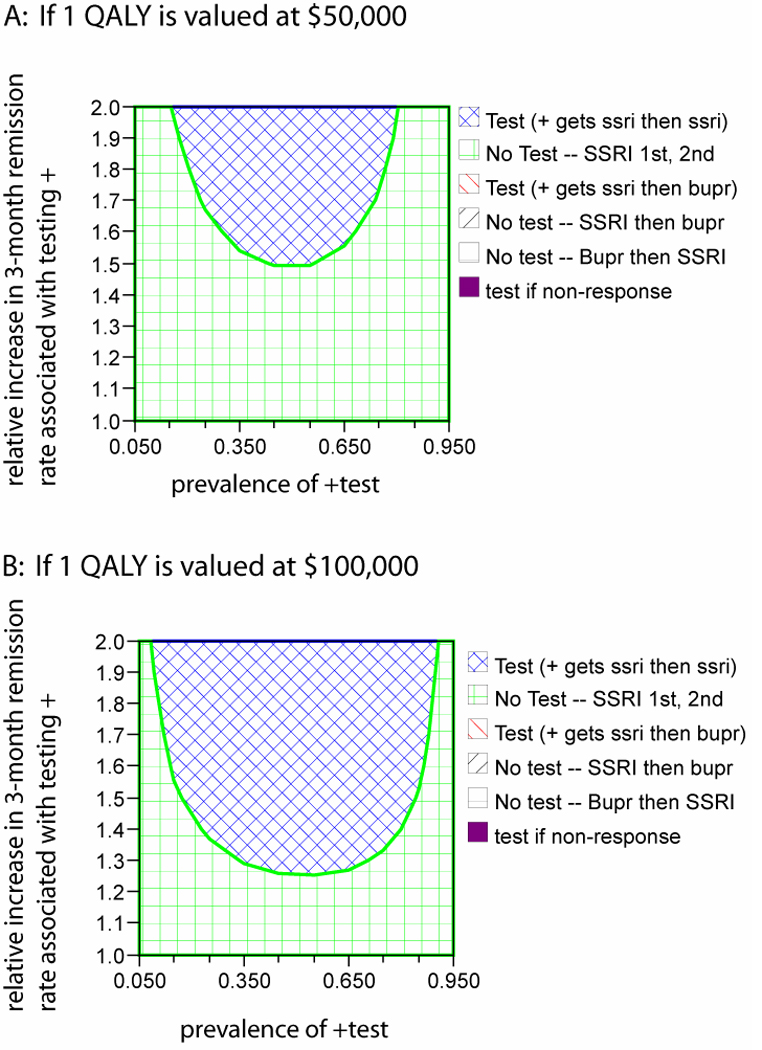
2-way sensitivity analysis of the prevalence of a positive test result and the strength of association between test result and SSRI response. The top panel assumes a willingness to pay of $50,000 per quality-adjusted life year (QALY). The bottom panel increases this value to $100,000 per QALY. For each value of the prevalence of test+ and test effect size, an optimal strategy can be found by identifying the corresponding region in the graph and matching the color of that region to the color-coded key. SSRI, selective serotonin reuptake inhibitor; bupr, bupropion
Acknowledgment
Supported by NIMH K23-MH67060, NARSAD and the Sydney R. Baer, Jr. Foundation, and the Bowman Family Foundation (Dr. Perlis) and NIMH R01-MH6194 (Dr. Wang). No pharmaceutical company was involved in any way in initiating, conducting, or supporting this research.
Footnotes
Disclosure of Financial Competing Interests
Roy Perlis, MD MSc
Research Support: Eli Lilly & Company
Advisory/Consulting: AstraZeneca, Bristol-Myers Squibb, Eli Lilly & Company, Pfizer Inc, Proteus
Speaking: AstraZeneca, Bristol-Myers Squibb Company, Eli Lilly & Company, GlaxoSmithkline, Pfizer Inc
Equity Holdings: Concordant Rater Systems, LLC
Royalty/patent, other income: Concordant Rater Systems, LLC
Jordan Smoller, MD, ScD
Dr. Smoller has received honoraria from Hoffman-La Roche, Inc and has served on an advisory board for Roche Diagnostics Corporation. He has received research funding from the National Institute of Mental Health and the National Alliance for Research in Schizophrenia and Depression.
The other authors have no financial competing interests to disclose.
References
- The International HapMap Project. Nature. 2003;426:789–796. doi: 10.1038/nature02168. [DOI] [PubMed] [Google Scholar]
- Anonymous . Drug Topics Red Book. 108th Ed. Montvale, NJ: Medical Economics; 2006. [Google Scholar]
- Arias E. United States Life Tables. Hyattsville, MD: National Center for Health Statistics; 2004. [PubMed] [Google Scholar]
- Bennett KJ, Torrance GW, Boyle MH, Guscott R, Moran LA. Development and testing of a utility measure for major, unipolar depression (McSad) Qual Life Res. 2000;9:109–120. doi: 10.1023/a:1008952602494. [DOI] [PubMed] [Google Scholar]
- Center UDoVAHER [Google Scholar]
- Fava M. Augmentation and combination strategies in treatment-resistant depression. J Clin Psychiatry. 2001;62(Suppl 18):4–11. [PubMed] [Google Scholar]
- Fryback DG, Dasbach EJ, Klein R, Klein BE, Dorn N, Peterson K, et al. The Beaver Dam Health Outcomes Study: initial catalog of health-state quality factors. Med Decis Making. 1993;13:89–102. doi: 10.1177/0272989X9301300202. [DOI] [PubMed] [Google Scholar]
- Fryback DG, Dunham NC, Palta M, Hanmer J, Buechner J, Cherepanov D, et al. US norms for six generic health-related quality-of-life indexes from the National Health Measurement study. Med Care. 2007;45:1162–1170. doi: 10.1097/MLR.0b013e31814848f1. [DOI] [PMC free article] [PubMed] [Google Scholar]
- Gijsman HJ, Geddes JR, Rendell JM, Nolen WA, Goodwin GM. Antidepressants for bipolar depression: a systematic review of randomized, controlled trials. Am J Psychiatry. 2004;161:1537–1547. doi: 10.1176/appi.ajp.161.9.1537. [DOI] [PubMed] [Google Scholar]
- Gold MR, Siegel JE, Russell LB, Weinstein MC, editors. Cost-effectiveness in health and medicine. New York: Oxford University Press; 1996. [Google Scholar]
- Grembowski DE, Martin D, Patrick DL, Diehr P, Katon W, Williams B, et al. Managed care, access to mental health specialists, and outcomes among primary care patients with depressive symptoms. J Gen Intern Med. 2002;17:258–269. doi: 10.1046/j.1525-1497.2002.10321.x. [DOI] [PMC free article] [PubMed] [Google Scholar]
- Hamilton S. Pharmacogenetics in Psychiatry. New York, NY: 2007. [Google Scholar]
- Hsieh MH, Meng MV. Decision analysis and Markov modeling in urology. J Urol. 2007;178:1867–1874. doi: 10.1016/j.juro.2007.07.006. [DOI] [PubMed] [Google Scholar]
- Hu XZ, Rush AJ, Charney D, Wilson AF, Sorant AJ, Papanicolaou GJ, et al. Association between a functional serotonin transporter promoter polymorphism and citalopram treatment in adult outpatients with major depression. Arch Gen Psychiatry. 2007;64:783–792. doi: 10.1001/archpsyc.64.7.783. [DOI] [PubMed] [Google Scholar]
- Kaplan RM, Feeny D, Revicki DA. Methods for assessing relative importance in preference based outcome measures. Qual Life Res. 1993;2:467–475. doi: 10.1007/BF00422221. [DOI] [PubMed] [Google Scholar]
- Kessler RC, Berglund P, Demler O, Jin R, Koretz D, Merikangas KR, et al. The epidemiology of major depressive disorder: results from the National Comorbidity Survey Replication (NCS-R) Jama. 2003;289:3095–3105. doi: 10.1001/jama.289.23.3095. [DOI] [PubMed] [Google Scholar]
- Kim H, Lim SW, Kim S, Kim JW, Chang YH, Carroll BJ, et al. Monoamine transporter gene polymorphisms and antidepressant response in koreans with late-life depression. Jama. 2006;296:1609–1618. doi: 10.1001/jama.296.13.1609. [DOI] [PubMed] [Google Scholar]
- Laje G, Paddock S, Manji H, Rush AJ, Wilson AF, Charney D, et al. Genetic markers of suicidal ideation emerging during citalopram treatment of major depression. Am J Psychiatry. 2007;164:1530–1538. doi: 10.1176/appi.ajp.2007.06122018. [DOI] [PubMed] [Google Scholar]
- Laupacis A, Feeny D, Detsky AS, Tugwell PX. How attractive does a new technology have to be to warrant adoption and utilization? Tentative guidelines for using clinical and economic evaluations. Cmaj. 1992;146:473–481. [PMC free article] [PubMed] [Google Scholar]
- Maj M, Veltro F, Pirozzi R, Lobrace S, Magliano L. Pattern of recurrence of illness after recovery from an episode of major depression: a prospective study. Am J Psychiatry. 1992;149:795–800. doi: 10.1176/ajp.149.6.795. [DOI] [PubMed] [Google Scholar]
- McGrath PJ, Stewart JW, Petkova E, Quitkin FM, Amsterdam JD, Fawcett J, et al. Predictors of relapse during fluoxetine continuation or maintenance treatment of major depression. J Clin Psychiatry. 2000;61:518–524. doi: 10.4088/jcp.v61n0710. [DOI] [PubMed] [Google Scholar]
- McMahon FJ, Buervenich S, Charney D, Lipsky R, Rush AJ, Wilson AF, et al. Variation in the gene encoding the serotonin 2A receptor is associated with outcome of antidepressant treatment. Am J Hum Genet. 2006;78:804–814. doi: 10.1086/503820. [DOI] [PMC free article] [PubMed] [Google Scholar]
- O'Carroll PW, Berman AL, Maris RW, Moscicki EK, Tanney BL, Silverman MM. Beyond the Tower of Babel: a nomenclature for suicidology. Suicide Life Threat Behav. 1996;26:237–252. [PubMed] [Google Scholar]
- Perlis RH. Cytochrome P450 genotyping and antidepressants. Bmj. 2007;334:759. doi: 10.1136/bmj.39169.547512.80. [DOI] [PMC free article] [PubMed] [Google Scholar]
- Perlis RH, Ganz DA, Avorn J, Schneeweiss S, Glynn RJ, Smoller JW, et al. Pharmacogenetic testing in the clinical management of schizophrenia: a decision-analytic model. J Clin Psychopharmacol. 2005;25:427–434. doi: 10.1097/01.jcp.0000177553.59455.24. [DOI] [PubMed] [Google Scholar]
- Perlis RH, Mischoulon D, Smoller JW, Wan YJ, Lamon-Fava S, Lin KM, et al. Serotonin transporter polymorphisms and adverse effects with fluoxetine treatment. Biol Psychiatry. 2003;54:879–883. doi: 10.1016/s0006-3223(03)00424-4. [DOI] [PubMed] [Google Scholar]
- Perlis RH, Moorjani P, Fagerness J, Purcell S, Trivedi MH, Fava M, et al. Pharmacogenetic Analysis of Genes Implicated in Rodent Models of Antidepressant Response: Association of TREK1 and Treatment Resistance in the STAR(*)D Study. Neuropsychopharmacology. 2008 doi: 10.1038/npp.2008.6. [DOI] [PMC free article] [PubMed] [Google Scholar]
- Perlis RH, Purcell S, Fava M, Fagerness J, Rush AJ, Trivedi MH, et al. Association Between Treatment-Emergent Suicidal Ideation With Citalopram and Polymorphisms Near Cyclic Adenosine Monophosphate Response Element Binding Protein in the STAR*D Study. Arch Gen Psychiatry. 2007;64:689–697. doi: 10.1001/archpsyc.64.6.689. [DOI] [PubMed] [Google Scholar]
- Petersen T, Dording C, Neault NB, Kornbluh R, Alpert JE, Nierenberg AA, et al. A survey of prescribing practices in the treatment of depression. Prog Neuropsychopharmacol Biol Psychiatry. 2002;26:177–187. doi: 10.1016/s0278-5846(01)00250-0. [DOI] [PubMed] [Google Scholar]
- Quality AfHRa [Google Scholar]
- Clinical Practice Guideline, No. 5. Rockville, MD: U.S. Dept. of Health and Human Services; 1993. Depression in Primary Care. Vol 2. Treatment of Major Depression. (AHCPR publication no. 93-0550.) [Google Scholar]
- Revicki DA, Brown RE, Palmer W, Bakish D, Rosser WW, Anton SF, et al. Modelling the cost effectiveness of antidepressant treatment in primary care. Pharmacoeconomics. 1995;8:524–540. doi: 10.2165/00019053-199508060-00007. [DOI] [PubMed] [Google Scholar]
- Revicki DA, Wood M. Patient-assigned health state utilities for depression-related outcomes: differences by depression severity and antidepressant medications. J Affect Disord. 1998;48:25–36. doi: 10.1016/s0165-0327(97)00117-1. [DOI] [PubMed] [Google Scholar]
- Rush AJ, Fava M, Wisniewski SR, Lavori PW, Trivedi MH, Sackeim HA, et al. Sequenced Treatment Alternatives to Relieve Depression (STAR*D): Rationale and Design. Control Clin Trials. 2004:118–141. doi: 10.1016/s0197-2456(03)00112-0. [DOI] [PubMed] [Google Scholar]
- Rush AJ, Trivedi MH, Wisniewski SR, Nierenberg AA, Stewart JW, Warden D, et al. Acute and longer-term outcomes in depressed outpatients requiring one or several treatment steps: a STAR*D report. Am J Psychiatry. 2006a;163:1905–1917. doi: 10.1176/ajp.2006.163.11.1905. [DOI] [PubMed] [Google Scholar]
- Rush AJ, Trivedi MH, Wisniewski SR, Stewart JW, Nierenberg AA, Thase ME, et al. Bupropion-SR, sertraline, or venlafaxine-XR after failure of SSRIs for depression. N Engl J Med. 2006b;354:1231–1242. doi: 10.1056/NEJMoa052963. [DOI] [PubMed] [Google Scholar]
- Salloum IM, Cornelius JR, Daley DC, Kirisci L, Himmelhoch JM, Thase ME. Efficacy of valproate maintenance in patients with bipolar disorder and alcoholism: a double-blind placebo-controlled study. Arch Gen Psychiatry. 2005;62:37–45. doi: 10.1001/archpsyc.62.1.37. [DOI] [PubMed] [Google Scholar]
- Schaffer A, Levitt AJ, Hershkop SK, Oh P, MacDonald C, Lanctot K. Utility scores of symptom profiles in major depression. Psychiatry Res. 2002;110:189–197. doi: 10.1016/s0165-1781(02)00097-5. [DOI] [PubMed] [Google Scholar]
- Serretti A, Cusin C, Rausch JL, Bondy B, Smeraldi E. Pooling pharmacogenetic studies on the serotonin transporter: a mega-analysis. Psychiatry Res. 2006;145:61–65. doi: 10.1016/j.psychres.2005.09.020. [DOI] [PubMed] [Google Scholar]
- Services CfMaM. 2004 [Google Scholar]
- Simon GE, Savarino J, Operskalski B, Wang PS. Suicide risk during antidepressant treatment. Am J Psychiatry. 2006;163:41–47. doi: 10.1176/appi.ajp.163.1.41. [DOI] [PubMed] [Google Scholar]
- Simon GE, Von Korff M, Rutter CM, Peterson DA. Treatment process and outcomes for managed care patients receiving new antidepressant prescriptions from psychiatrists and primary care physicians. Arch Gen Psychiatry. 2001;58:395–401. doi: 10.1001/archpsyc.58.4.395. [DOI] [PubMed] [Google Scholar]
- Somanath CP, Jain S, Reddy YC. A family study of early-onset bipolar I disorder. J Affect Disord. 2002;70:91–94. doi: 10.1016/s0165-0327(00)00372-4. [DOI] [PubMed] [Google Scholar]
- Staples J. 2007 [Google Scholar]
- Hyattsville, MD: US Dept HHS; 1998. [Google Scholar]
- Sullivan PW, Lawrence WF, Ghushchyan V. A national catalog of preference-based scores for chronic conditions in the United States. Med Care. 2005;43:736–749. doi: 10.1097/01.mlr.0000172050.67085.4f. [DOI] [PubMed] [Google Scholar]
- Trivedi MH, Rush AJ, Wisniewski SR, Nierenberg AA, Warden D, Ritz L, et al. Evaluation of outcomes with citalopram for depression using measurement-based care in STAR*D: implications for clinical practice. Am J Psychiatry. 2006;163:28–40. doi: 10.1176/appi.ajp.163.1.28. [DOI] [PubMed] [Google Scholar]
- Valenstein M, Vijan S, Zeber JE, Boehm K, Buttar A. The cost-utility of screening for depression in primary care. Ann Intern Med. 2001;134:345–360. doi: 10.7326/0003-4819-134-5-200103060-00007. [DOI] [PubMed] [Google Scholar]
- Wang PS, Patrick A, Avorn J, Azocar F, Ludman E, McCulloch J, et al. The costs and benefits of enhanced depression care to employers. Arch Gen Psychiatry. 2006;63:1345–1353. doi: 10.1001/archpsyc.63.12.1345. [DOI] [PubMed] [Google Scholar]
- Wang PS, Simon GE, Avorn J, Azocar F, Ludman EJ, McCulloch J, et al. Telephone screening, outreach, and care management for depressed workers and impact on clinical and work productivity outcomes: a randomized controlled trial. Jama. 2007;298:1401–1411. doi: 10.1001/jama.298.12.1401. [DOI] [PMC free article] [PubMed] [Google Scholar]
- Weinstein MC, Siegel JE, Gold MR, Kamlet MS, Russell LB. Recommendations of the Panel on Cost-effectiveness in Health and Medicine. Jama. 1996;276:1253–1258. [PubMed] [Google Scholar]
- Wells KB, Schoenbaum M, Duan N, Miranda J, Tang L, Sherbourne C. Cost-effectiveness of quality improvement programs for patients with subthreshold depression or depressive disorder. Psychiatr Serv. 2007;58:1269–1278. doi: 10.1176/ps.2007.58.10.1269. [DOI] [PubMed] [Google Scholar]
- Winkelmayer WC, Weinstein MC, Mittleman MA, Glynn RJ, Pliskin JS. Health economic evaluations: the special case of end-stage renal disease treatment. Med Decis Making. 2002;22:417–430. doi: 10.1177/027298902236927. [DOI] [PubMed] [Google Scholar]
- Wong ML, Whelan F, Deloukas P, Whittaker P, Delgado M, Cantor RM, et al. Phosphodiesterase genes are associated with susceptibility to major depression and antidepressant treatment response. Proc Natl Acad Sci U S A. 2006;103:15124–15129. doi: 10.1073/pnas.0602795103. [DOI] [PMC free article] [PubMed] [Google Scholar]
Associated Data
This section collects any data citations, data availability statements, or supplementary materials included in this article.
Supplementary Materials
Supplemental Figure 1 presents a schematic diagram of the state-transition model used in this analysis. All subjects begin in the “depressed, on antidepressant” state. Probabilities of transitions between states are adjusted based upon treatment selection and test results.
Supplemental Figure 2. Three-way sensitivity analysis of prevalence of positive test for SSRI response, relative risk of remission in test+ versus test- subjects, and utility of depressed state.