Abstract
Purpose
Improved data collection methods have improved absorbed dose estimation by tracking activity distributions and tumor extent at multiple time points, allowing individualized absorbed dose estimation. Treatment with tositumomab and 131I-tositumomab anti-CD20 radioimmunotherapy (BEXXAR) yields a cold antibody antitumor response (cold protein effect) and a radiation response. Biologically effective contributions, including the cold protein effect, are included in an equivalent biological effect model that was fit to patient data.
Methods
Fifty-seven tumors in 19 patients were followed using 6 single proton emission computed tomography (SPECT)/CT studies, 3 each post tracer (5 mCi) and therapy (~100 mCi) injections with tositumomab and 131I-tositumomab. Both injections used identical antibody mass, a flood dose of 450 mg plus 35 mg of 131I tagged antibody. The SPECT/CT data were used to calculate absorbed dose rate distributions and tumor and whole-body time-activity curves, yielding a space-time dependent absorbed dose rate description for each tumor. Tumor volume outlines on CT were used to derive the time dependence of tumor size for tracer and therapy time points. A combination of an equivalent biological effect model and an inactivated cell clearance model was used to fit absorbed dose sensitivity and cold effect sensitivity parameters to tumor shrinkage data, from which equivalent therapy values were calculated.
Results
Patient responses were categorized into three groups: standard radiation sensitivity with no cold effect (7 patients), standard radiation sensitivity with cold effect (11 patients), and high radiation sensitivity with cold effect (1 patient).
Conclusion
Fit parameters can be used to categorize patient response, implying a potential predictive capability.
Keywords: Tumor volume, Equivalent biological effect, Tumor response, Radiolabeled antibody therapy Non-Hodgkin’s lymphoma
Introduction
Individualized treatment planning may benefit from equivalent therapy modeling techniques to help correlate equivalent therapy with objective patient outcome. Improved data collection is yielding improved absorbed dose estimation by tracking activity distributions and tumor extent at multiple time points [1]. The incorporation into an equivalent therapy model of confounding factors involved in tumor response may be important for the optimum correlation of planned therapy and treatment outcome.
Tositumomab and 131I-tositumomab anti-CD20 radio-immunotherapy (BEXXAR) has successfully treated relapsed or refractory B-cell non-Hodgkin’s lymphoma (NHL) [2, 3]. The therapeutic effect of the antibody alone (cold protein effect) is significant. However, therapeutic trials with the addition of radionuclide therapy have shown a consistent advantage over antibody alone [4]. The presence of a significant therapeutic element in addition to radiation therapy may be providing a confounding factor to the interpretation of the therapeutic effect. The application of equivalent therapy concepts to NHL patient dosimetry may provide an improved platform for interpretation of therapeutic effect.
The equivalent biological effect (E) is the negative log of the cumulative clonogenic cell surviving fraction [5–7]. The local surviving fraction is the exponential of the local biological effective therapy (BET), which for therapies involving only the absorbed dose, corresponds to the radiation response coefficient (α) times the biological effective dose (BED). In more complex therapies, the BET is expressed in terms of the biological effect of the true absorbed dose, dose rate, and other terms (e.g., cell proliferation, chemotherapy [8], hyperthermia therapy [9], and immunotherapy) that affect tumor response. The extension to a four-dimensional (space-time) analysis implies the use of a spatially and time-dependent definition of BET, typically using tumor subunits [10]. The tumor subunits can be used to form biological effect histograms [11]. To convert to a single therapeutic score, the spatially averaged surviving fraction at a specific time can be related to E and/or an equivalent absorbed dose parameter (e.g., equivalent uniform dose, EUD). Here, E is equivalent biological (therapeutic) effect defined at the time minimum of the cell surviving fraction. EUD is the equivalent therapeutic effect of a uniform absorbed dose with linear response coefficient, α, and is equal to E/α.
To help account for the therapeutic effect of cold protein in the present work, a cold effect term was introduced into the BET. An initial report demonstrated the feasibility of this approach1 using an example data set (six patients) [12]. Here, we use a more extensive data set (data from 19 patients) to determine average model parameters while exploring the inherent variability of the patient population and proposing patient response classifications, a potentially key element for the development of individualized treatment planning. EUDs generated from this data set significantly correlated with tumor shrinkage [13].
Data collected detailing the antibody distribution and initial tumor response for tracer and therapeutic doses were used to perform a separation of the therapeutic effects of cold protein and absorbed dose. The cold protein effect is modeled assuming the probability of cell inactivation due to antibody alone is proportional to the time the antibody stays bound to the cell. The current model assumes that the probability of the antibody-cell bound state is proportional to the presence of radioactivity in the tumor volume. No synergistic or destructive interactions between the therapeutic effects were included in the model.
Our objective is to illustrate potential benefits (e.g., patient response classifications) of performing equivalent biological effect and cell clearance model calculations including the cold protein effect for analysis during patient treatment for NHL using tositumomab and 131I-tositumomab.
Materials and methods
Data collection
Twenty refractory NHL patients (18 follicular, 2 marginal zone) undergoing 131I radioimmunotherapy in The Nuclear Medicine Clinic at the University of Michigan volunteered for this pilot study. Patients gave their separate written informed consent for all of the single proton emission computed tomography (SPECT)/CT imaging, which was not part of the normal 131I-tositumomab protocol. This imaging received separate University of Michigan Internal Review Board approval. Patients received a tracer infusion (5 mCi) of 131I-tositumomab followed in 7 or 8 days by a therapy infusion (~100 mCi) of 131I-tositumomab using equal quantities of protein, a 450 mg flood injection followed by 35 mg 131I-tagged injection [3, 14]. Patients were imaged on a Siemens Symbia TruePoint SPECT/CT scanner (Hoffman Estates, IL, USA) with a six-slice CT capability. For the SPECT, a high-energy parallel-hole collimator was used with 180° and 30 stops per head; 40 s per stop; body contouring; 20% photopeak at 364 keV; two adjacent 6% scatter correction windows; and a 128 × 128 matrix with a pixel size of 4.8 mm. The CT component of acquisition used full-circle rotation, 130 kV, and 35 mAs. The CT scan time was less than 20 s and was obtained without contrast and without a breath hold. The CT data were reconstructed with a 512 × 512 × 196 matrix and 0.98×0.98×2 mm voxel size. University of Michigan software was used for SPECT/CT reconstruction and quantification. Projection data were reconstructed using ordered subsets expectation maximization (OSEM). Data were reconstructed by using 35 iterations and 6 subsets and included 3-D depth-dependent detector response compensation, attenuation correction, and scatter correction. To account for partial volume effects, recovery coefficients determined for phantom measurements were used (ranging from 99 to 58% for 100 to 4 ml volumes, respectively). Registered SPECT/CT images were used to generate voxelized descriptions of tumor densities (from CT) and activity concentrations (from SPECT) for each patient as described by Dewaraja et al. [1]. Image sets were acquired at three times (typically) each within 6 days post tracer injection and within 10 days post therapy injection. Data from 57 tumors in 19 patients were available for analysis.
Activity density and absorbed dose rate computation
Three-dimensional absorbed dose rate distributions were computed by Monte Carlo from the activity distributions and anatomical information from the SPECT/CT data sets [15]. Tumor volumes outlined on CT were used to track tumor volume changes (tumor shrinkage) during the tracer and therapy periods. Whole-body and cumulative tumor time-activity curves were fit using data from the tracer and the therapy scans. Tumor time-activity curves were fit to a biexponential function representing the rise and clearance of antibody concentration. The three parameters defining the biexponential curve for each tumor were estimated via maximum likelihood within a mixed model [16]. Tracer and therapy curves were fit in separate mixed models. Rest-of-body time-activity data were fit using a mono-exponential function.
Four-dimensional time-activity and absorbed dose rate model
Space-time descriptions of the antibody and absorbed dose rate distributions were calculated using time-activity curves and deformable registration of the tumor volumes. The deformable registration used center of mass alignment of the tumor volumes and radial deformation, keeping the number of voxels the same, but altering voxel volumes uniformly. Voxels from the first scan were assumed to be unique tumor subunits and were tracked in all subsequent scans by maintaining the number and relative positions of voxels at all times. At later scan times, voxel activities were populated by mapping each scan onto the voxel matrix by radial deformation. Radial deformation consisted of linear mappings of activity levels from the center to the surface. The tumor time-activity profiles for each voxel followed the fitted tumor time-activity curve generated for the tumor as a whole. The summed activity for each tumor at each given time was conserved. Local discontinuities in the voxelized time-activity curves were allowed at times midway between scans. Space-time dependent absorbed dose rate followed the voxel time-activity curves and measured absorbed dose rate distributions. Total tumor absorbed dose was calculated using the tumor self-absorbed dose rate coupled with tumor time-activity curve plus the rest-of-body absorbed dose rate coupled with the rest-of-body time-activity curve.
Equivalent biological effect model
The 4-D dosimetry model is based on tracking tumor subunits through therapy and (potentially) recurrence. A surviving fraction of clonogenic subunits with voxel number v is tracked in time, S(v,t). The surviving fraction averaged over the subunits in volume V is tracked in time, <S(v,t)>V. The minimum of this curve, at time tmin, is defined as the desired therapeutic end point and is related to the equivalent biological effect, E.
| (1) |
The quantity E may be put in the more familiar units of absorbed dose by defining an equivalent uniform dose, EUD, using the linear absorbed dose sensitivity coefficient, α.
| (2) |
The use of α is for unit conversion of E to absorbed dose units for comparison to absorbed dose calculations. S(v,t) is a function of the spatially and time varying BET,
| (3) |
The BET(v,t) is the sum of the relevant quantities affecting the therapeutic outcome, in this case the absorbed dose effect, the cell proliferation effect and the cold effect,
| (4) |
where D(v,t) is the spatial and time varying cumulative absorbed dose; RE(v,t) is the relative effectiveness; λt is the proliferation coefficient (λt = ln(2)/Tp where Tp is the effective doubling time); λp is the cold protein sensitivity coefficient (λp = ln(2)/p1/2, where p1/2 is the half-time of cell inactivation by the antigen-bound antibody molecules in units of milligram protein hour per gram tumor); and P(v,t) is the integral residence time of protein mass per unit tumor mass. The cold effect contribution is represented by the probability of viable cell inactivation proportional to the time the antibody stayed in contact with the cell. P(v,t) was calculated from the decay-corrected activity distribution:
| (5) |
where Pinj is the injected cold protein, A(v,t)/Ainj is the fractional voxel time activity, ρV is the tumor mass, and the exponential term corrects for radioactive decay with decay constant γ.
The magnitude of the RE factor can be estimated by the formula for a continuously decaying source, assuming an irradiation time long compared to the decay rate [17],
| (6) |
where R0 is the initial absorbed dose rate, μ is the repair constant, λ is the total clearance rate (biological plus radiological), and β is the quadratic absorbed dose sensitivity coefficient. For typical parameters of this application (Ro = 0.07 Gy/h, μ = 0.46 h−1, λ = 0.01 h−1, and α/β = 10 Gy), the RE values differed from unity by approximately 1% and were neglected. The effective cell doubling time, Tp ~ 150 d, was set to represent median time to progression for low-grade NHL (approximately 12 months) [3].
Cell clearance model
Fractional survival, S, is proportional to the population of viable tumor subunits in voxel v at time t, N(v,t),
| (7) |
From Eqs. 3 and 7, the incremental fractional survival is
| (8) |
Then,
| (9) |
| (10) |
where N(t) is the number of viable subunits in the tumor at time t, <>V represents a volume average and RE~1. A change in tumor size dZ(t), in units of cell number, includes a term related to the number of inactivated, not yet cleared cells, dU(t)/dt, and a term representing growth proportional to the number of cells N(t)
| (11) |
Assuming a linear clearance rate with rate coefficient λC,
| (12) |
where td is the time delay for cell inactivation by absorbed dose (e.g., awaiting mitotic death). No time delay was assumed (or needed for data fitting) for cell inactivation by cold antibody (e.g., apoptosis). The two integrals give the population of cells killed, but not yet cleared, by radiation and cold protein, respectively. The exponential factors account for the reduction of nonviable cells due to previous clearance. The time dependence of the tumor size results from plugging Eq. 12 into Eq. 11 and integrating each side,
| (13) |
where Z(0) = N(0) is the initial number of viable tumor subunits.
Curve fits
Model parameters were determined based on model fits to changes in tumor volumes for both tracer and therapy data, allowing for tumor response to both absorbed dose and cold effect simultaneously. The delay time from the time of cell inactivation (decrease in S) to reduction in tumor volume was represented by an inactivation delay for absorbed dose delivery, td, and a linear clearance rate for inactivated cells, λc, where λc = ln(2)/Tc. The clearance times were dependent on tumor volume changes between the tracer and first therapy volumes, and were allowed to vary minimally to allow the calculated tumor size slopes for the tracer and therapy regions to match the change in the data points. Fit parameters were λp and α, where λp depended primarily on response to the tracer injection and α depended primarily on response to therapy. Curve fits were performed by adjusting parameters to achieve optimum agreement between the slope of the calculated tumor size curve and the data points for the tracer data and for the therapy data, while visually assessing goodness of fit. Tracer data were fit first to determine λp. The α value was subsequently varied to fit the slope of the therapy data points. Little iteration of parameter value adjustment was required because the tracer data were only lightly dependent on the α parameter. E and EUD for each tumor were calculated from the time minimum of the surviving fraction curve according to Eqs. 1 and 2.
Results
Tumor response model fit
Size data for some tumors changed more rapidly than could be explained by tumor cell loss or gain. This size variation was attributed to noise in the data. Agreement between fitted curves and data points for the tracer period was optimized by renormalizing the tumor size data. All three tracer points were used for renormalizations when possible. For 6 of 57 tumors (11%), the tumor size for the first tracer point was excessively high and was ignored for the purposes of normalization and data fitting. An excessively high first tumor size was interpreted as being due to effects not included in this model (e.g., rapid fluid clearance from first to second time points).
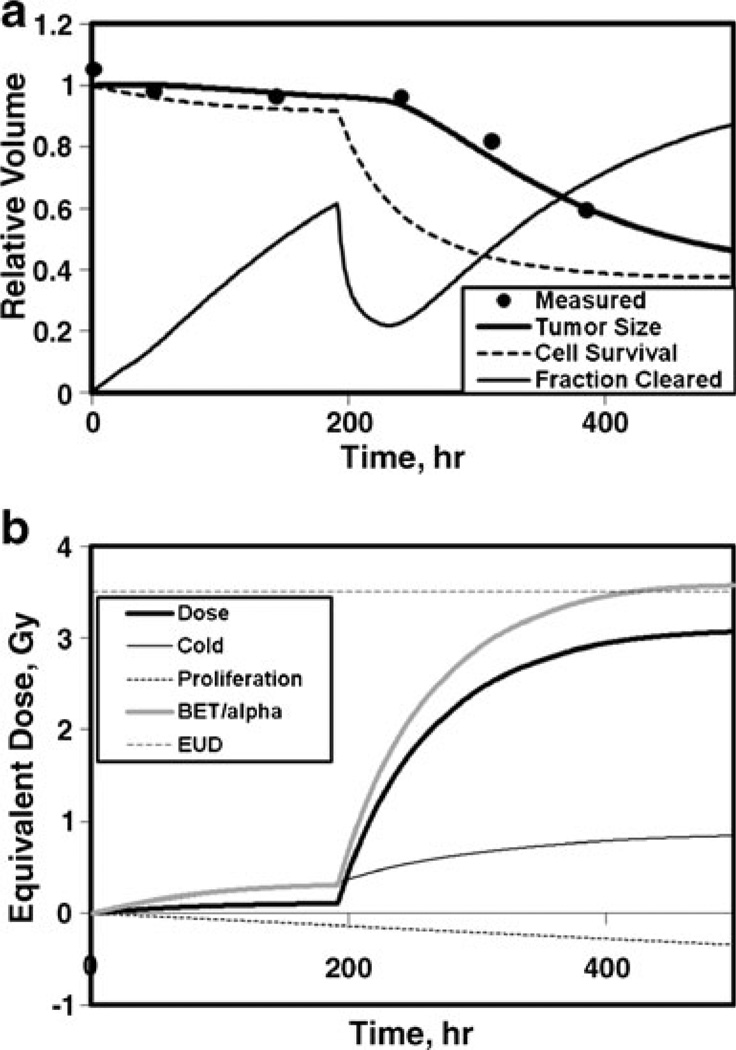
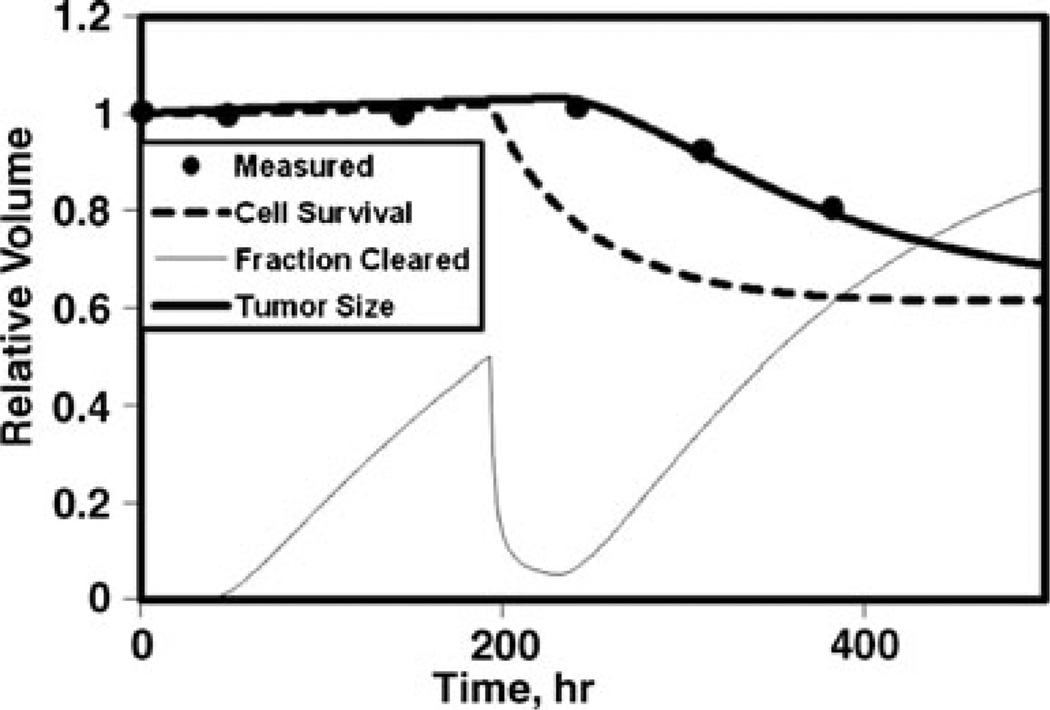
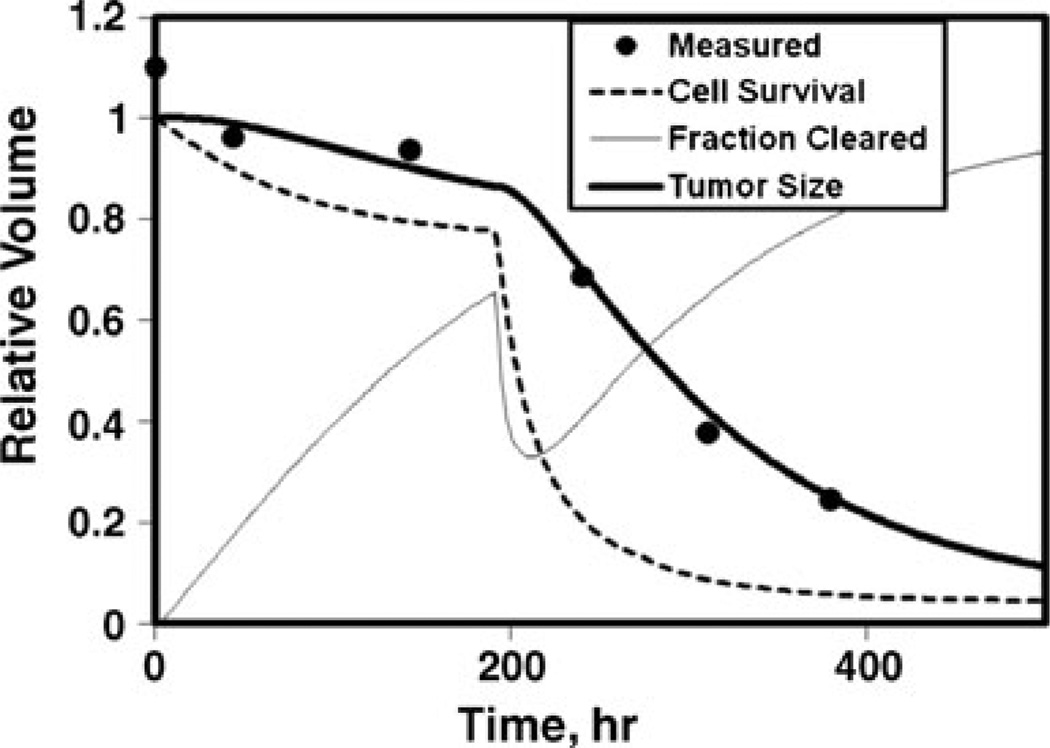
Shown in Fig. 1 are fractional measured tumor volumes compared to the calculated time dependence of the fractional volume, fractional cell survival, and fraction of inactivated cells cleared (Fig. 1a) and contributions to the time-dependent average equivalent dose for absorbed dose, cold effect, proliferation, BET/α, and the EUD at minimum cell surviving fraction (Fig. 1b). In this example, the BET/α is dominated by the cold effect during the tracer interval (<200 h) and dominated by the absorbed dose effect during the therapy interval. Proliferation is represented by a decreasing negative term. EUD is lower than the maximum average BET/α due to exponential averaging in the cell survival formula (i.e., 3-D effect). Other example fits are shown for typical tumors with no cold effect (Fig. 2) and hypersensitive absorbed dose response with rapid cell clearance (Fig. 3).
Fig. 1.
Model fit to fractional tumor size for standard radiation sensitivity with cold effect. a Fractional volumes vs time: measured relative tumor volumes (dots), relative tumor size calculation (dark line), cell survival (dashed line), and fraction cleared (thin line). b Averaged equivalent dose vs time: cumulative absorbed dose (dark line), cold effect (thin line), proliferation (dotted line), BET/α (medium dark line), EUD (horizontal dashed line), p13, α=0.28 Gy−1, λp=0.046 gT/mgP/h
Fig. 2.
Model fit to relative tumor size for no cold effect. Same curve labels as in Fig. 1a; p14, α=0.27 Gy−1, λp=0
Fig. 3.
Model fit to relative tumor size for hyper-radiosensitivity with rapid cell clearance. Same curve labels as in Fig. 1a; p8, α=0.96 Gy−1, λp=0.023 gT/mgP/h
The volume of the first therapy point was most often consistent with an extrapolation of the tumor volumes determined from the tracer data. This can be seen in Figs. 1 and 2, where the survival curve moves down sharply with the delivery of the therapy, while the measured tumor volume does not begin to respond for a few more days. The fit to most tumor volume data required inactivated cell clearance time delays consistent with the start of therapy to after the first therapy point (> 2 days). The default absorbed dose inactivation delay and half-time for clearance were chosen to be 1.5 and 3 days, respectively, based on best fit analysis to the data. Improved fits to the shrinkage data for 5 of 19 cases (26%) required much less absorbed dose inactivation delay, which was set to zero. The clearance half-time was held constant at 3 days for all but one patient (1.5 days for a lung tumor) to minimize the number of parameters being adjusted while determining the optimal fit. The primary goal was to achieve a fitted curve with a representative slope for tumor shrinkage for both the tracer and the therapy data. An example of this is shown in Fig. 3 where the tumor size for the first therapy point is considerably reduced compared to the tracer points requiring an earlier break point for the therapy fitted curve to achieve a representative slope for the falloff of the therapy data points.
Parameter determinations
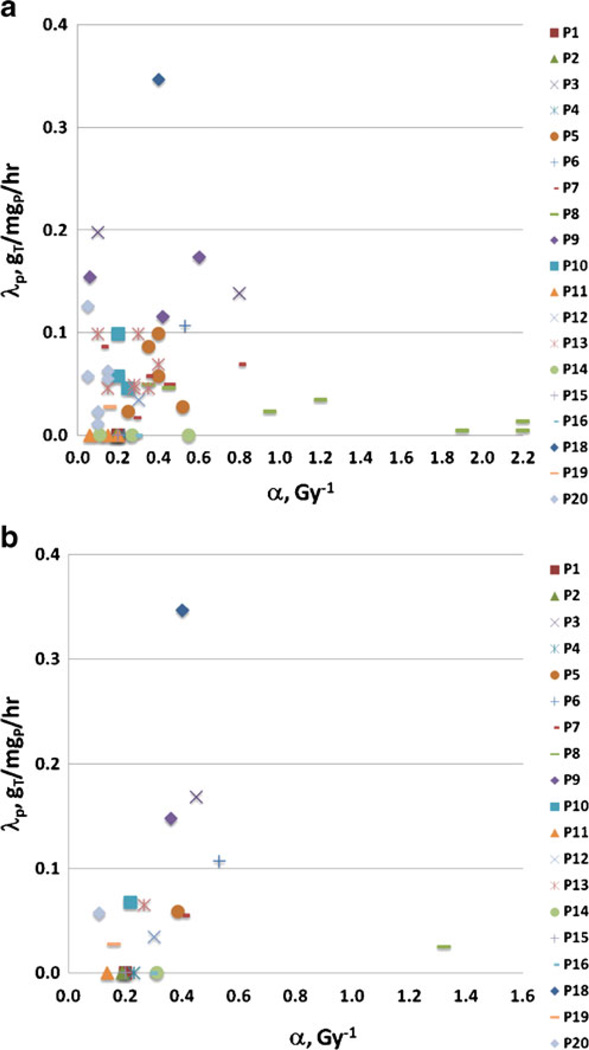
Model fits were attempted for 57 tumors from 19 patients. Data for one tumor (2%) were too erratic to yield a reasonable fit and were not included in the parameter averages, but were used for therapy effect determination. A plot of the parameter (α and λp) relationships for all fit tumors is shown in Fig. 4a. Tumors for each patient (plotted using the same symbol and color) tended to respond similarly. Thus, patient-specific average fit values may provide added insight and are shown in Fig. 4b. The tumor-specific fit results resemble a scatter plot, while the patient averaged results show some trends. Three apparent categories emerged: (1) no cold effect (7 cases with λp=0); (2) standard radiation sensitivity with cold effect (11 cases); and (3) high radiation sensitivity (hyper-radiosensitivity) with cold effect (1 case). These patient response categories may yield insight into which patients will (or will not) receive a large benefit from this therapy. Future work will focus on prospectively predicting a response category for each patient.
Fig. 4.
Cold effect sensitivity (λp) vs radiosensitivity (α) parameters. a Fit parameters for 56 tumors. Correlation of fit parameters can be seen for tumors for the same case (see 7 tumors of P8 compared to 2 tumors for P3 or 3 tumors for P9). b Averaged fit parameters for 19 patients. Three case categories emerge: no cold effect (7 cases, λp=0), cold and radiation effects (11 cases), and radiation hypersensitivity (P8)
A summary of α and λp values averaged over tumors and over patients is given in Table 1. Values differ slightly, showing an influence on the averages of the number of tumors per patient (ranging from one to seven). Parameters for the three response categories were separately averaged for tumor fit results (Table 2) and patient fit results (Table 3). For individual tumor fit results, hyper-radiosensitivity was defined as α = 0.6 Gy−1 or greater.
Table 1.
Tumor-specific and patient-specific average fit parameters
| Fit Set | Number Elements | α, Gy−1 | λp, gT/mgP/ha | ||
|---|---|---|---|---|---|
| Mean | Range | Mean | Range | ||
| Tumor | 56 | 0.41 | 0.05–2.2 | 0.056 | 0–0.35 |
| Patient | 19 | 0.34 | 0.11–1.3 | 0.061 | 0–0.35 |
Gram tumor per milligram protein per hour
Table 2.
Tumor-specific average fit parameters split into response categories
| Fit set | Number elements | α, Gy−1 | λp, gT/mgP/h | ||
|---|---|---|---|---|---|
| Mean | Range | Mean | Range | ||
| No CE | 12 | 0.22 | 0.06–0.55 | – | – |
| Std α, CE | 36 | 0.27 | 0.05–0.53 | 0.075 | 0.005–0.35 |
| Hyper α, CE | 8 | 1.3 | 0.60–2.2 | 0.058 | 0.005–0.173 |
Table 3.
Patient-specific average derived fit parameters split into response categories
| Fit set | Number elements | α, Gy−1 | λp, gT/mgP/h | ||
|---|---|---|---|---|---|
| Mean | Range | Mean | Range | ||
| No CE | 7 | 0.22 | 0.14–0.31 | – | – |
| Std α, CE | 11 | 0.33 | 0.11–0.53 | 0.10 | 0.025–0.35 |
| Hyper α, CE | 1 | 1.3 | 1.3 | 0.025 | 0.025 |
E and EUD
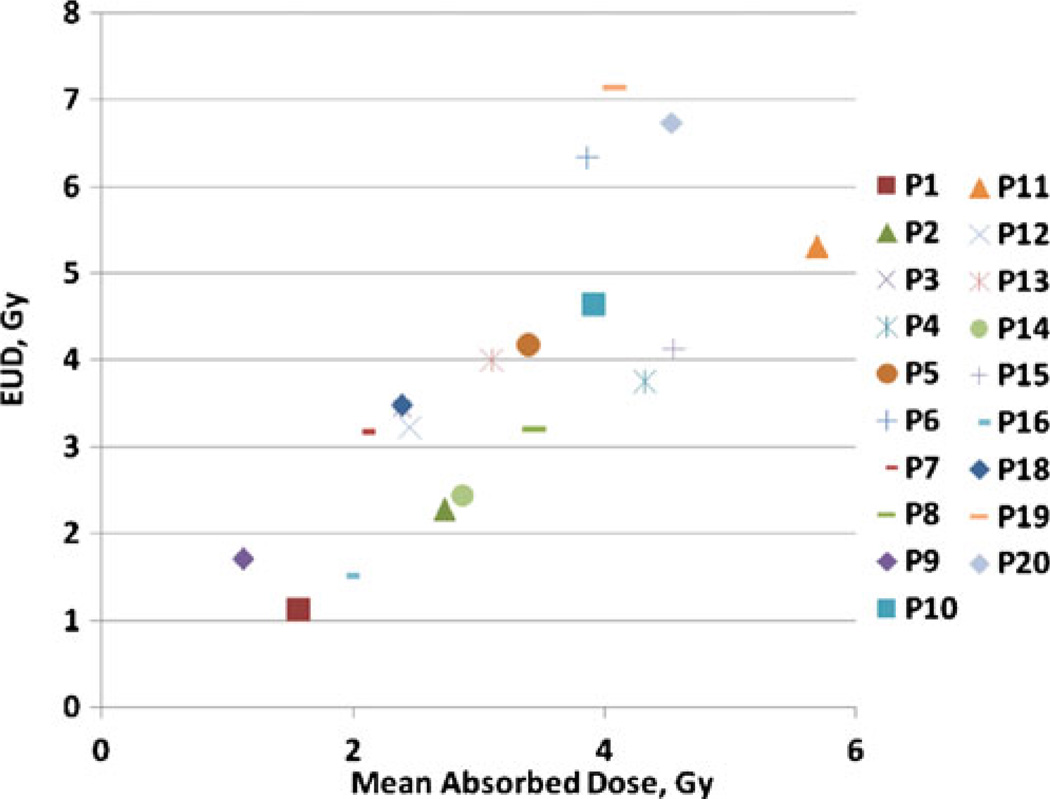
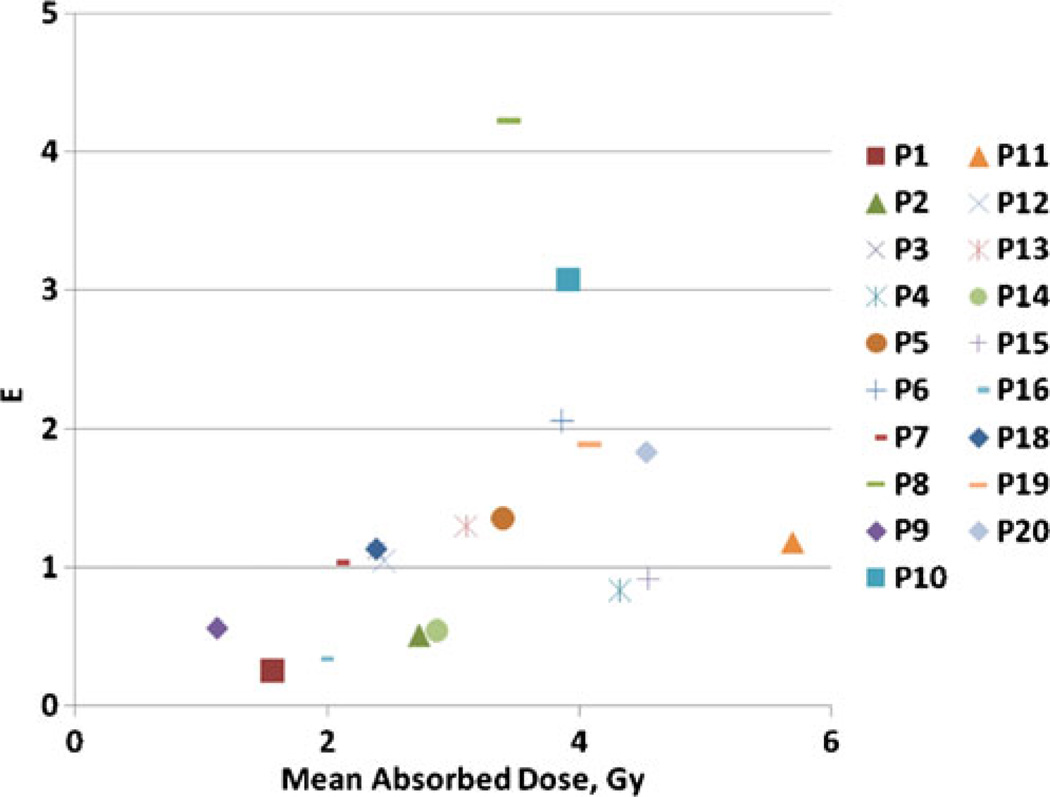
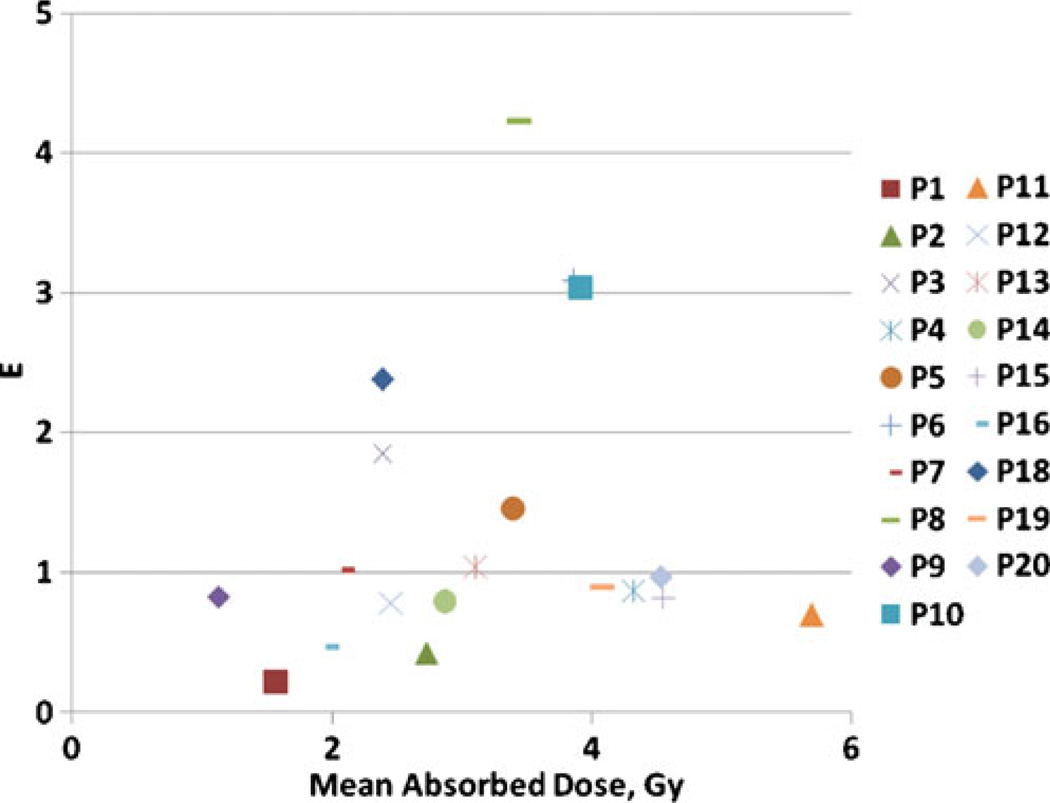
EUDs calculated using patient category average parameters from Table 3 are plotted in Fig. 5 against absorbed dose calculations. Cumulative absorbed doses ranged from 1.1 to 5.7 Gy while EUDs ranged from 1.1 to 7.1 Gy. For all tumors without a cold effect the EUD is smaller than the absorbed dose. Tumors with a therapeutically significant cold effect have EUDs greater than the absorbed dose. Results expressed in E using averaged values from Table 3 compared to absorbed dose calculations are shown in Fig. 6. The hypersensitivity case outlier is apparent because of its large shift of E compared to EUD relative to the other cases. The difference between E and EUD is due to the range of α values, attributed to the disparate patient population receiving this therapy. An alternative strategy is calculating E using patient-specific averages for α and λp (Fig. 7). This analysis would be most appropriate if the observed variation in α represented patient-specific fluctuations in radiation response, rather than random fluctuations in the data. The major difference is due to the relationship between patient categories. The most likely benefit of the current model is to help segregate responses with vs without the cold effect and with standard radiation sensitivity vs increased radiation sensitivity. Data analysis assumptions affecting the correlation of predicted and actual patient therapy outcome will be tested for validity when the current patient data set matures. Fit parameter, EUD and E values used to generate the figures are given in the Supplemental Table.
Fig. 5.
EUD versus total absorbed dose using category average parameters from Table 3. EUD values for patients with relatively little or no cold effect are less than their corresponding absorbed dose values. The same patient code is used as in Fig. 4
Fig. 6.
E vs total absorbed dose using category average parameters from Table 3. The same patient code is used as in Fig. 4
Fig. 7.
E vs total absorbed dose using averaged parameters for each patient. The same patient code is used as in Fig. 4
Discussion
Averaging over tumor fit parameters per patient reduced variability. Patients appear to fall in disparate response categories. Patient response averaging is appropriate when looking for patient response trends and when all tumors within a patient appear to behave similarly. It is expected that patient averaged results would be less affected by noise in the data. The demarcation between standard radiation sensitivity with or without a cold effect is fuzzy. Low-responding tumors were kept in the no cold effect category to avoid excess influence on the α parameter from noise in the tracer data, which can result in fits with α values depressed well below 0.1 Gy−1. Parameter averaging in response categories chosen by patient is likely the most reliable averaging technique.
A wide range of α factors resulted from fits to the data. Fowler [7] estimated reasonable limits for tumor α factors for typical radiotherapy schedules to the range of 0.2 to 0.4 Gy−1. Most case averaged α values determined here fall in or near this interval. The outlier value of 1.3 Gy−1 for one case is well outside of this interval, suggestive of hyper-radiosensitivity. This case was also unique because it was fit best with lower radiation inactivation delay. The wide range of radiation sensitivities required for an adequate fit to data, even using a rich data set and four-dimensional dose model, illustrates the difficulty of depending on absorbed dose estimates only to be able to predict outcome.
Mechanisms of cell inactivation by antibody alone and cell inactivation by radiation absorbed dose may be sufficiently different to warrant different model assumptions. Absorbed dose inactivation was delayed relative to the time of absorbed dose deposition because it allowed a more reasonable fit to the slope of the therapy data. It was not reasonable to assume that the first therapy point was too high due to measurement error for nearly all cases. If both cold and absorbed dose mechanisms are similar (i.e., via apoptosis) this assumption could be questioned. The most similar tumor size response time between the cold effect and radiation absorbed dose responses was observed in the one hypersensitivity case, where the response to absorbed dose was larger and more rapid.
Macklis et al. [18] attributed a higher sensitivity for some malignant lymphoma cell lines to radiation-associated apoptosis for low-dose-rate radiation, while other cell-cycle effects such as G2M block were found to be relatively minor. Hernandez and Knox [19] reviewed the important role of apoptosis in NHL. The apoptotic interpretation of radiosensitivity is in contrast to the typical interpretation of standard radiosensitivity observed for solid tumor cell lines attributed to mitotic effects [7]. Hyper-radiosensitivity at low absorbed doses is moderated by increasing cell repair at higher absorbed doses [20], ultimately converting to full repair with G2 block and mitotic cell death. The observed range of radiosensitivity may be due to a range of cell death mechanisms present in this patient population.
There is a suggestive correlation between the response to absorbed dose and response to cold protein for most tumors (excluding the case with hyper-radiosensitivity). Since the primary mechanism of both antitumor effects in this subset is likely apoptosis [18, 19], this correlation may represent patient-specific tumor sensitivity mechanisms of cell inactivation. It is possible that the difficulty of demonstrating an absorbed dose response relationship is confounded by the wide range of cell sensitivities caused by competing cell inactivation mechanisms. This interpretation leads to the possibility that tumors with little or no cold effect are primarily sensitive to non-apoptotic (e.g., mitotic) death due to radiation damage. There is also a possibility of variable tumor response due to synergistic reactions between the cold and radiation effects. A predisposition to primarily apoptotic or mitotic cell death may be able to be determined through biomarker studies, and may provide the greatest potential for pre-therapy model parameter determination and subsequent therapy outcome prediction.
Use of SPECT-derived tumor activity distributions introduces some uncertainty in the calculations, particularly for small volumes. During the OSEM reconstruction process, accurate total activity and avoidance of reconstruction artifact are emphasized over accuracy in the activity distribution. Smaller tumor volumes are expected to have larger relative uncertainties. In addition, the approximate deformable registration employed (radial deformation) allows discontinuities in the activity density distributions with time, while conserving total tumor time integrated activity. These assumptions are acceptable in the current model due to the smaller significance of 3-D activity distributions at the lower absorbed doses and absorbed dose rates delivered. The estimate of the activity nonuniformity provided by the data and deformable registration is an adequate correction to the equivalent biological effect for 3-D effects. In addition, the methods employed here are significant improvements over the use of dose-volume histograms, where all spatial information is lost. Improvements to the data collection and modeling of the 4-D activity distributions are planned.
The inclusion of cell proliferation in the effective therapy model was important to not bias the antitumor effects, particularly during the tracer study. The magnitude of the proliferation did not have a dominant effect during the approximately 16 days for the current studies, justifying the use of a fixed effective doubling time to reproduce average outcome for the patient population. However, cellular proliferation for NHLs varies and in some subpopulations correlates with time to progression [21]. It may be possible to prospectively use a patient-specific proliferation coefficient based on pretreatment data, such as relative metabolic activity determined from a PET scan [22].
Correlation with outcome may be stronger for subcategories of tumor response if there are significant portions of patients with very different tumor sensitivities. If the dominant tumor characteristic is a variable sensitivity to overall therapy, a simple correlation may remain elusive. Improvements to the model based on additional patient characteristics (e.g., tumor proliferation differences and/or radiosensitivity differences) may be important for a better understanding of correlation with outcome.
This analysis ignored potentially significant effects of the disease process. Tumor volume determination uncertainty and the assumption that all identified volumes represented active tumor cells increase uncertainties in the analysis. If a fixed fraction of all tumor volumes had a lower clonogen cell density, the effect on the relative equivalent therapy would be minimal. Follow-on work will attempt to identify viable cell densities by identifying likely regions of blood pooling and improving the deformable registration using the anatomical and differential time-activity data.
Converting the equivalent biological effect, E, to absorbed dose units (e.g., EUD) may be misleading the correlation to outcome due to the observed range in radiosensitivity. E contains the relative therapeutic information for a disparate patient population. Converting back to absorbed dose units devalues absorbed dose hypersensitivity relative to standard sensitivity. The same may be true of relative cold versus absorbed dose effects. Lower absorbed dose sensitivity will equate to a relatively higher equivalent dose for the therapeutic effect of the cold antibody. The equivalent biological effect may be a better therapeutic score for comparison to patient outcome compared to absorbed dose or EUD. Either relatively minor corrections to absorbed dose are sufficient to correlate calculation prediction to outcome (e.g., use EUD), or a therapy effect calculation should be used (e.g., E). Future plans include testing the utility of using E vs EUD to predict therapy outcome.
Conclusion
Model parameters were successfully derived for an equivalent therapy model including a cold protein effect. Tumor responses have been categorized into three groups based on parameter fits to measured data: no cold effect, standard radiosensitivity with cold effect, and hyper-radiosensitivity with cold effect. Use of the equivalent biological effect rather than EUD for correlation to therapy outcome is preferred for a patient population with variable radiosensitivity. Further investigation may yield methods of segregating patient populations to enhance predictive power of equivalent therapy modeling.
Supplementary Material
Acknowledgments
This work was supported by grant 2R01 EB001994 awarded by the National Institute of Health, US Department of Health and Human Services. The authors thank Ken Koral, Ph.D. for many useful discussions.
Footnotes
Electronic supplementary material The online version of this article (doi:10.1007/s00259-010-1699-3) contains supplementary material, which is available to authorized users.
In the earlier publication, the BED included the cold effect term. While others have used a broader definition of BED to include non-absorbed dose quantities [8, 9], the stronger the terms not associated with absorbed dose, the more awkward it is to assign total therapy effect to an absorbed dose effect quantity.
Contributor Information
Peter L. Roberson, Email: roberpl@umich.edu, Department of Radiation Oncology, University of Michigan, 519 W. William St, Argus I, Ann Arbor, MI 48103-4943, USA.
Hanan Amro, Department of Radiation Oncology, University of Michigan, 519 W. William St, Argus I, Ann Arbor, MI 48103-4943, USA.
Scott J. Wilderman, Department of Radiology, University of Michigan Medical Center, Ann Arbor, MI, USA
Anca M. Avram, Department of Radiology, University of Michigan Medical Center, Ann Arbor, MI, USA
Mark S. Kaminski, Division of Hematology and Oncology, Department of Internal Medicine, University of Michigan Medical Center, Ann Arbor, MI, USA
Matthew J. Schipper, Department of Radiation Oncology, University of Michigan, 519 W. William St, Argus I, Ann Arbor, MI 48103-4943, USA
Yuni K. Dewaraja, Department of Radiology, University of Michigan Medical Center, Ann Arbor, MI, USA
References
- 1.Dewaraja YK, Wilderman SJ, Koral KF, Kaminski MS, Avram AM. Use of integrated SPECT/CT imaging for tumor dosimetry in I-131 radioimmunotherapy: a pilot patient study. Cancer Biother Radiopharm. 2009;24:417–426. doi: 10.1089/cbr.2008.0568. [DOI] [PMC free article] [PubMed] [Google Scholar]
- 2.Kaminski MS, Zasadny KR, Francis IR, Milik AW, Ross CW, Moon SD, et al. Radioimmunotherapy of B-cell lymphoma with [131]anti-B1 [anti-CD20] antibody. N Engl J Med. 1993;329:459–465. doi: 10.1056/NEJM199308123290703. [DOI] [PubMed] [Google Scholar]
- 3.Kaminski MS, Estes J, Zasadny KR, Francis IR, Ross CW, Tuck M, et al. Radioimmunotherapy with iodine (131)I tositumomab for relapsed or refractory B-cell non-Hodgkin lymphoma: updated results and long-term follow-up of the University of Michigan experience. Blood. 2000;96:1259–1266. [PubMed] [Google Scholar]
- 4.Davis TA, Kaminski MS, Leonard JP, Hsu FJ, Wilkinson M, Zelenetz A, et al. The radioisotope contributes significantly to the activity of radioimmunotherapy. Clin Cancer Res. 2004;10:7792–7798. doi: 10.1158/1078-0432.CCR-04-0756. [DOI] [PubMed] [Google Scholar]
- 5.Fowler JF. The linear-quadratic formula and progress in fractionated radiotherapy. Br J Radiol. 1989;62:679–694. doi: 10.1259/0007-1285-62-740-679. [DOI] [PubMed] [Google Scholar]
- 6.Wheldon TE, O’Donoghue JA. The radiobiology of targeted radiotherapy. Int J Radiat Biol. 1990;58:1–21. doi: 10.1080/09553009014551401. [DOI] [PubMed] [Google Scholar]
- 7.Fowler JF. Radiobiological aspects of low dose rates in radioimmunotherapy. Int J Radiat Oncol Biol Phys. 1990;18:1261–1269. doi: 10.1016/0360-3016(90)90467-x. [DOI] [PubMed] [Google Scholar]
- 8.Fowler JF. Correction to Kasibhatla et al. How much radiation is the chemotherapy worth in advanced head and neck cancer? (Int J Radiat Oncol Biol Phys 2007; 68:1491–1495) Int J Radiat Oncol Biol Phys. 2008;71:326–329. doi: 10.1016/j.ijrobp.2008.01.052. [DOI] [PubMed] [Google Scholar]
- 9.Plataniotis GA, Dale RG. Use of the concept of equivalent biologically effective dose (BED) to quantify the contribution of hyperthermia to local tumor control in radiohyperthermia cervical cancer trials, and comparison with radiochemotherapy results. Int J Radiat Oncol Biol Phys. 2009;73:1538–1544. doi: 10.1016/j.ijrobp.2008.11.034. [DOI] [PubMed] [Google Scholar]
- 10.Prideaux AR, Song H, Hobbs RF, He B, Frey EC, Ladenson PW, et al. Three-dimensional radiobiologic dosimetry: application of radiobiologic modeling to patient-specific 3-dimensional imaging-based internal dosimetry. J Nucl Med. 2007;48:1008–1016. doi: 10.2967/jnumed.106.038000. [DOI] [PMC free article] [PubMed] [Google Scholar]
- 11.O’Donoghue JA. Implications of nonuniform tumor doses for radioimmunotherapy. J Nucl Med. 1999;40:1337–1341. [PubMed] [Google Scholar]
- 12.Amro H, Wilderman SJ, Dewaraja YK, Roberson PL. Methodology to incorporate biologically effective dose and equivalent uniform dose in patient-specific 3-dimensional dosimetry for non-Hodgkin lymphoma patients targeted with 131I-tositumomab therapy. J Nucl Med. 2010;51:654–659. doi: 10.2967/jnumed.109.067298. [DOI] [PMC free article] [PubMed] [Google Scholar]
- 13.Dewaraja YK, Schipper MJ, Roberson PL, Wilderman SJ, Amro H, Regan DD, et al. 131I-Tositumomab radioimmunotherapy: initial tumor dose-response results using 3-dimensional dosimetry including radiobiologic modeling. J Nucl Med. 2010;51:1155–1162. doi: 10.2967/jnumed.110.075176. [DOI] [PMC free article] [PubMed] [Google Scholar]
- 14.Kaminski MS, Zasadny KR, Francis IR, Fenner MC, Ross CW, Milik AW, et al. Iodine-131-anti-B1 radioimmunotherapy for B-cell lymphoma. J Clin Oncol. 1996;14:1974–1981. doi: 10.1200/JCO.1996.14.7.1974. [DOI] [PubMed] [Google Scholar]
- 15.Wilderman SJ, Dewaraja YK. Method for fast CT/SPECT-based 3D Monte Carlo absorbed dose computations in internal emitter therapy. IEEE Trans Nucl Sci. 2007;54:146–151. doi: 10.1109/TNS.2006.889164. [DOI] [PMC free article] [PubMed] [Google Scholar]
- 16.Pinheiro JC, Bates DM. Approximations to the log-likelihood function in the nonlinear mixed-effects model. J Comput Graph Stat. 1995;4:12–35. [Google Scholar]
- 17.Dale RG. The application of the linear-quadratic dose-effect equation to fractionated and protracted radiotherapy. Br J Radiol. 1985;58:515–528. doi: 10.1259/0007-1285-58-690-515. [DOI] [PubMed] [Google Scholar]
- 18.Macklis RM, Beresford BA, Humm JL. Radiobiologic studies of low-dose-rate 90Y-lymphoma therapy. Cancer. 1994;73(3 Suppl):966–973. doi: 10.1002/1097-0142(19940201)73:3+<966::aid-cncr2820731332>3.0.co;2-g. [DOI] [PubMed] [Google Scholar]
- 19.Hernandez MC, Knox SJ. Radiobiology of radioimmunotherapy: targeting CD20 B-cell antigen in non-Hodgkin’s lymphoma. Int J Radiat Oncol Biol Phys. 2004;59:1274–1287. doi: 10.1016/j.ijrobp.2004.02.065. [DOI] [PubMed] [Google Scholar]
- 20.Marples B, Lambin P, Skov KA, Joiner MC. Low dose hyper-radiosensitivity and increased radioresistance in mammalian cells. Int J Radiat Biol. 1997;71:721–735. doi: 10.1080/095530097143725. [DOI] [PubMed] [Google Scholar]
- 21.Koster A, Tromp HA, Raemaekers JM, Borm GF, Hebeda K, Mackenzie MA, et al. The prognostic significance of the intra-follicular tumor cell proliferative rate in follicular lymphoma. Haematologica. 2007;92:184–190. doi: 10.3324/haematol.10384. [DOI] [PubMed] [Google Scholar]
- 22.Tang B, Malysz J, Douglas-Nikitin V, Zekman R, Wong RH, Jaiyesimi I, et al. Correlating metabolic activity with cellular proliferation in follicular lymphomas. Mol Imaging Biol. 2009;11:296–302. doi: 10.1007/s11307-009-0226-z. [DOI] [PubMed] [Google Scholar]
Associated Data
This section collects any data citations, data availability statements, or supplementary materials included in this article.


