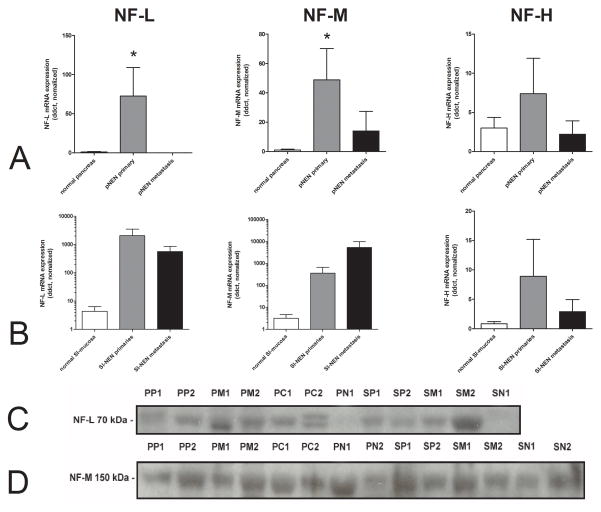
Figure 8.
Expression of NF-L, NF-M and NF-H in pNENs (8A) and in SI-NENs (8B). NF-L and NF-M mRNA expression was significantly elevated in primary pNENs compared to normal pancreas (*p=0.0005 and p=0.0076, respectively). There was, however, no significant difference in expression between SI-NEN primaries or metastasis. At a protein level, NF-L (8C) was increased in pancreatic metastases (PM) in comparison to normal pancreas (PN) but due to the small amount of samples in each group it is not significant. NF-M showed similar expression in all tissue types(8D).
Note: The extremely high neurofilament levels in SI-NENs (log scale) were only detected in the more aggressive neuroendocrine carcinomas, particularly in metastasized neoplasms. PP = pNEN primary, PM= pNEN metastasis, PC= pancreatic adenocarcinoma, PN = normal pancreas; SP = SI-NEN primary, SM = SI-NEN metastasis, SN= normal small intestinal mucosa.

