Abstract
Coupling of heterotrimeric G proteins to activated G protein-coupled receptors results in nucleotide exchange on the Gα subunit, which in turn decreases its affinity for both Gβγ and activated receptors. N-terminal myristoylation of Gα subunits aids in membrane localization of inactive G proteins. Despite the presence of the covalently attached myristoyl group, Gα proteins are highly soluble after GTP binding. This study investigated factors facilitating the solubility of the activated, myristoylated protein. In doing so, we also identified myristoylation-dependent differences in regions of Gα known to play important roles in interactions with receptors, effectors, and nucleotide binding. Amide-hydrogen deuterium exchange and site-directed fluorescence of activated proteins revealed a solvent-protected amino terminus which was enhanced by myristoylation. Furthermore, fluorescence quenching confirmed that the myristoylated amino terminus lies in close proximity to the Switch II region in the activated protein. Myristoylation also stabilized the interaction between the guanine ring and the base of the α5 helix which contacts bound nucleotide. The allosteric effects of myristoylation on protein structure, function, and localization indicate that the myristoylated amino terminus of Gαi functions as a myristoyl switch, with implications for myristoylation in the stabilization of nucleotide binding and in the spatial regulation of G protein signaling.
Heterotrimeric G proteins, consisting of α, β and γ subunits, communicate extracellular stimuli to a variety of downstream effectors through 7-transmembrane G protein-coupled receptors. Receptors catalyze the release of GDP and binding of GTP to Gα subunits, which remain active until GTP hydrolysis and subsequent Gβγ association returns the protein to the inactive, heterotrimeric state. While there are a multitude of G protein-coupled receptor subtypes, there are only a handful of G protein families that are responsible for communicating diverse inputs to a wide variety of effectors. How these many inputs and outputs are coupled through so few G proteins remains an open question in the field, however it likely involves direct conformational as well as allosteric forces, further influenced by spatial and temporal mechanisms regulating G proteins and their binding partners in vivo. Examination of these influences in well-defined systems has allowed us to dissect individual contributions from moieties as small as the 14-carbon myristate, which is covalently bonded to the N-terminal glycine of all Gαi family members, including Gαt, Gαz, and Gαo.
Crystal structures provide no information about the conformation of the myristoylated (myr) N-terminus of activated Gα proteins. This is because no structures of a myrGα protein has been successfully determined, and structures obtained with unmyr proteins typically display disordered amino (N) termini in the absence of Gβγ (1–13), thus these structures shed little light on the conformation of the amino terminus in a myristoylated protein. EPR studies demonstrate the myr N terminus of GαGDP is ordered, even in the absence of Gβγ, in contrast to the more mobile N-terminal residues of unmyr Gα proteins (14). The roles of co- and post-translational modifications of G proteins in membrane-delineated processes has been well documented in the literature (15–22), but less is known about the structural and functional implications of myristoylation in activated Gαi subunits upon release from activated receptors. Biophysical and biochemical studies such as the current study provide unique insights regarding the conformation myrGα proteins adopt in solution, and in particular, the orientation of the myr N terminus in the soluble, activated protein.
Our previous biochemical and biophysical studies suggest that, upon Gα activation, the myrN terminus participates in an intramolecular binding event on the surface of the Gα protein (14, 23, 24). In the current study, we used a combination of hydrogen deuterium (H/D) exchange mass spectrometry (MS) and fluorescence studies. H/D exchange is ideally suited to evaluate solvent accessibility and protein dynamics. It is generally accepted that the extent of H/D exchange in the fast exchange regime reflects solvent accessibility of the backbone while the intermediate exchange regime is a consequence of conformational fluctuations of the protein. The time-dependence of the exchange behavior is indicative of the conformational equilibria associated with dynamics (25–29). Using H/D exchange and fluorescence, we compared myr and unmyrGαi proteins which had been activated with either AlF4 or GTPγS. AlF4 readily binds GαiGDP to form GαiGDP•AlF4, which forms a mimic of the transition state present during GTP hydrolysis, and GTPγS activates Gαi proteins more slowly as a result of basal nucleotide exchange of GDP for GTPγS on the Gα subunit. Guided by the H/D exchange experiments, we examined effects of myr on the environment of specific residues using fluorescence approaches. Fluorescence quenching studies were used to localize the position of the N terminus in the activated, myristoylated protein. Together these biophysical approaches revealed direct and allosteric effects of myristoylation on the environment of residues throughout the activated protein. This solution study provides new insights into roles for myristoylation in the spatial regulation of G protein signaling.
MATERIALS AND METHODS
Materials
Porcine pepsin, GDP, GTPγS were purchased from Sigma-Aldrich (Milwaukee, WI). BODIPY FL-GTPγS thioester, and the cysteine reactive probes monobromobimane and Alexa Fluor 594 C5 maleimide were purchased from Invitrogen (Madison, WI). D2O was purchased from Acros (Geel, Belgium). All other reagents and chemicals were of the highest available purity. ROS membranes containing rhodopsin and Gβ1γ1 were prepared as described in (30).
Protein expression and purification
Gαi and Gαi HI proteins containing an internal hexahistadine tag between residues Met119 and Thr120 of the Gαi1 sequence (Rattus Norvegicus) were expressed and purified as described previously (14, 30, 31). Gαi D328R construction, expression and purification was essentially as described in (32). Briefly, Gαi proteins were expressed in E. coli; for myr Gαi, these were co-expressed with the pbb131 plasmid (courtesy of M. Linder) encoding N-myristoyl transferase and supplemented with myristic acid (30 μM). All proteins were then purified by Ni+2 affinity chromatography, followed by anion exchange HPLC on a 5 mL Source Q anion exchange column (GE Healthcare, Piscataway, NJ). Chromatographic fractions were pooled based on ability to undergo activation-dependent changes in intrinsic Trp211 fluorescence with a minimum of 40% increase in fluorescence intensity upon activation (33) as seen in intrinsic Trp fluorescence assay, or for proteins with mutation of residue 211, by BD-GTPγS binding (34). Both labeled and unlabeled proteins were stored at −80°C in 50 mM Tris, 100 mM NaCl, 2 mM MgCl2, 1 mM DTT, 10 μM GDP and 10% glycerol (pH. 7.5).
Intrinsic Trp fluorescence and AlF4 activation
Intrinsic tryptophan fluorescence was used to measure nucleotide exchange rates in Gαi proteins, based on the ability of Trp211 to act as a reporter of activation-dependent changes in solution (33). Gα (200 nM) subunits are monitored by excitation at 280 nm and emission at 340 nm (ex/em 280/340 nm) before and after activation with 10 μM AlF4 in 50 mM Tris, 100 mM NaCl, 2 mM MgCl2, and 10 μM GDP, pH 7.5. Properly folded and functional Gα proteins exhibit a > 40% increase in relative Trp fluorescence emission upon AlF4 activation. Evaluation of the ability of selected Gαi proteins to undergo activation-dependent changes as a result of basal nucleotide exchange of GDP for BD-GTPγS was measured as described previously (32), with Gαi HI proteins exhibiting a 10-fold higher rate of exchange than wild-type proteins due to removal of solvent-exposed cysteines required for site-specific fluorescent labeling. Briefly, emission intensity of Gαi protein (200 nM) was monitored at ex/em 280/340 nm before and after addition of GTPγS (10 μM). Exchange of GDP for GTPγS results in enhanced Trp emission intensity, similar to the enhancement of Trp emission intensity seen upon activation of Gα proteins with AlF4. Intrinsic nucleotide exchange assays are performed in 50 mM Tris, 100 mM NaCl, 1 mM MgCl2, pH 7.5 at 18 °C. All fluorescence experiments were carried out on a Varian Cary Eclipse (Agilent, Santa Clara, CA). Changes in fluorescence emission were determined from a minimum of three independent experiments, ± SEM. Time-dependent fluorescence changes were fit to an exponential association curve using Prism 4.0 (GraphPad Software). Mean values from at least three independent experiments which differ significantly are indicated by p* < 0.05; p** < 0.01; p*** <0.001.
Peptide identification and hydrogen/deuterium exchange analysis
In order to map peptides to the sequence of the protein, ESI MS/MS was performed essentially as described in (29). The extent of H/D exchange was measured by ESI LC-MS/MS (27) in the positive mode to detect charged ions. We probed the effects of myristoylation on solvent accessibility and protein dynamics by incubating the proteins in D2O, which allows for exchange of backbone amide hydrogens for deuterium. The H/D exchange reaction is then quenched by dropping the pH and temperature, and an acid-stable protease, pepsin, is used to cleave the protein. The increase in weight for each peptide, determined by MS analysis, reveals information regarding the solvent accessibility, conformation, and protein dynamics. The increase in weight of each peptide due to exchange of hydrogen for the 1 amu heavier deuterium over time was monitored, and fitting of the data across all data points revealed the rate and number of hydrogens exchanging. Since side-chain and N-terminal amide hydrogens are back exchanged during chromatography, exchange at these positions is not detected by this method (27). Briefly, porcine pepsin was incubated with AlF4-activated myrGαi protein in a 1:1 wt/wt ratio in quench buffer containing 0.1M KH2PO4, pH 2.3 for a period of 5 minutes. Peptides were separated by reverse-phase HPLC on a microbore 1 × 50 mm Jupiter C18 column (Phenomenex) with a 2–98% acetonitrile gradient with 0.4% formic acid included in both mobile phases at 0.1 mL/min. Peptides were sequenced on a ThermoFinnigan TSQ Quantum (San Jose, CA) triple quadrupole mass spectrometer in the positive ion mode using data-dependent MS/MS collision-induced dissociation. Identities of the peptides were determined by using a combination of ESI MS/MS fragmentation, peptide mass searching of the Gαi sequence using massXpert (35), and predicted fragmentation patterns generated by MS-Product (36). The amino acid sequences of the pepsin digests were determined by comparison of the MS/MS spectra to the predicted fragmentation patterns generated by the program MS-Product (36), yielding approximately > 85 % sequence coverage (Fig. 1A) by peptides which were sufficiently well-resolved to be used in the subsequent H/D exchange experiments.
Fig. 1.
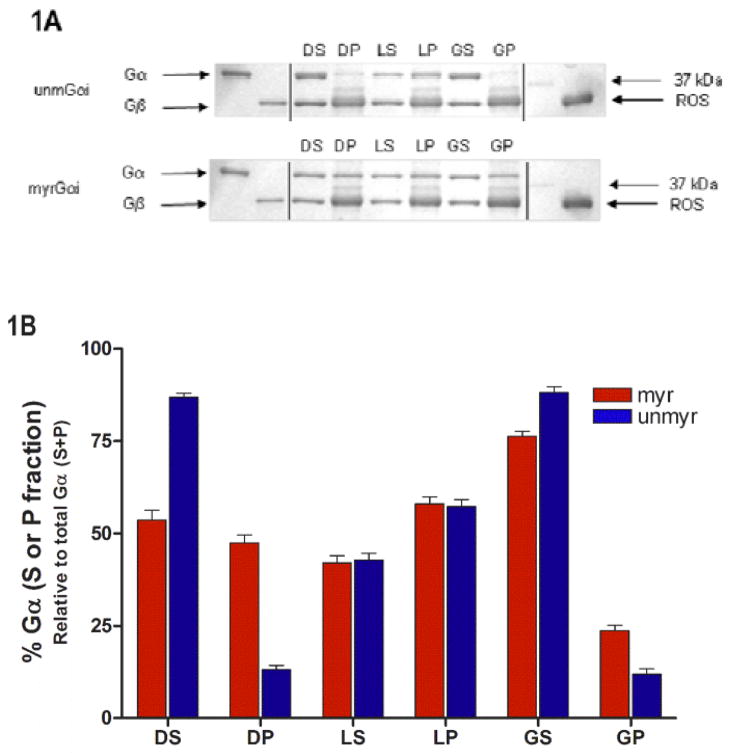
Myristoylation alters protein localization and environment of residues in receptor-binding regions. (A) SDS-PAGE gels of indicated Gα proteins were reconstituted with Gβγ prior to binding to ROS in the dark, in the light, and after light activation followed by addition of GTPγS, as described in methods. Supernatant from dark sample, DS; pellet fraction in dark, DP; light supernatant, LS; light pellet, LP; supernatant, light + GTPγS, GS; pellet, light + GTPγS, GP. (B) Quantitation of A from densitometry of gels. Each bar (red, myr; blue, unmyr) is the average of three independent experiments; results are mean ± SEM.
The exchange of backbone amide hydrogens for deuterium in AlF4-activated Gαi proteins was initiated by addition of 5 μL of Gαi protein (15 μg) to 45 μL D2O, and samples were incubated at 21 °C for time spans ranging from 15 seconds to 30 minutes. Following this incubation, samples were quenched with 50 μL quench buffer and immediately transferred to an ice bath, and then allowed to digest with pepsin for an additional 5 minutes. The digested peptides were separated over 20 minutes by a 2–98% acetonitrile gradient containing 0.4% formic acid in all running buffers at a flow rate of 0.1 mL/min. In the LC/MS separation of deuterated peptides, the injection apparatus and all chromatographic buffers were maintained at 0 °C by submersion in ice/water slurry in order to minimize back exchange of deuterium during HPLC. To determine the extent of deuterium incorporation that occurred after quenching, a zero percent control (m0%) was prepared by addition of Gαi to quench buffer at 0 °C, followed by addition of 45 μL D20, and digestion with pepsin as above. Furthermore, the amount of deuterium back-exchanged during chromatography was determined with a fully deuterated protein (m100%), which was obtained by incubation of Gαi (15 μg) with 45 μL D20 at 45 °C for 8 hr, followed by addition of quench buffer and analyzed as above. Data processing was performed using Finnigan Xcaliber software (version 1.2). Peptide ions were located by mass searching, which resulted in a chromatographic ion profile for each ion which was averaged to obtain a composite spectrum for each ion. Magtran 1.0 beta 9 software (37) identified the centroid (mt) of the given composite isotope envelope. The deuterium content of the peptides as a result of H/D exchange was corrected for gain (m0%) and loss (m100%) of deuterium during analysis according to equation (1),
| (1) |
where m0%, mt and m100% are the average molecular masses for the same peptide in the undeuterated control, partially deuterated sample at time t, and fully deuterated control samples, respectively; where N equals the total number of exchangeable peptide amide protons, less one for the N terminus and any proline residues present. The amount of deuterium incorporated at each of 9 different time points in each peptide was averaged in two independent experiments, with all data for one kinetic experiment collected on the same day, and plotted as a function of time. The time-dependent increase in mass as a result of the H/D exchange was fit to single or double exponential equations as appropriate to the sum of first-order rate terms according to equation (2),
| (2) |
where N is the number of amide hydrogens that exchange for deuterium at a given rate constant, ki, during time t, the time point for which exchange was measured. Due to practical considerations in sample handling, the earliest time point measured was 15 sec, therefore hydrogens which exchange before this time point have an estimated ki of > 4 min−1. Exchange is measured in two independent experiments for myr and unmyr proteins, at time points of 15, 30, 45, and 60 seconds; and 2, 4, 10, 15 and 30 minutes. All time points were measured on the same day for a particular experiment. Average deuterium incorporation from two independent experiments was fitted to an appropriate exponential equation using KaleidaGraph (Synergy Software, Reading, PA).
Protein labeling
Gαi HI proteins (31) were labeled with the indicated thiol-reactive probes. With a 5:1 probe:protein molar ratio and Gαi HI proteins at a concentration of approximately 1 mg/mL in buffer free of reducing agent, proteins were labeled in 50 mM Tris, 130 mM NaCl, 2 mM MgCl2 and 100 μM GDP, pH 7.5, followed by quenching with β-mercaptoethanol and removal of unbound probe with HPLC using a SW2000 size exclusion column (Sigma-Aldrich, St. Louis, MO). Efficiency of labeling was between 25–40%, depending on the nature of the probe used, location of the residue, and time of labeling (generally 1–4 hours). Chromatography was carried out in the same buffer supplemented with 10 μM GDP and 1 mM DTT. Monodispersity and molecular weight of the monomeric, labeled proteins used in this study after purification by gel filtration HPLC was confirmed through comparison of peak retention times and peak shape to results from column calibration performed with a broad range of molecular weight standards run on the same day as the purified samples (BioRad, Hercules, CA). The monomeric, labeled, purified proteins were pooled based on their ability to undergo activation-dependent changes as measured by intrinsic Trp211 activation (described above). Proteins with mutation of Trp211 were assayed by BD-GTPγS binding (described below) to ensure functional integrity of the labeled proteins.
Extrinsic fluorescence assays
For bimane quenching experiments, emission of myr and unmyr Gαi HI proteins (in complex with Gβγ, 150 nM each) specifically labeled at the third residue with monobromobimane (as described under protein labeling) was scanned between 400–600 nm, with excitation at 375 nm, before and after activation with 10 μM AlF4 in 50 mM Tris, 100 nM NaCl, 2 mM MgCl2, 10 μM GDP and 1 mM DTT, pH 7.5. The time-dependence of bimane quenching due to basal nucleotide exchange was based on the intrinsic basal nucleotide assay described under intrinsic Trp fluorescence. Nucleotide exchange was initiated by addition of 10 μM GTPγS to bimane-labeled GDP-bound Gα HI proteins (200 nM) and fluorescence monitored at bimane-specific wavelengths (ex/em 375/475 nm). For fluorescence studies of A1-labeled proteins, the emission maxima of 200 nM labeled Gαi subunit was determined by scanning emission between 590–750 nm, with excitation at 580 nm. For BD-GTPγS binding (34), the emission of BD-GTPγS (1 μM) was monitored at BD-specific wavelengths of ex/em 485/515 nm for 1 hr after addition of Gαi (200 nM), and for experiments with D328R protein, BD-GTPγS binding was measured +/− 10 μM AlF4, in buffer consisting of 50 mM Tris, 100 mM NaCl, 2 mM MgCl2, and 1 mM DTT, pH 7.5 at 18 °C. All fluorescence data were analyzed as described under intrinsic Trp fluorescence.
Rhodopsin binding assay
The ability of labeled Gαi subunits to bind rhodopsin in urea-washed ROS membranes was determined as described (32). Gαi (5 μM) with Gβγ (10 μM) and rhodopsin (50 μM) in a buffer containing 50 mM Tris (pH 8.0), 100 mM NaCl and 2 mM MgCl2 were incubated in the dark, after light activation, and after light activation with the addition of GTPγS (100 μM) for 30 minutes at 4 °C. Membranes were separated by centrifugation at 20,000 × g for 1 hour, and the supernatants removed from pellets. For the dark fraction, the reaction was protected from light during centrifugation, and supernatant was removed in dim red light. The isolated fractions were boiled, visualized on Coomassie-stained SDS-PAGE, and quantified by densitometry using BioRad Multimager by comparison of the amount of 37 kDa Gα in either pellet or supernatant to the total amount of Gα subunits in both fractions, expressed as a percent of total. Data are the average of at least 3 independent experiments.
Tryptic Digest
Bimane-labeled myrGαiHI W211F and unlabeled wild-type Gαi protein (15 μM) in the GDP-bound and GDP-AlF4 activated state were incubated with tosyl-phenylalanyl chloromethyl ketone-trypsin at 4 °C in a 1:50 molar ratio trypsin:Gα protein. Samples were treated with tosyl-L-lysine chloromethyl ketone at a final concentration of 40 μg/mL for 5 minutes at 4 °C, prior to separation on SDS-PAGE and Coomassie staining (Suppl. Fig. S2B) (33).
RESULTS
Activation results in a highly soluble myrGα protein
We examined the effect of myr on membrane binding, before and after activation of the G protein by GTPγS. To do this, we measured the percent recovery of Gα protein in the pellet fraction versus that recovered in the soluble fraction in a reconstituted system consisting of rhodopsin in ROS membranes and Gα in complex with Gβγ. Like Gαt, Gαi subunits bind Gβγ, and the reconstituted heterotrimer interacts with rhodopsin in an activation-dependent manner (24, 30, 38). ROS membranes were prepared under dim red light, allowing examination of the membrane binding activity of G proteins in the dark, after receptor activation by light, and after light plus GTPγS addition. Densitometry of Coomassie stained SDS-PAGE gels showed the relative amounts of Gα recovered in the pellet and supernatant fractions after incubation under the indicated conditions (Fig. 1A–B), as described in methods. Initially, myrGα is recovered to a greater extent in the membrane fraction than the unmyr (Fig. 1A–B, lane DP, red vs. blue) under dark conditions. Upon receptor activation, Gα proteins are equally well localized to the membrane (Fig. 1A–B, LP lanes), and subsequent GTPγS binding releases activated subunits from membrane-bound receptors, facilitating recovery of both myr and unmyrGα in the supernatant (Fig. 1A–B, GS lanes). Because myristoylation augments membrane association in the inactive, but not active state, we next sought to determine the factors facilitating solubility of the activated protein.
Myristoylation alters the environment of the N-terminus and other regions throughout the activated protein
In order to investigate the activation-dependent solubility of myrGα, we performed H/D exchange analysis. In particular we were interested in the ability of amide hydrogens in the myr N terminus to exchange for deuterium, as a means to investigate the solvent exposure and conformational flexibility of this region. Intact, AlF4-activated Gαi (myr and unmyr) were exposed to D2O for varying time points, followed by quenching and enzymatic cleavage as described in methods. Subsequent MS analysis of the products allowed direct measurement of the number of backbone amide hydrogens that exchange for deuterium during the assay (27). After mapping the individual peptides to the primary sequence (Fig. S1) using high-resolution tandem LC/MS/MS, we measured the time-dependence of H/D exchange in peptides which were well-resolved in both myr- and unmyrGαi proteins. The nine time points tested for each protein ranged from 15 seconds to 30 minutes. The average H/D exchange at each time point was then fit to an appropriate exponential equation. The y-intercept of the fitted line provides an estimate of the number of backbone amide hydrogens that exchange in the first 15 seconds. The percentage of hydrogens in each peptide that exchange in this fast-exchange regime is shown in Figure 2, which reflects the solvent (D2O) accessibility of the specific region of the protein (25). The kinetic plots also reveal the number and rates of backbone hydrogens that exchange over the entire time course of the experiment. These data, along with statistics for evaluating the quality of the data fitting, are shown in Table S1 (Supporting Information). From this analysis, we observed qualitative similarities between myr and unmyr proteins, consistent with their ability to bind Gβγ, nucleotides, receptors, and hydrolyze GTP, with subtle myr-dependent differences in regions throughout the Gα protein.
Fig. 2.
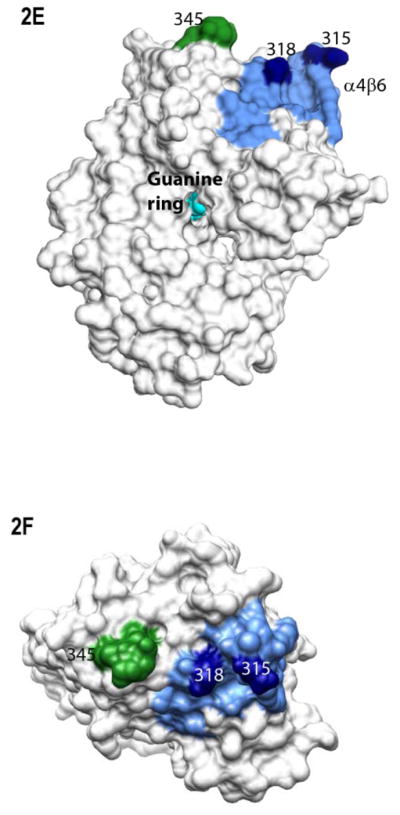
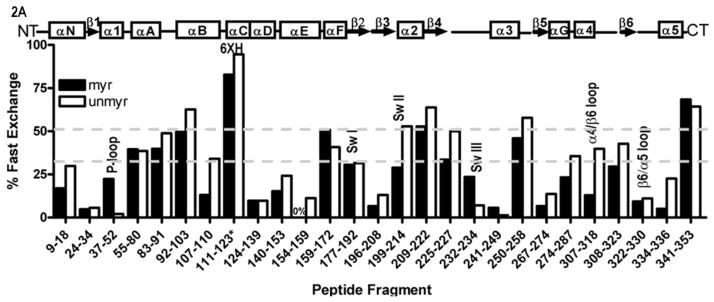
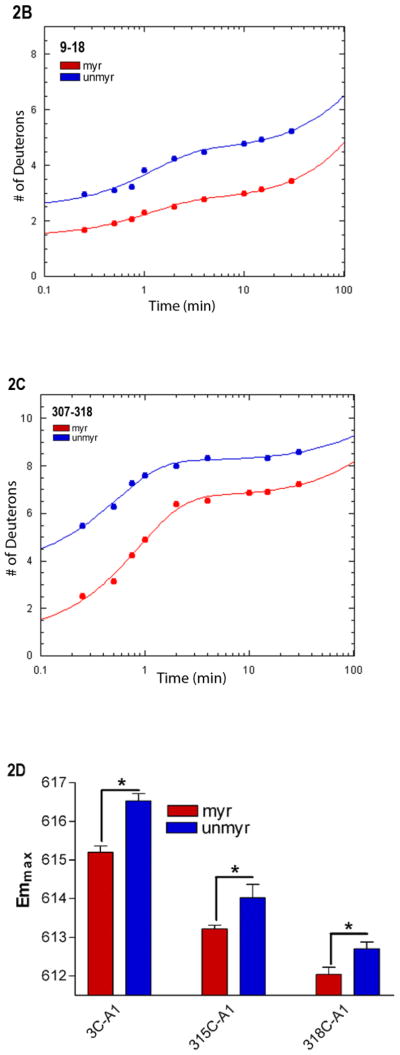
Myristoylation allosterically modifies environment of multiple regions within the activated Gα protein. Shown is the percentage of deuterium incorporation in each peptide as a percent of the total number of exchangeable backbone amide hydrogen in each peptide (y-axis), which occurs as a result of fast H/D exchange in indicated peptides of myrGαi (filled bars) and unmyrGαi (open bars), shown on the x-axis. The fits for all peptides can be found in Table S1, and peptide cleavage map of protein in Fig. S1. Regions of secondary structure are indicated along the top. *111–123 denotes the peptide which encompasses the hexahistadine tag (unnumbered) located between residues 119 and 120. Grey dotted lines indicate peptides with an overall high (≥ 50%, upper dotted grey line) or low (≤ 30%, lower dotted grey line) solvent accessibility regardless of myristoylation. (B–C) H/D Exchange kinetic rate profiles for peptides encompassing residues 9–18 (B) and 307–318 (C). Shown are the time-dependence of deuterium incorporation into peptides originating from myrGαiGDP•AlF4 (red spheres) and unmyrGαiGDP•AlF4 (blue spheres) as a function of incubation time in D2O. Each time point is the average of two independent experiments; results were fit to a single or double exponential equation according to Eq. (2), with fitted parameters shown in Table S1. (D) Emmax for the indicated A1-labeled Gαi HI proteins after AlF4 activation was determined as described in methods from excitation at 580 nm and scanning peak emission between 590–750 nm in a minimum of 3 independent experiments; results are mean ± SEM. (E–F) Surface of unmyrGαiGDP•AlF4, from 1GFI (2), with the last resolved residue in C terminus in dark green, shown to indicate receptor-binding face of protein. Light blue indicates α4/β6 loop region, with darker blue indicating position of indicated α4/β6 residues which were analyzed in 2D. (E) Side view; (F) view of protein which faces receptor. Surface of 1GFI (2) rendered with Chimera (66).
A number of regions display relatively similar H/D fast exchange, regardless of myristoylation
In comparing the percentage of fast-exchanging hydrogens in the activated myr and unmyr proteins, we observed a qualitatively similar trend across the primary sequence regardless of myristoylation (Fig. 2A) in some regions of the Gα proteins. For example, in both myr and unmyr proteins, regions which displayed the highest percentage of fast-exchange included the peptide which encompassed the hexahistadine tag (denoted *), followed by the extreme C terminus (residues 341–353), the αA/αB loop (residues 92–103), and a peptide spanning the C-terminal end of the α2 helix and the α2/β4 loop (residues 209–222), with > 50% of amide hydrogens exchanging before the first time point in both myr and unmyr proteins (Fig. 1B, upper grey dotted line). Regions with a relatively low percentage of fast-exchanging protons regardless of myristoylation included residues 9–18 and 24–34 in the N-terminus, residues 37–52 containing the phosphate binding loop (P-loop), and portions of the αC, αD and αE helices, residues 124–139, 140–153, and 154–159, respectively, with < 30% of amide hydrogens undergoing fast exchange (Fig. 1B, lower grey dotted line). The β3/α2 region (residues 196–208), α3 helix (residues 241–249) and residues preceding it (232–234), β5 strand (residues 267–274), β6/α5 loop (residues 322–330) and several residues in the C-terminal α5 helix (334–336) also exhibit a low percentage of amide hydrogens undergoing fast exchange regardless of myr. These results reveal information about the accessibility of the backbone amide hydrogens to D2O, relevant to the conformation the protein adopts in solution. These results also revealed subtle effects of myristoylation on various regions throughout the Gα protein.
Regions throughout the Gα protein display myr-dependent alterations in H/D fast exchange
While general trends in fast exchange across the protein were qualitatively similar, a number of regions displayed myr-dependent differences in the percentage of fast-exchanging hydrogens. The myrN-terminal peptide displayed > 10% reduction in fast exchange due to myristoylation (Fig. 2A). Surprisingly, several regions far removed in sequence from the N-terminal myristoylation site also displayed > 10% reduction in fast exchange due to myristoylation. These regions included residues in the αB region (107–110), αE (residues 154–159) Switch II (SwII, residues 199–214), residues in the β4 strand (225–227), α3 helix (residues 250–258), residues within the αG helix (274–287), the α4/β6 loop (residues 307–318) and nearby residues 308–323, as well several residues in the α5 helix (334–336). While myristoylation generally conferred reductions in the percentage of fast-exchanging hydrogens, there were several regions that showed myr-dependent enhancements (> 10%) in fast exchange, including the peptide that encompasses the P-loop (residues 37–52), as well as a small segment of Switch III (SwIII, residues 232–234). Since the myr proteins are highly membrane localized, we next sought to determine how the environment of receptor-binding regions in the activated state might support a cytosolic localization for the myr protein.
Myr-dependent differences the N terminus and α4/β6 loop
Several of the regions which displayed myr-dependent differences in H/D analysis are located in regions known to be involved in receptor binding, and due to the critical role of these regions, we selected them for further study. We noted myr-dependent differences in the percentage of fast-exchanging hydrogens of the N terminus and the α4/β6 loop (24, 39, 40), as indicated by differences in the y-intercepts of the fitted lines in Fig. 2B–C. To investigate this further, we next used site-directed fluorescent labeling to examine the environment of specific residues within each of these regions, in order to examine myr-dependent differences at the residue level. We introduced cysteines at sites of interest in the background of a cysteine-depleted parent Gαi HI protein (31). We labeled residues in the N terminus and the α4/β6 loop of three separate Gαi HI Cys mutants with a thiol-reactive Alexa595 (A1) probe. The A1 probe has been shown to exhibit a lower emmax (blue shift) of about 10 nm in hydrophobic environments as compared to its emmax in more polar environments (24). Individually labeled myr and unmyrGαi HI 3C-A1, 315C-A1 and 318C-A1 were activated with AlF4 as described in methods, and the emmax of the myr and unmyr proteins was compared (Fig. 2D). Because the first well-resolved peptide in common to both myr and unmyr proteins started with residue 9 in the H/D exchange analysis, the ability to specifically label residue 3 provided a measure of the environment nearer the extreme N terminus. We observed a statistically significant myr-dependent blue shift in the emmax of all three proteins, consistent with myr-dependent decreases in polarity surrounding these labeled residues in the activated proteins. The α4/β6 loop (Fig. 2E–F, light blue) and residues 315 and 318 (Fig. 2E–F, dark blue) in this region are visible in crystal structures of activated, unmyrGαi (2), near the last resolved residues in the C terminus, shown in green in Fig. 2E–F for reference. Since similar fluorescence studies carried out on specifically labeled residues in the C-terminus failed to detect any myr-dependent decreases in emmax (not shown), this indicates that the myr-dependent blue shifts we detected in fluorescently labeled residues in the α4/β6 loop region are not likely due to interactions with nearby C-terminal residues, which exhibit a high level of fast exchange regardless of myristoylation (Fig. 2A). In addition to receptor-binding regions, regions known to be involved in binding nucleotide also exhibited myr-dependent differences in fast exchange.
Myr-dependent differences in regions which interact with the guanine ring
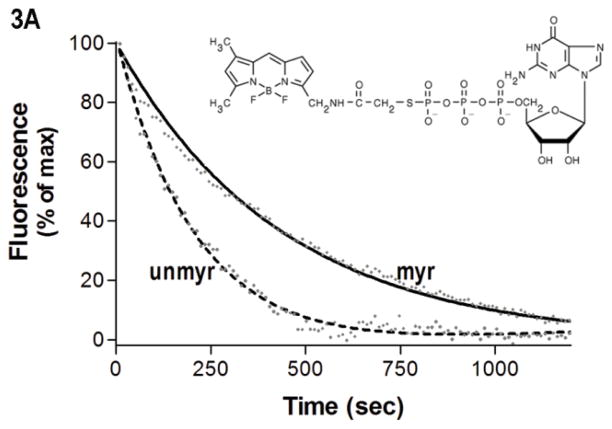
Interestingly, H/D exchange revealed unexpected myr-dependent differences in fast exchange in regions with well-established roles in nucleotide binding, such as the base of the α5 helix, which interacts with the guanine ring. To examine the effect of myr on nucleotide binding, we used an extrinsically labeled GTP analog, Bodipy (BD)-GTPγS (Fig. 3A, inset) as a reporter of environmental differences surrounding bound nucleotide. While it is known that BD-labeled nucleotides bind Gα subunits with a lower affinity than unlabeled, we can compare the relative ability of myr and unmyr proteins to bind to this GTP analog. Since BD-GTPγS binds Gα subunits with a lower affinity than unlabeled GTPγS (32, 41), we competed away bound BD-GTPγS with a 10-fold excess of unlabeled GTPγS. The time-dependence of the decrease in BD-GTPγS emission (Fig. 3A) upon addition of unlabeled GTPγS was significantly slower in the myr protein as compared to unmyr protein (Fig. 3A, solid line vs. dotted line, p*, 0.002 ± 0.0009 vs. 0.004 ± 0.0001 sec−1, respectively), revealing myr-dependent enhancement in BD-GTPγS binding.
Fig. 3.

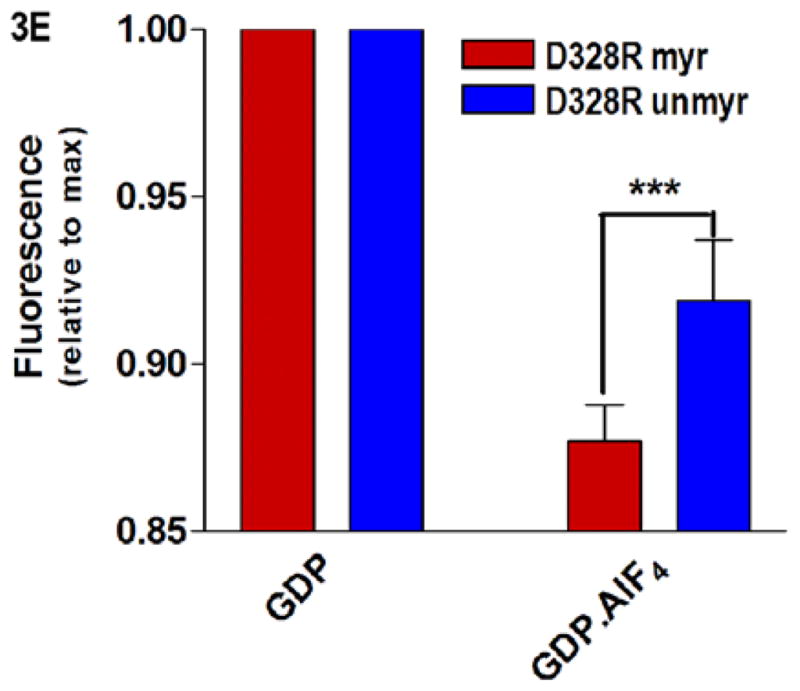
Protein-nucleotide binding interactions influenced by myristoylation. (A) GαiGDP proteins were preloaded with 1 μM BD-GTPγS for 1 hr, and dissociation initiated at T=0 by addition of 10 μM unlabeled GTPγS (emission monitored at ex/em 485/515 nm) as described in methods. Data points are the average of 3 independent experiments, which were fit to a single exponential dissociation curve using GraphPad Prism 4.0. Inset: structure of BD-GTPγS used in these studies (Invitrogen, Madison, WI). (B) Regions of Gαi that surround the guanine ring (1GFI (2), rendered with Chimera (66)) are shown as blue ribbons. (C–D) Time-dependence of H/D exchange (as described in Fig. 2) for peptides (C) 267–274 flanking the guanine ring and (D) 322–330 located at the base of the α5 helix. (E) Myr-dependent stabilization of interactions between guanine ring and residue 328 located at the base of the C-terminal α5 helix. Left two bars: maximal level of BD-GTPγS fluorescence (ex/em 485/515 nm) for each protein exhibited upon full BD-GTPγS binding measured after 1 hr (set to 1.0). Right two bars: pre-activation of GDP-bound proteins with 10 μM AlF4 for 5 minutes prior to addition of BD-GTPγS reduces exchange of GDP•AlF4 for BD-GTPγS, as compared to their respective maximums. Data are the average of 3 independent experiments; results are mean ± SEM.
Activation with AlF4 offsets destabilizing D328R mutation in the myristoylated Gα protein
To determine if the myr-dependent enhancement of BD-GTPγS binding was due to allosteric effects of myr on regions involved in binding the guanine ring, we examined H/D exchange in regions surrounding the guanine ring. We noted that, of the two peptides flanking the guanine ring (Fig. 3B), only the 322–330 peptide exhibited a myr-dependent reduction in the time-dependence of the H/D exchange (Figs. 3C and 3D, respectively). This peptide encompasses residue 328; mutation of this residue (and others around it) is known to markedly elevate nucleotide exchange (32, 41). However, it is known that, in wild type Gαi proteins, addition of AlF4 severely reduces exchange of GDP for GTPγS, using either unlabeled GTPγS (2) or BD-GTPγS (32). This indicates AlF4 binding can stabilize bound GDP, regardless of the nucleotide analog used in the exchange assay. However, unlike wild-type Gαi, even addition of AlF4 does little to prevent exchange of GDP for BD-GTPγS in the unmyrD328R Gαi protein (32). Since myr reduced the time-dependence of H/D exchange in the region encompassing residue 328, we reasoned that myr may stabilize the D328R protein against exchange. Because the maximal level of fluorescence after GDP/GTPγS exchange differs for myr and unmyr proteins (see below), we set the maximal fluorescence for each protein to 1.0. We then measured the effect of addition of AlF4 addition on nucleotide exchange in the myrD328R protein, as compared to unmyr, as described in methods. We found that myristoylation significantly enhanced the AlF4-mediated stabilization of bound GDP, reducing overall BD-GTPγS binding (Fig. 3E, right 2 bars). This indicates that myr stabilizes interactions between the base of the α5 helix and the guanine ring which is specifically perturbed by the D328R mutation located within this region (Fig. 3B). We next examined interactions between the nucleotide and the phosphate binding corridor, which accommodates binding to GDP, GTP, and GTP analogs with substitutions in and around the β- and γ-phosphates.
Myristoylation enhances the polarity of the phosphate binding corridor
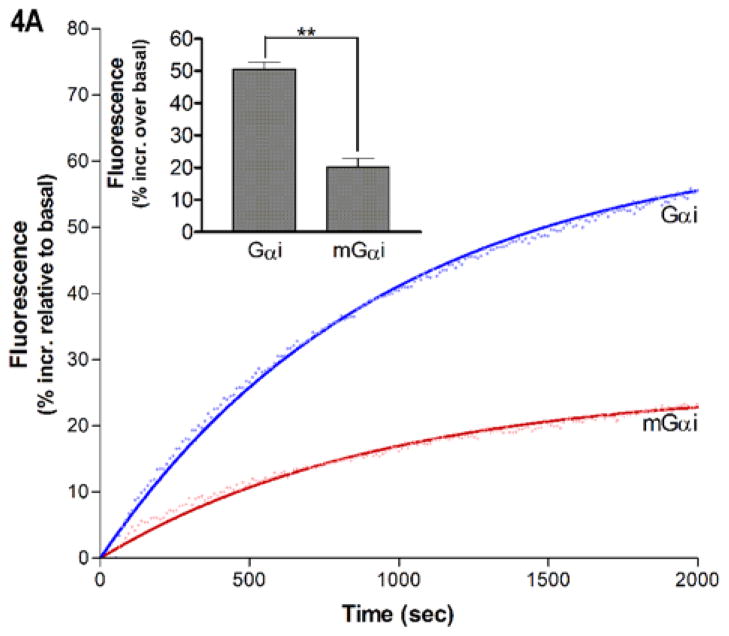
On the opposite side of the nucleotide binding pocket, residues important for hydrolysis of the γ-phosphate of GTP line the phosphate binding corridor. To examine effects of myr on the phosphate binding corridor, we took advantage of another unique characteristic of BD-GTPγS: it has the fluorescent moiety linked to the terminal phosphate (Fig. 3A, inset). This provides a convenient sensor of interactions between residues in the phosphate binding corridor and bound nucleotide in the vicinity of the third phosphate. While myr and unmyrGαi proteins exhibited similar rates of BD-GTPγS binding (0.001 ± 0.0001 sec−1), myristoylation resulted in a consistently lower overall maximal emission intensity of the probe after full exchange had occurred (Fig. 4A), an effect seen in both wild-type and mutant Gαi proteins. The lower maximal fluorescence for myrGαi upon binding to BD-GTPγS indicates there is a more polar environment surrounding the labeled nucleotide near the region of the third phosphate due to myristoylation.
Fig. 4.
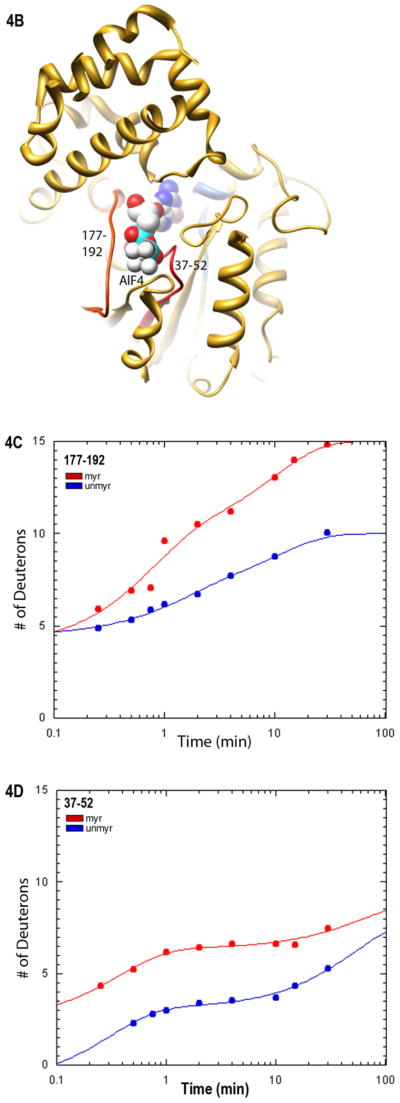
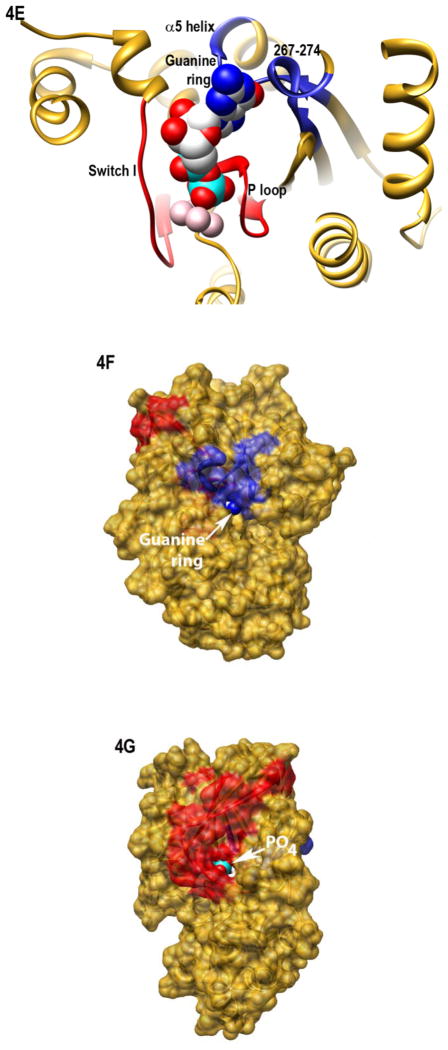
Gα-nucleotide interactions along the phosphate-binding corridor. (A) Representative trace of BD-GTPγS fluorescence increases (ex/em 485/515 nm) upon binding to myrGαi (red) and unmyrGαi (blue), shown relative to basal BD-GTPγS fluorescence prior to addition of Gα and fit to a single exponential association curve using GraphPad Prism 4.0 as described in methods. Inset: quantitation of maximal increase using data from three independent experiments ± SEM. (B) Red: regions in the phosphate binding corridor (1GFI (2), rendered with Chimera (66)), which were analyzed by H/D exchange. (C-D) Time-dependence of H/D exchange (as described in Fig. 2) for peptides in SwI, residues 177–192 (C) and the P loop, residues 37–52 (D), both highlighted red in B. (E) Ribbon view of interactions surrounding bound nucleotide in activated Gαi proteins (1GFI (2), rendered with Chimera (66)), colored as in 3B and 4B. Regions of high solvent accessibility and/or protein dynamics in the phosphate binding corridor are shown in red, regions with reduced protein dynamics and/or solvent accessibility surrounding the guanine ring shown in blue. (F–G) Chimera surface rendering of 4E, with B and C rotated approximately 180° about the vertical axis.
Regions that contribute residues important for nucleotide binding and hydrolysis include the SwI region and P-loop (2, 3), encompassed by peptides 177–192 and 37–52, respectively (Fig. 4B, shown in red). Although the percentage of hydrogens undergoing fast exchange in the region encompassing SwI residues 177–192 is similar regardless of myristoylation, this region nevertheless exhibited a myr-dependent increase in the dynamics of H/D exchange (Fig. 4C). Furthermore, there was an increase in the fast H/D exchange for residues 37–52 in the P-loop region of the myr protein (Fig. 4D). This myr-dependent increase in the percentage of fast exchange in the P-loop is also consistent with a more polar environment surrounding the Bodipy group linked to the third phosphate of GTPγS that we detected in the myrGαi protein (Fig. 4A). Depictions of regions surrounding the guanine ring and in the phosphate binding corridor described above are shown in ribbon (Fig. 4E) and space-fill views (Fig. 4F–G) for reference. These results indicate that regions involved in nucleotide binding are altered by myristoylation, including regions surrounding the guanine ring and those lining the phosphate binding corridor.
Myristoylation alters environment of residues in the SwII region
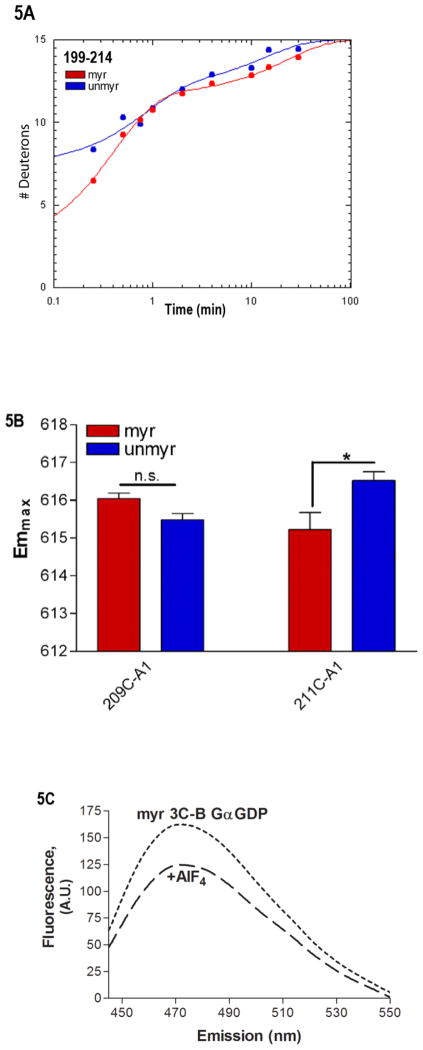
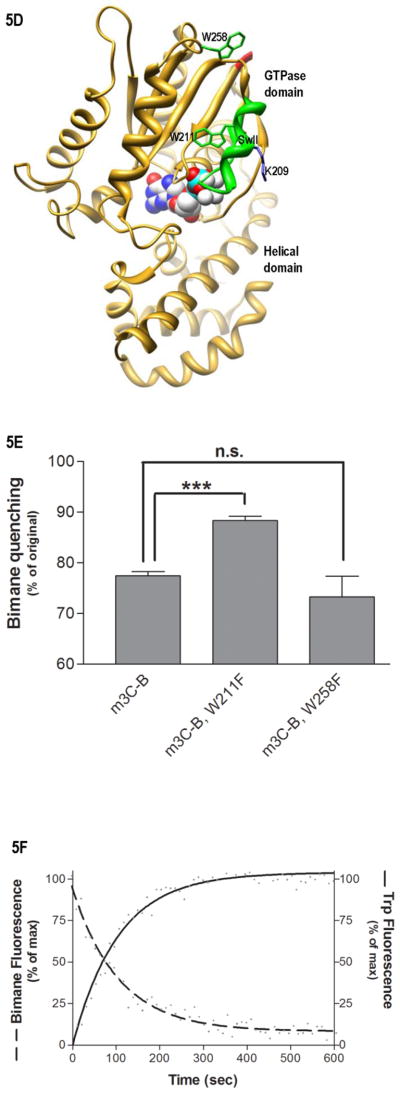
Given the effects of N-terminal myristoylation on regions involved in nucleotide binding and hydrolysis, we next examined the effect of myristoylation on interactions the SwII region. This Switch region is known for its ability to report activation-dependent changes in conformation through changes in the emission of Trp211 located in this region, which exhibits enhanced emission due to decrease in the polarity of its environment upon activation (42). While the time-dependence of the H/D exchange in SwII was unaltered by myristoylation, there was a myr-dependent decrease in the number of hydrogens undergoing fast H/D exchange, that is, exchange that occurs prior to the first timepoint of 15 seconds (Fig. 5A). To examine the environment of specific SwII residues, we compared the emmax of AlF4-activated myr and unmyrGαi HI proteins labeled at residues 209 and 211 (Fig. 5B). Both of the labeled proteins retained the ability to undergo activation-dependent changes as described in methods. Residue 211 reported a significant myr-dependent blue shift in emmax, consistent with a more hydrophobic environment for this residue in the myr protein, unlike effects on nearby residue 209. Since SwII residues do not directly contact bound nucleotide, and since a previous study demonstrates that myristoylation influences the environment of the SwII Trp (23), we next investigated the interaction between the myr N terminus and the SwII region.
Fig. 5.
Environment of SwII. (A) Shown is the time-dependence of H/D exchange (as described in Fig. 2) for the peptide spanning residues 199–214 encompassing the SwII region. (B) Emmax for the indicated A1-labeled Gαi HI proteins after AlF4 activation was determined from excitation at 580 nm and scanning peak emission between 590–750 nm in a minimum of 3 independent experiments as described in methods; results are mean ± S.E.M. (C) Representative trace of bimane emission from myrGαi HI protein labeled at the third residue with bimane. Emission was scanned between 430–550 nm with excitation at 375 nm, before (dotted line) and after (dashed line) activation with AlF4 as described in methods. (D–F) Localization of N terminus in myrGαi proteins. (D) Location of Trp residues (side chains shown in green) located within the GTPase domain of Gαi, with last resolved N-terminal residues shown in red, and SwII region containing W211 in green ribbon, (1GFI (2) rendered with Chimera (66)). (E) Quantitation of activation-dependent quenching of bimane fluorescence performed on N-terminally labeled myr proteins containing native Trp at positions 211 and 258 (left bar), or with either Trp mutated to Phe (right two bars), as described in methods. Results are the average of three independent experiments, ± SEM. (F) Dashed line: time-dependent decrease in bimane fluorescence (ex/em 375/470 nm) upon addition of 10 μM GTPγS to GDP-bound myrGαi HI W258F-3C-bimane, performed in triplicate, and fit to a single exponential curve shown. Solid line: time-dependent increase in Trp fluorescence (ex/em 280/340) upon addition of 10 μM GTPγS to GDP-bound (unlabeled) myrGαi HI W258F-3C, performed in triplicate, and fit to a single exponential curve shown, using GraphPad Prism 4.0. Assays performed at 18 °C as described in methods. Data are the average of three independent experiments.
Localization of the myr N terminus in the activated Gα protein
In order to determine if the reductions in solvent accessibility and exposure in the N-terminus and SwII were due to a direct binding event between these regions, as suggested previously (23), we performed bimane quenching experiments. Bimane quenching relies on the ability of tryptophan to quench bimane fluorescence when the fluorophore is within 15Ǻ of a tryptophan residue (43). The following experiments, designed to localize the N terminus, were confined to myr proteins; since all Gαi proteins are permanently myristoylated, interactions of the unmyrN terminus are of little relevance to signaling in vivo. We labeled the N terminus of myr 3C-Gαi HI at the third residue with a thiol-reactive bimane probe, and scanned the protein’s emission at bimane-specific wavelengths before and after activation of the protein with AlF4 (Fig. 5C). The activation-dependent quenching evidenced by a decreased emission from the probe upon activation indicated that the third residue closely approached one or more Trp residues in Gαi. Since there are 2 Trp residues in the GTPase domain, Trp258 and Trp211, near the last resolved residues in the N terminus of GαiGDP•AlF4 (Fig. 5D, Trp side chains shown in green, N terminus in red), we individually mutated each of these to Phe. We then repeated the quenching experiment as described in methods; only mutation of Trp211 was able to significantly relieve the activation-dependent quenching (Fig. 5E, center bar) of the N-terminal bimane probe, unlike nearby Trp258. All of the proteins are competent to undergo activation-dependent conformational changes in a manner similar to wild-type protein, as measured by the greater than 40% increase in intrinsic Trp fluorescence for proteins containing a native Trp residue at position 211, as described in methods. Since mutation of residue 211 precludes use of Trp activation assay, the ability of the bimane-labeled Trp 211 mutant was assayed by BD-GTPγS binding and tryptic digests. These controls demonstrate that the protein binds GTP analogs, and that the labeled protein can undergo AlF4-mediated activation in a manner similar to wild-type protein, which protects it from tryptic digestion (Fig. S2A–B).
To investigate the relevance of the activation-dependent quenching of bimane fluorescence to conformational changes in SwII that occur upon activation, we compared the time-dependence of the quenching to the time-dependence of Trp fluorescence, both upon exchange of GDP for GTPγS. We chose this measure because uncatalyzed GDP/GTPγS exchange in Gα proteins occurs at rates that are specific for each Gα isoform, and Trp fluorescence is enhanced upon GTPγS binding as a result of the conformational change in SwII that tucks Trp211 into a hydrophobic pocket. We conducted the experiments in the background of the myrGαi HI W258F protein, as this mutation reduced background fluorescence. We measured the time-dependence of bimane quenching (Fig. 5F, dashed line) and the time-dependence of Trp fluorescence increases that occur upon exchange of GDP for GTPγS (Fig. 5F, solid line) as described in methods. When we compared these results, we found that the time-dependence of bimane quenching essentially mirrored the time-dependent increase in Trp211 fluorescence, and these changes occurred at roughly the same rate (0.01 ± 0.002 sec−1). This indicates that the quenching of N-terminal fluorescence upon GTPγS binding is temporally linked to conformational changes in SwII that occur as a result of GDP/GTPγS in each of these Gαi proteins. Together with the observation that mutation of Trp211 relieves this quenching (Fig. 5E), the data indicated that activation-dependent changes in the environment of the myr N terminus and Trp211 in SwII were due to an increased proximity between these regions in the activated protein.
DISCUSSION
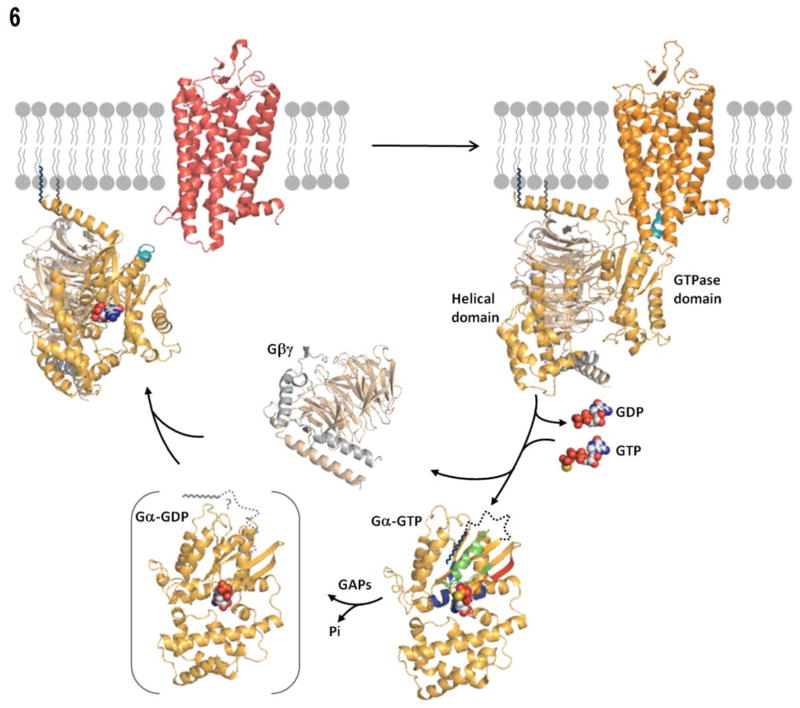
This comprehensive study of myristoylated Gαi proteins was undertaken in order to better understand the factors that aid in the solubility of activated, myrGα proteins. The association of the myr N terminus with the surface of the protein upon GTP binding, shown as a dark dotted line in Fig. 6, likely plays an important role in maintaining the solubility of myrGα proteins upon GTP binding through a dual disengagement of Gα from Gβγ and membrane fractions. Activation-dependent changes in the myr N terminus which regulates the protein’s access to membranes and binding partner(s) is a defining feature of all myristoyl switching proteins, including Arf (44), PKA (45), HIV-Gag (46), MARCKS (47), c-Src (48), and recoverin (49), hisactophilin (50), to name a few, as well as Gα subunits from the Gi family of heterotrimeric G proteins.
Fig. 6.
Model of the G protein cycle, rendered with Pymol (Pymol, DeLano, W.L. The PyMOL Molecular Graphics System (2002) DeLano Scientific, San Carlos, CA, USA. http://www.pymol.org). Model of receptor-bound state taken from (67): inactive receptor in red, and activated receptor in orange, C-terminus of Gα shown in teal, N-terminal myristate on Gα shown in navy blue and C-terminal farnesylation of Gγ in grey. Gβγ: Gβ in brown, and Gγ in grey. In the GTP-bound state, N-terminal residues 2–31 shown as a dotted line attached to myristate, with Switch II region in green, and other ribbons colored as in 4E and 5D.
The monomeric G protein Arf shares a number of structural and functional characteristics with heterotrimeric Gα proteins, including a homologous GTPase domain. A recent NMR structure of myr Arf (51) reveals the myristate bound in a series of overlapping orientations, indicating the intramolecular binding of the myr N terminus of Arf may be a highly dynamic process. Myristoylation of Arf also exerts allosteric effects on residues in Arf’s GTPase domain, distal from the N-terminal myr site, as is the case with Gα. Allostery and protein dynamics may be general mechanisms regulating GTPases that are subject to N-terminal myristoylation such as Arf and Gαi family proteins, with effects that are specific to the function of each protein.
In Gαi, the intramolecular interaction site is near to, or overlaps with, portions of the effector binding cleft, located between SwII and the α3 helix (11, 13, 52–59). While the proposed binding site for the myr N terminus may appear at first glance to be at odds with co-crystal structures of unmyrGα-effector proteins, this is not necessarily the case. This intramolecular binding could enhance, perturb or have no effect on interactions with effectors, and furthermore, this could occur in an effector-specific manner. The SwII region may accommodate binding of the myrN terminus and an effector without major alterations of the binding cleft, evidenced by the co-crystal structure of RGS9/PDEγ/Gαi/t, where the SwII of Gα cooperatively binds both the C terminus of PDEγ and portions of RGS9 (11). Moreover, there are indications in the literature that intramolecular binding of the N terminus and effector may not be mutually exclusive, at least for the myrGα-PDEγ interaction. A cross-linking study revealed activation-dependent cross-links between residues in the myrN terminus of Gαt and the C terminus of PDEγ ( 60), the same region of PDEγ that binds to the cleft in RGS9/PDEγ/Gαi/t complexes (11). Taken together, the cross-linking data and crystal structure place the C terminus of PDEγ and N-terminal residues of myrGα within 10Ǻ of each other and the effector binding cleft, consistent with the bimane quenching we observed. This activation-dependent quenching also rules out the myrN terminus collapsing on itself as a cause for changes in the environment of specifically labeled N-terminal residues (14, 31), and the quenching is also consistent with a previous study (23) demonstrating that myr altered the solvent exposure of Trp211 in the activated protein.
Given the fact that some Gα proteins are not myristoylated, and that unmyrGα proteins are often able to activate effectors, myristoyl-switching in heterotrimeric G proteins may serve to fine tune, rather than prevent, signaling. However, many in vitro studies comparing these effects employ N-terminally tagged recombinant Gαi and Gαi/t proteins. This hampers direct comparisons between myr and unmyr proteins, as does the inclusion of membrane lipids, and emphasizes the need for solution studies using untagged proteins in order to either confirm or rule out a direct role for myr in effector activation. For example, myr has been shown to enhance Gαi inhibition of adenylyl cyclase in experiments using membrane preparations (61), which reflect membrane anchorage effects as well as any direct effects that might be present due to myr. Nevertheless, another study demonstrates that a myristoyl-deficient Gαi2 protein remains membrane-associated but is unable to regulate adenylyl cylcase (62). Further studies in well-defined systems are needed to determine the influence of myr on effector activation, and to determine if these influences are effector-specific or more general in nature.
How do the various conformations in the N terminus relate to the G protein cycle depicted in Figure 6? Structures of unmyr heterotrimeric G proteins show the extreme amino-terminal helix of Gα flanking a solvent-exposed face of Gβγ and positioned for interaction with membrane-bound receptors (6, 8, 9, 39). Upon receptor-mediated GTP binding, affinity of Gα for Gβγ decreases (20, 63), and the intramolecular binding sequesters the N terminus away from this Gβγ interaction site as well as membranes. While both protein-lipid and protein-protein interactions play a role in the intramolecular binding, as seen by the relatively low extent of fast H/D exchange of the N terminus in both myr and unmyrGα, myr may more heavily favor the bound state, driven by hydrophobic interactions and the energy cost of solvating an exposed carbon chain. The intramolecular interaction results in a predominantly soluble protein (Fig. 6). The myr-dependent decrease in H/D exchange in the α4/β6 loop may serve to reduce surface area available for receptor interaction, aiding in the solubility of the myr protein. Upon hydrolysis of GTP to GDP, the N terminus of myrGαGDP exhibits a high degree of immobility (14) (Fig. 6, shown bracketed), and this conformation is also accompanied by remodeling of the SwII region (1, 2, 7, 23). The decreased mobility of the myr N terminus relative to the unmyr state observed in these EPR experiments indicates the N terminus of Gα is capable of adopting distinct conformations based on the presence of the myristoyl group (14). This is followed by Gβγ reassociation, leading to extrusion of the myr N terminus and subsequent burial in the membrane, where the inactive G protein remains poised for another round of activation.
The current study reveals insights into forces involved in stabilization of bound nucleotide in the activated protein. In vivo, bound GTP and Mg+2 position a catalytically important water molecule in the phosphate binding region of Gαi protein, flanked by SwI and the P-loop. In mice, expression of a myristoylation-deficient Gαt protein results in a degree of mislocalization, and the protein that is properly localized exhibits defects in deactivation (64), consistent with a role for myr in both localization and hydrolytic activities of the protein. The increased solvent exposure we detected in the P-loop as a result of myr may augment movement or positioning of this catalytic water, however the time-dependence of H/D exchange in the P-loop were unchanged by myristoylation. Dynamics of the P-loop may be stabilized by AlF4 binding in this region, or may simply be tightly regulated. The latter is suggested by a G42V mutation which increases flexibility of the P-loop and results in a 30-fold lower kcat for GTP hydrolysis than wild type Gαi (65). Opposite the P loop, in the SwI region, the myr protein displays increased protein dynamics, which may serve to predispose this Switch region for conformational changes which are known to occur upon GTP hydrolysis.
The strength and duration of nucleotide binding is critically important for the function of Gα proteins, as defects in either of these can have dramatic effects on signaling. We observed myr-dependent reductions in H/D exchange at the base of the α5 helix at nearly all time points tested. This region directly contacts the guanine ring of bound nucleotide. Myristoylation stabilized interactions between the guanine ring and the α5 helix, revealed by the D328R Gαi mutant which perturbs this interaction (32, 41), and these stabilizing effects were confirmed in wild-type Gαi proteins. Together these studies suggest that myr-dependent effects on the environment and H/D exchange dynamics of residues surrounding the guanine ring serve to enhance and stabilize nucleotide binding in the activated protein.
Taken together, the subtle and not-so-subtle myr-dependent differences we uncovered reveal alloseric influences of myristoylation on activated Gα proteins. These results are consistent with a myristoyl-switching mechanism for Gα proteins that modulates the access of these proteins to membranes and cytosol through activation-dependent changes in the myr N terminus of Gα subunits. Myr-dependent effects on activated Gα proteins influenced the stability of nucleotide binding in activated Gα proteins through interactions between the C-terminal α5 helix and the guanine ring. These results provide new insights into the role of myristoylation in the spatial and temporal regulation of G protein signaling.
Supplementary Material
Acknowledgments
This work funded by NIH Grant R01 EY06062 (H.E.H.), NIH Grant R01 GM030910 (R.N.A.) and supported in part by Vanderbilt CTSA grant UL1 RR024975 from NCRR/NI to A.M.P. and A.I.K.
We thank Guihua Liao for excellent technical assistance, and Megan Nicholson for careful reading of the manuscript.
ABBREVIATIONS
- N
amino
- C
carboxyl
- myr
myristoylated
- unmyr
unmyristoylated
- ex/em
excitation/emission
- BD
bodipy
- A1
Alexa
- MS/MS
tandem mass spectrometry
- LC
liquid chromatography
- H/D
hydrogen/deuterium
- HI
Gαil isoform lacking several solvent-exposed cysteines
- GDP
guanosine diphosphate
- GTP
guanosine triphosphate
- GTPγS
guanosine-5’-O-(3-thiotriphosphate)
- BD-GTPγS
Bodipy-GTPγS
- Gt
G protein of the rod outer segment, transducin
- Gi
family of G proteins coupled to inhibition of adenylyl cyclase
- Gs
family of G proteins coupled to activation of adenylyl cyclase
- Gα
α subunits of G proteins
- Gβγ
Gβ1γ1 dimer of heterotrimeric G proteins which binds Gαt/i family proteins
- β2-AR
β-2 adrenergic receptor
- AU
arbitrary units
- amu
atomic mass unit
- SEM
standard error of mean
- emmax
maximal emission wavelength
- Arf
ADP ribosylation factor
- PKA
cyclic AMP-dependent protein kinase
- HIV-1 Gag
Gag protein of the human immunodeficiency virus-1
- MARCKS
myristoylated alanine-rich C kinase substrate
- c-Src
the cellular homolog of the transforming protein of Rous sacroma virus
Footnotes
SUPPORTING INFORMATION AVAILABLE: Supplementary table and figures are available free of charge via the internet at http://pubs.acs.org.
References
- 1.Noel JP, Hamm HE, Sigler PB. The 2.2 Å crystal structure of transducin-α complexed with GTPγS. Nature. 1993;366:654–663. doi: 10.1038/366654a0. [DOI] [PubMed] [Google Scholar]
- 2.Coleman DE, Berghuis AM, Lee E, Linder ME, Gilman AG, Sprang SR. Structures of Active Conformations of Giα1 and the Mechanism of GTP Hydrolysis. Science. 1994;265:1405–1412. doi: 10.1126/science.8073283. [DOI] [PubMed] [Google Scholar]
- 3.Mixon MB, Lee E, Coleman DE, Berghuis AM, Gilman AG, Sprang SR. Tertiary and Quaternary Structural Changes in Giα1 Induced by GTP Hydrolysis. Science. 1995;270:954–960. doi: 10.1126/science.270.5238.954. [DOI] [PubMed] [Google Scholar]
- 4.Sondek J, Lambright DG, Noel JP, Hamm HE, Sigler PB. GTPase mechanism of Gproteins from the 1.7-Å crystal structure of transducin α•GDP•AIF4−. Nature. 1994;372:276–279. doi: 10.1038/372276a0. [DOI] [PubMed] [Google Scholar]
- 5.Coleman DE, Sprang SR. Crystal Structures of the G Protein Giα1 Complexed with GDP and Mg2+: A Crystallographic Titration Experiment. Biochemistry. 1998;37:14376–14385. doi: 10.1021/bi9810306. [DOI] [PubMed] [Google Scholar]
- 6.Rasmussen SG, Devree BT, Zou Y, Kruse AC, Chung KY, Kobilka TS, Thian FS, Chae PS, Pardon E, Calinski D, Mathiesen JM, Shah ST, Lyons JA, Caffrey M, Gellman SH, Steyaert J, Skiniotis G, Weis WI, Sunahara RK, Kobilka BK. Crystal structure of the beta(2) adrenergic receptor-Gs protein complex. Nature. 2011 doi: 10.1038/nature10361. [DOI] [PMC free article] [PubMed] [Google Scholar]
- 7.Lambright DG, Noel JP, Hamm HE, Sigler PB. Structural determinants for activation of the α-subunit of a heterotrimeric G protein. Nature. 1994;369:621–628. doi: 10.1038/369621a0. [DOI] [PubMed] [Google Scholar]
- 8.Lambright DG, Sondek J, Bohm A, Skiba NP, Hamm HE, Sigler PB. The 2.0 Å crystal structure of a heterotrimeric G protein. Nature. 1996;379:311–319. doi: 10.1038/379311a0. [DOI] [PubMed] [Google Scholar]
- 9.Wall MA, Coleman DE, Lee E, Iniguez-Lluhi JA, Posner BA, Gilman AG, Sprang SR. The Structure of the G Protein Heterotrimer Giα1β1γ2. Cell. 1995;83:1047–1058. doi: 10.1016/0092-8674(95)90220-1. [DOI] [PubMed] [Google Scholar]
- 10.Tesmer JJ, Berman DM, Gilman AG, Sprang SR. Structure of RGS4 Bound to AlF4−-activated Giα1: Stabilization of the Transition State for GTP Hydrolysis. Cell. 1997;89:251–261. doi: 10.1016/s0092-8674(00)80204-4. [DOI] [PubMed] [Google Scholar]
- 11.Slep KC, Kercher MA, He W, Cowan CW, Wensel TG, Sigler PB. Structural determinants for regulation of phosphodiesterase by a G protein at 2.0 Å. Nature. 2001;409:1071–1077. doi: 10.1038/35059138. [DOI] [PubMed] [Google Scholar]
- 12.Preininger AM, Hamm HE. G protein signaling: insights from new structures. Science Signal Transduction Knowledge Environment. 2004;2004:re3. doi: 10.1126/stke.2182004re3. [DOI] [PubMed] [Google Scholar]
- 13.Tesmer JJ, Sunahara RK, Gilman AG, Sprang SR. Crystal Structure of the Catalytic Domains of Adenylyl Cyclase in a Complex with Gsα·GTPγS. Science. 1997;278:1907–1916. doi: 10.1126/science.278.5345.1907. [DOI] [PubMed] [Google Scholar]
- 14.Preininger AM, Van Eps N, Yu NJ, Medkova M, Hubbell WL, Hamm HE. The Myristoylated Amino Terminus of Gαi1 Plays a Critical Role in the Structure and Function of Gαi1 Subunits in Solution. Biochemistry. 2003;42:7931–7941. doi: 10.1021/bi0345438. [DOI] [PubMed] [Google Scholar]
- 15.Linder ME, Pang IH, Duronio RJ, Gordon JI, Sternweis PC, Gilman AG. Lipid modifications of G protein subunits. Myristoylation of Go alpha increases its affinity for beta gamma. J Biol Chem. 1991;266:4654–4659. [PubMed] [Google Scholar]
- 16.Mumby SM, Linder ME. Myristoylation of G-protein alpha subunits. Methods Enzymol. 1994;237:254–268. doi: 10.1016/s0076-6879(94)37067-2. [DOI] [PubMed] [Google Scholar]
- 17.Chen CA, Manning DR. Regulation of G proteins by covalent modification. Oncogene. 2001;20:1643–1652. doi: 10.1038/sj.onc.1204185. [DOI] [PubMed] [Google Scholar]
- 18.Herrmann R, Heck M, Henklein P, Hofmann KP, Ernst OP. Signal transfer from GPCRs to G proteins: role of the G alpha N-terminal region in rhodopsin-transducin coupling. J Biol Chem. 2006;281:30234–30241. doi: 10.1074/jbc.M600797200. [DOI] [PubMed] [Google Scholar]
- 19.Kisselev OG, Downs MA. Rhodopsin Controls a Conformational Switch on the Transducin γ Subunit. Structure. 2003;11:367–373. doi: 10.1016/s0969-2126(03)00045-5. [DOI] [PubMed] [Google Scholar]
- 20.Mumby SM, Heukeroth RO, Gordon JI, Gilman AG. G-protein α-subunit expression, myristoylation, and membrane association in COS cells. Proceedings of the National Academy of Sciences of the United States of America. 1990;87:728–732. doi: 10.1073/pnas.87.2.728. [DOI] [PMC free article] [PubMed] [Google Scholar]
- 21.Jia L, Linder ME, Blumer KJ. Gi/o signaling and the palmitoyltransferase DHHC2 regulate palmitate cycling and shuttling of RGS7 family-binding protein. J Biol Chem. 286:13695–13703. doi: 10.1074/jbc.M110.193763. [DOI] [PMC free article] [PubMed] [Google Scholar]
- 22.Resh MD. Regulation of cellular signalling by fatty acid acylation and prenylation of signal transduction proteins. Cellular Signalling. 1996;8:403–412. doi: 10.1016/s0898-6568(96)00088-5. [DOI] [PubMed] [Google Scholar]
- 23.Hamm HE, Meier SM, Liao G, Preininger AM. Trp fluorescence reveals an activation-dependent cation-pi interaction in the Switch II region of Galphai proteins. Protein Sci. 2009;18:2326–2335. doi: 10.1002/pro.243. [DOI] [PMC free article] [PubMed] [Google Scholar]
- 24.Preininger AM, Parello J, Meier SM, Liao G, Hamm HE. Receptor-mediated changes at the myristoylated amino terminus of Galpha(il) proteins. Biochemistry. 2008;47:10281–10293. doi: 10.1021/bi800741r. [DOI] [PMC free article] [PubMed] [Google Scholar]
- 25.Hoofnagle AN, Resing KA, Ahn NG. Protein Analysis by Hydrogen Exchange Mass Spectrometry. Annual Review of Biophysics and Biomolecular Structure. 2003;32:1–25. doi: 10.1146/annurev.biophys.32.110601.142417. [DOI] [PubMed] [Google Scholar]
- 26.Hoofnagle AN, Resing KA, Ahn NG. Practical methods for deuterium exchange/mass spectrometry. Methods Mol Biol. 2004;250:283–298. doi: 10.1385/1-59259-671-1:283. [DOI] [PubMed] [Google Scholar]
- 27.Busenlehner LS, Armstrong RN. Insights into enzyme structure and dynamics elucidated by amide H/D exchange mass spectrometry. Arch Biochem Biophys. 2005;433:34–46. doi: 10.1016/j.abb.2004.09.002. [DOI] [PubMed] [Google Scholar]
- 28.Asuru AP, Busenlehner LS. Analysis of human ferrochelatase iron binding via amide hydrogen/deuterium exchange mass spectrometry. International Journal of Mass Spectroscopy. 2011;302:76–84. [Google Scholar]
- 29.Busenlehner LS, Salomonsson L, Brzezinski P, Armstrong RN. Mapping protein dynamics in catalytic intermediates of the redox-driven proton pump cytochrome c oxidase. Proc Natl Acad Sci U S A. 2006;103:15398–15403. doi: 10.1073/pnas.0601451103. [DOI] [PMC free article] [PubMed] [Google Scholar]
- 30.Oldham WM, Van Eps N, Preininger AM, Hubbell WL, Hamm HE. Mechanism of the receptor-catalyzed activation of heterotrimeric G proteins. Nature Structural and Molecular Biology. 2006;13:772–777. doi: 10.1038/nsmb1129. [DOI] [PubMed] [Google Scholar]
- 31.Medkova M, Preininger AM, Yu NJ, Hubbell WL, Hamm HE. Conformational Changes in the Amino-Terminal Helix of the G Protein αi1 Following Dissociation from Gβγ Subunit and Activation. Biochemistry. 2002;41:9962–9972. doi: 10.1021/bi0255726. [DOI] [PubMed] [Google Scholar]
- 32.Preininger A, Funk M, Meier S, Oldham W, Johnston C, Adhikary S, Kimple A, Siderovski D, Hamm H, Iverson T. Helix dipole movement and conformational variability contribute to allosteric GDP release in Gi subunits. Biochemistry. 2009;48:2630–2642. doi: 10.1021/bi801853a. [DOI] [PMC free article] [PubMed] [Google Scholar]
- 33.Mazzoni MR, Hamm HE. Tryptophan207 is involved in the GTP-dependent conformational switch in the alpha subunit of the G protein transducin: chymotryptic digestion patterns of the GTP gamma S and GDP-bound forms. J Protein Chem. 1993;12:215–221. doi: 10.1007/BF01026043. [DOI] [PubMed] [Google Scholar]
- 34.McEwen DP, Gee KR, Kang HC, Neubig RR. Fluorescence approaches to study G protein mechanisms. Methods Enzymol. 2002;344:403–420. doi: 10.1016/s0076-6879(02)44730-1. [DOI] [PubMed] [Google Scholar]
- 35.Rusconi F, Belghazi M. Desktop prediction/analysis of mass spectrometric data in proteomic projects by using massXpert. Bioinformatics. 2002;18:644–645. doi: 10.1093/bioinformatics/18.4.644. [DOI] [PubMed] [Google Scholar]
- 36.Clauser KR, Baker P, Burlingame AL. Role of accurate mass measurement (+/− 10 ppm) in protein identification strategies employing MS or MS/MS and database searching. Anal Chem. 1999;71:2871–2882. doi: 10.1021/ac9810516. [DOI] [PubMed] [Google Scholar]
- 37.Zhang Z, Marshall AG. A universal algorithm for fast and automated charge state deconvolution of electrospray mass-to-charge ratio spectra. J Am Soc Mass Spectrom. 1998;9:225–233. doi: 10.1016/S1044-0305(97)00284-5. [DOI] [PubMed] [Google Scholar]
- 38.Van Eps N, Oldham WM, Hamm HE, Hubbell WL. Structural and dynamical changes in an alpha-subunit of a heterotrimeric G protein along the activation pathway. Proc Natl Acad Sci U S A. 2006;103:16194–16199. doi: 10.1073/pnas.0607972103. [DOI] [PMC free article] [PubMed] [Google Scholar]
- 39.Hu J, Wang Y, Zhang X, Lloyd JR, Li JH, Karpiak J, Costanzi S, Wess J. Structural basis of G protein-coupled receptor-G protein interactions. Nat Chem Biol. 2010;6:541–548. doi: 10.1038/nchembio.385. [DOI] [PMC free article] [PubMed] [Google Scholar]
- 40.Oldham WM, Hamm HE. Heterotrimeric G protein activation by G-protein-coupled receptors. Nat Rev Mol Cell Biol. 2008;9:60–71. doi: 10.1038/nrm2299. [DOI] [PubMed] [Google Scholar]
- 41.Kapoor N, Menon ST, Chauhan R, Sachdev P, Sakmar TP. Structural evidence for a sequential release mechanism for activation of heterotrimeric G proteins. J Mol Biol. 2009;393:882–897. doi: 10.1016/j.jmb.2009.08.043. [DOI] [PubMed] [Google Scholar]
- 42.Faurobert E, Otto-Bruc A, Chardin P, Chabre M. Tryptophan W207 in transducin T alpha is the fluorescence sensor of the G protein activation switch and is involved in the effector binding. EMBO Journal. 1993;12:4191–4198. doi: 10.1002/j.1460-2075.1993.tb06103.x. [DOI] [PMC free article] [PubMed] [Google Scholar]
- 43.Mansoor SE, McHaourab HS, Farrens DL. Mapping proximity within proteins using fluorescence spectroscopy. A study of T4 lysozyme showing that tryptophan residues quench bimane fluorescence. Biochemistry. 2002;41:2475–2484. doi: 10.1021/bi011198i. [DOI] [PubMed] [Google Scholar]
- 44.Goldberg J. Structural Basis for Activation of ARF GTPase: Mechanisms of Guanine Nucleotide Exchange and GTP-Myristoyl Switching. Cell. 1998;95:237–248. doi: 10.1016/s0092-8674(00)81754-7. [DOI] [PubMed] [Google Scholar]
- 45.Gangal M, Clifford T, Deich J, Cheng X, Taylor SS, Johnson DA. Mobilization of the A-kinase N-myristate through an isoform-specific intermolecular switch. Proc Natl Acad Sci U S A. 1999;96:12394–12399. doi: 10.1073/pnas.96.22.12394. [DOI] [PMC free article] [PubMed] [Google Scholar]
- 46.Tang C, Loeliger E, Luncsford P, Kinde I, Beckett D, Summers MF. Entropic switch regulates myristate exposure in the HIV-1 matrix protein. Proc Natl Acad Sci U S A. 2004;101:517–522. doi: 10.1073/pnas.0305665101. [DOI] [PMC free article] [PubMed] [Google Scholar]
- 47.Seykora JT, Myat MM, Allen LA, Ravetch JV, Aderem A. Molecular determinants of the myristoyl-electrostatic switch of MARCKS. J Biol Chem. 1996;271:18797–18802. doi: 10.1074/jbc.271.31.18797. [DOI] [PubMed] [Google Scholar]
- 48.Patwardhan P, Resh MD. Myristoylation and membrane binding regulate c-Src stability and kinase activity. Mol Cell Biol. 30:4094–4107. doi: 10.1128/MCB.00246-10. [DOI] [PMC free article] [PubMed] [Google Scholar]
- 49.Ames JB, Tanaka T, Stryer L, Ikura M. Secondary structure of myristoylated recoverin determined by three-dimensional heteronuclear NMR: implications for the calcium-myristoyl switch. Biochemistry. 1994;33:10743–10753. doi: 10.1021/bi00201a023. [DOI] [PubMed] [Google Scholar]
- 50.Hanakam F, Gerisch G, Lotz S, Alt T, Seelig A. Binding of hisactophilin I and II to lipid membranes is controlled by a pH-dependent myristoyl-histidine switch. Biochemistry. 1996;35:11036–11044. doi: 10.1021/bi960789j. [DOI] [PubMed] [Google Scholar]
- 51.Liu Y, Kahn RA, Prestegard JH. Dynamic structure of membrane-anchored Arf*GTP. Nat Struct Mol Biol. 2010;17:876–881. doi: 10.1038/nsmb.1853. [DOI] [PMC free article] [PubMed] [Google Scholar]
- 52.Yan SZ, Huang ZH, Rao VD, Hurley JH, Tang WJ. Three discrete regions of mammalian adenylyl cyclase form a site for Gsalpha activation. J Biol Chem. 1997;272:18849–18854. doi: 10.1074/jbc.272.30.18849. [DOI] [PubMed] [Google Scholar]
- 53.Tesmer JJ, Sunahara RK, Johnson RA, Gosselin G, Gilman AG, Sprang SR. Two-Metal-Ion Catalysis in Adenylyl Cyclase. Science. 1999;285:756–760. doi: 10.1126/science.285.5428.756. [DOI] [PubMed] [Google Scholar]
- 54.Chen Z, Singer WD, Sternweis PC, Sprang SR. Structure of the p115RhoGEF rgRGS domain-Gα13/i1 chimera complex suggests convergent evolution of a GTPase activator. Nature Structural and Molecular Biology. 2005;12:191–197. doi: 10.1038/nsmb888. [DOI] [PubMed] [Google Scholar]
- 55.Tesmer VM, Kawano T, Shankaranarayanan A, Kozasa T, Tesmer JJ. Snapshot of Activated G Proteins at the Membrane: The Gαq-GRK2-Gβγ Complex. Science. 2005;310:1686–1690. doi: 10.1126/science.1118890. [DOI] [PubMed] [Google Scholar]
- 56.Skiba NP, Bae H, Hamm HE. Mapping of Effector binding Sites of Transducin α-Subunit Using Gαt/Gαi1 Chimeras. Journal of Biological Chemistry. 1996;271:413–424. doi: 10.1074/jbc.271.1.413. [DOI] [PubMed] [Google Scholar]
- 57.Venkatakrishnan G, Exton JH. Identification of determinants in the alpha-subunit of Gq required for phospholipase C activation. J Biol Chem. 1996;271:5066–5072. doi: 10.1074/jbc.271.9.5066. [DOI] [PubMed] [Google Scholar]
- 58.Artemyev NO, Mills JS, Thornburg KR, Knapp DR, Schey KL, Hamm HE. A site on transducin alpha-subunit of interaction with the polycationic region of cGMP phosphodiesterase inhibitory subunit. Journal of Biological Chemistry. 1993;268:23611–23615. [PubMed] [Google Scholar]
- 59.Artemyev NO, Natochin M, Busman M, Schey KL, Hamm HE. Mechanism of photoreceptor cGMP phosphodiesterase inhibition by its gamma-subunits. Proceedings of the National Academy of Sciences of the United States of America. 1996;93:5407–5412. doi: 10.1073/pnas.93.11.5407. [DOI] [PMC free article] [PubMed] [Google Scholar]
- 60.Grant JE, Guo LW, Vestling MM, Martemyanov KA, Arshavsky VY, Ruoho AE. The N terminus of GTP gamma S-activated transducin alpha-subunit interacts with the C terminus of the cGMP phosphodiesterase gamma-subunit. J Biol Chem. 2006;281:6194–6202. doi: 10.1074/jbc.M509511200. [DOI] [PubMed] [Google Scholar]
- 61.Taussig R, Iniguez-Lluhi JA, Gilman AG. Inhibition of Adenylyl Cyclase by Giα. Science. 1993;261:218–221. doi: 10.1126/science.8327893. [DOI] [PubMed] [Google Scholar]
- 62.Gallego C, Gupta SK, Winitz S, Eisfelder BJ, Johnson GL. Myristoylation of the Gαi2 polypeptide, a G protein α subunit, is required for its signaling and transformation functions. Proceedings of the National Academy of Sciences of the United States of America. 1992;89:9695–9699. doi: 10.1073/pnas.89.20.9695. [DOI] [PMC free article] [PubMed] [Google Scholar]
- 63.Linder ME, Pang IH, Duronio RJ, Gordon JI, Sternweis PC, Gilman AG. Lipid Modifications of G Protein Subunits. Myristoylation of Goα Increases its Affinity for βγ. Journal of Biological Chemistry. 1991;266:4654–4659. [PubMed] [Google Scholar]
- 64.Kerov V, Rubin WW, Natochin M, Melling NA, Burns ME, Artemyev NO. N-terminal fatty acylation of transducin profoundly influences its localization and the kinetics of photoresponse in rods. J Neurosci. 2007;27:10270–10277. doi: 10.1523/JNEUROSCI.2494-07.2007. [DOI] [PMC free article] [PubMed] [Google Scholar]
- 65.Raw AS, Coleman DE, Gilman AG, Sprang SR. Structural and Biochemical Characterization of the GTPγS-, GDP•Pi-, and GDP-bound Forms of a GTPase-Deficient Gly42 → Val mutant of Giα1. Biochemistry. 1997;36:15660–15669. doi: 10.1021/bi971912p. [DOI] [PubMed] [Google Scholar]
- 66.Pettersen EF, Goddard TD, Huang CC, Couch GS, Greenblatt DM, Meng EC, Ferrin TE. UCSF Chimera--a visualization system for exploratory research and analysis. J Comput Chem. 2004;25:1605–1612. doi: 10.1002/jcc.20084. [DOI] [PubMed] [Google Scholar]
- 67.Van Eps N, Preininger AM, Alexander N, Kaya AI, Meier S, Meiler J, Hamm HE, Hubbell WL. Interaction of a G protein with an activated receptor opens the interdomain interface in the alpha subunit. Proc Natl Acad Sci U S A. 2011;108:9420–9424. doi: 10.1073/pnas.1105810108. [DOI] [PMC free article] [PubMed] [Google Scholar]
Associated Data
This section collects any data citations, data availability statements, or supplementary materials included in this article.


