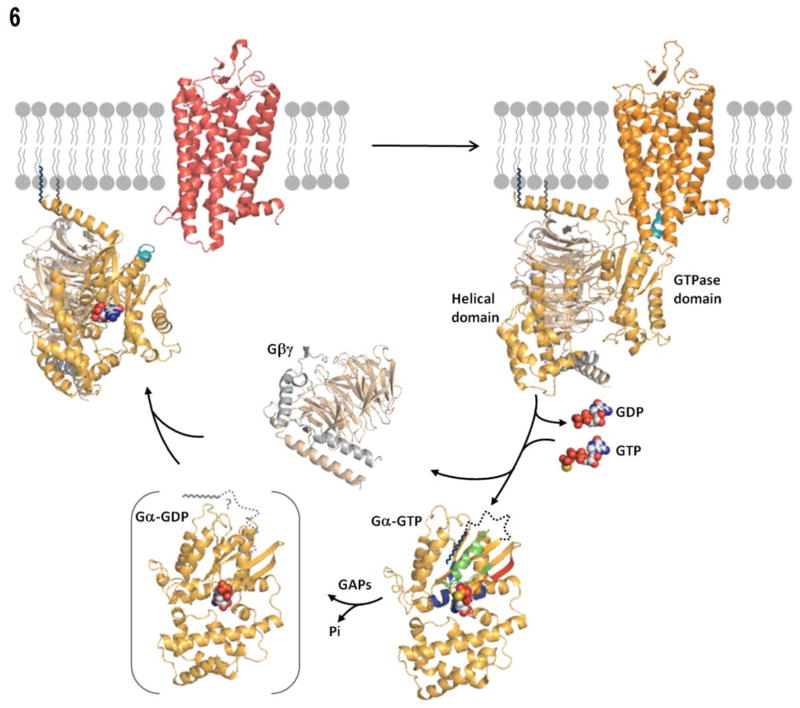
Fig. 6.
Model of the G protein cycle, rendered with Pymol (Pymol, DeLano, W.L. The PyMOL Molecular Graphics System (2002) DeLano Scientific, San Carlos, CA, USA. http://www.pymol.org). Model of receptor-bound state taken from (67): inactive receptor in red, and activated receptor in orange, C-terminus of Gα shown in teal, N-terminal myristate on Gα shown in navy blue and C-terminal farnesylation of Gγ in grey. Gβγ: Gβ in brown, and Gγ in grey. In the GTP-bound state, N-terminal residues 2–31 shown as a dotted line attached to myristate, with Switch II region in green, and other ribbons colored as in 4E and 5D.

