Abstract
We have sought to identify signals of assimilation of African male lines in Lebanon by exploring the association of sickle cell disease in Lebanon with Y-chromosome haplogroups that are informative of the disease origin and its exclusivity to the Muslim community. A total of 732 samples were analyzed including 33 sickle cell disease patients from Lebanon genotyped for 28 binary markers and 19 short tandem repeats on the non-recombinant segment of the Y chromosome. Genetic organization was identified using populations known to have influenced the genetic structure of the Lebanese population, in addition to African populations with high incidence of sickle cell disease. Y-chromosome haplogroup R-M343 sub-lineages distinguish between sub-Saharan African and Lebanese Y chromosomes. We detected a limited penetration of sickle cell disease into Lebanese R-M343 carriers, restricted to Lebanese Muslims. We suggest that this penetration brought the sickle cell gene along with the African R-M343, probably with the Saharan caravan slave trade.
Keywords: Lebanon, Population Genetics, Sickle Cell Disease, Y SNPs, Y STRs
Introduction
Sickle cell disease (SCD) is an inherited autosomal recessive disorder of the β-globin chain, widely distributed throughout equatorial Africa reaching heterozygote frequencies as high as 30-40% in parts of Uganda, West Africa, and Zaire1 because it confers resistance to malaria. The sickle gene spread to North Africa and the Mediterranean along Saharan caravan trading routes, to North and South America, and the Caribbean by slave trade, and then to Northern Europe by immigration from the Caribbean2. Linkage analysis of the β-globin sickle mutations suggest homoplasy,1 with African and Asian origins distinguished by their haplotypes3. Previous studies of sickle mutations in the Lebanese population showed that 91.5% of the patients were Sunni and Shiite Muslims4 (Sunni and Shiites make 58% of the general Lebanese population5) and that 90% of SCD subjects carried an African haplotype6.
The origin, time of spread, or details of the association of SCD with Lebanese Muslims cannot be deduced from the genetic content of sickle haplotypes. The sickle mutation is estimated to have arisen 3000-6000 generations ago7, 8, while the haplotypes surrounding the β-globin locus are even older. Specificity of geographic origin among SCD haplogroups has been noted9 along with some historical, sociological and genetic suggestions of possible migration routes into Lebanon10, 11. Also, studies of heterozygosity have been used to impose limits on time of recent migration.12
We have previously used Y chromosome markers to study population structure and migration into Lebanon13. Since SCD is closely affiliated with specific Lebanese communities which correlate with Y-chromosome diversity, SCD and Y-chromosome polymorphisms could reveal structure in migrant assimilation. Indeed, the time of spread of the sickle mutation across the Sahel has been previously inferred from a Y-chromosome Single Nucleotide Polymorphism (SNP) that was co-integrated with the sickle gene by West African tribes migrating to the East14.
In this study, we investigated the penetration of the sickle-cell mutation into Lebanon, and explored association between certain African Y-chromosome lineages and the chromosome 11 sickle cell mutation in order to determine whether there is a sign of persistent population structure characterizing assimilation of Africans in Lebanon. We also investigated the sickle cell penetration into the broader Lebanese population through examination of a set of sickle cell patients bearing non-African Y haplogroups.
Materials and methods
Subjects and Comparative Datasets
The populations selected for this study were those who had potentially influenced the genetic structure of the Lebanese population15 in addition to African populations with high incidence of SCD. A total of 732 samples were analyzed including newly genotyped samples from Libya (33), Kuwait (8), and Lebanese SCD patients (28 Muslims, 5 Christians). The new samples were added to previously genotyped samples from our laboratory13, 16, 17; Lebanon (250), Egypt (84), Iran (56), and Malta (20). In addition comparative data from Central Africa (46), Algeria (16), Italy (103), KSA (50), UAE (18), Uganda (10), and Yemen (5) were obtained from published sources18-23. All samples had an unknown SCD status except for the 33 newly genotyped Lebanese samples. SCD male subjects were used from our database6 after they were anonymiszed and approved for this study by the IRB of the Lebanese American University. All other participants provided detailed information on their geographical origin, and gave informed consent approved by the IRB of the Lebanese American University.
Genotyping
DNA was extracted from blood using a standard Phenol-Chloroform method. Samples were genotyped using the Applied Biosystems 7900HT Fast Real-Time PCR System with a set of 28 custom Y-chromosomal binary marker assays (Applied Biosystems, Foster City, CA) from the non-recombining portion of the Y chromosome which define 21 haplogroups. The new samples were additionally amplified at 19 Y-chromosomal STR loci in two multiplexes and analyzed on an Applied Biosystems 3130xl Genetic Analyzer. The first multiplex contained the standard 17 loci of the Y-filer™ PCR Amplification kit (Applied Biosystems, Foster City, CA). The remaining two loci, DYS388 and DYS426, were genotyped in a separate custom multiplex provided by Applied Biosystems.
Statistical Analyses
From R-M343, J-M172, J-M267, and E-M35, we found that R-M343 had regionally differentiating Y STR haplotypes identified by Reduced Median Networks24 with a reduction coefficient of 1, and validated with MDS25 applied to ΦST computed in ARLEQUIN26, and tested using AMOVA27.
Reduced Median Network and AMOVA was performed to ascertain the variance characteristics among the Y-STR loci of R-M343 that were common to this study and the literature; DYS393, DYS390, DYS19, DYS391, DYS439, DYS389I, DYS392, DYS389b, DYS437, DYS438. AMOVA seeks to identify variance within populations due to drift by comparing variation among groups of similar populations via a nested analysis of variance. MDS was executed with SPSS16 in two dimensions with a minimum S-stress of 0.005. Likewise, non-African haplogroups were identified, marking penetration of African sickle cell mutations into the general Lebanese population. An extension to the Hardy-Weinberg28 equilibration model was constructed analytically following standard arguments,29 assuming complete replacement each generation, where children randomly select both parents (sexes treated distinctly), randomly select a diploid chromosome 11 from each parent, and inherit the haploid Y chromosome from the father. Deviations from such random selection imply population structure. The extended Hardy-Weinberg equilibration process showed the heterozygous diploid sickle cell markers among females equilibrating immediately, while the deviation from equilibrium for the African Y vs. sickle mutations reduced by a factor of 2 each generation. At equilibrium, the Y African markers and the sickle markers are independent. This implies that, if 7 or more generations have occurred since African input, the deviation from equilibrium will not exceed 0.8%. Prevalence of SCD among Lebanese in general, and among R-M343 in Lebanon specifically, are not available, so standard tests of linkage disequilibrium are not possible. However, it is possible to test whether P(SCD|R – M343 = African) = P(SCD|R – M343). Therefore, a Fisher test for dependence between the Y African expansion marker and the sickle cell was applied to test population structure.
Results
Y genotyping of the SCD patients revealed 6 haplogroups (14 J-M267, 5 J-M172, 8 E-M35, 4 R-M343, 1 T-M70, 1 N-LLY22g) all previously reported in the general Lebanese population.13, 16, 17
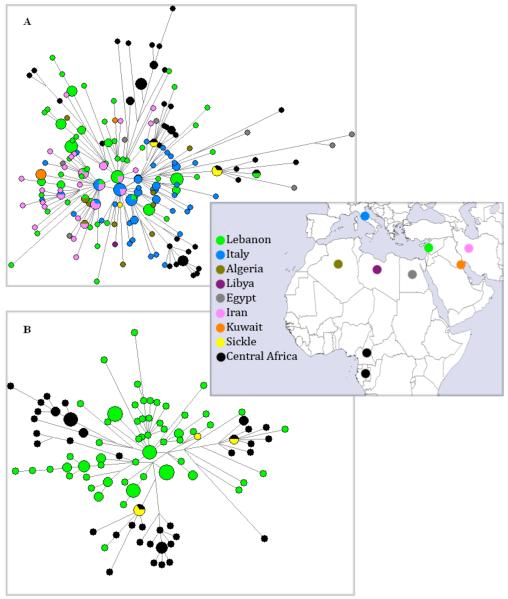
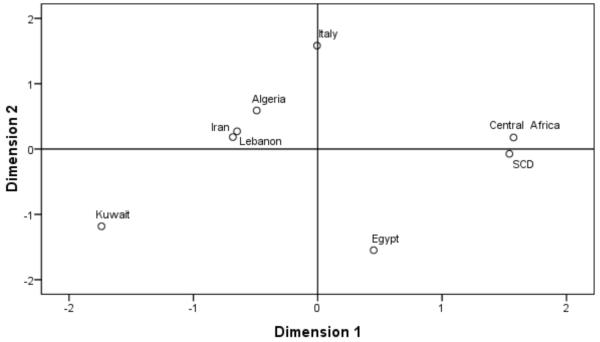
RM networks of R-M343 (Figure 1) showed significant regional differentiation between Central Africans, Europeans, and Lebanese. The probability that random region assignments would have isolated 46 Africans out of the 48 in the segregated branches, being drawn from 46 out of 124 by chance has a Fisher p-value <0.001. Corollary is that the two Lebanese samples in those branches likely represent African descent. Both samples were identified as Lebanese Muslims. The SCD samples were also all contained in African branches. The chances that all 4 SCD samples would have been drawn from African branches by chance have a p-value of 0.017. This result is also supported by the MDS plot, as well as significant AMOVA variation between the groups (20.07%, p<0.001, Table1). R-M343 SCD subjects were all Muslims and clustered with Central African haplotypes. The SCD-Central African ΦST distances was the lowest (ΦST=0.048) with no significant differentiation (p= 0.33±0.03) compared to all other populations, including the Lebanese (ΦST=0.215) with significant segregation (p= 0.027±0.019). MDS of the ΦST’s showed strong clustering of the SCD with Central Africans outlying all other populations (Figure 2).
Figure 1.
Sample distribution and Reduced Median Network of R-M343. The map shows the location of the samples used in the Networks and the respective color for every population. A) Reduced Median Network of R-M343 from all indicated populations in the map. B) Reduced Median Network of R-M343 from Lebanon, Central Africa and Lebanese Sickle Cell disease patients.
Table 1.
AMOVA results comparing variations among Europeans, Central Africans, and Lebanese
|
Va;FCT Among Groups |
Vb;FSC Within Groups |
Vc;FSR Within Populations |
|
|---|---|---|---|
| Value | 0.896; 0.201 | 0.287; 0.080 | 3.280; 0.265 |
| % Variation | 20.07 | 6.43 | 73.49 |
| p-value | <0.001 | <0.001 | <0.001 |
Figure 2.
MDS plot of Φ distances between populations derived from Y-STR data of R-M343.
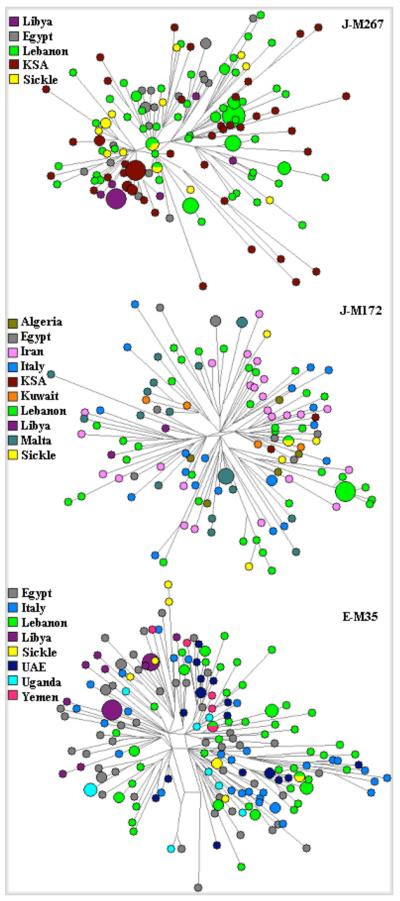
Reduced-Median networks of haplogroups E-M35, J-M267 and J-M172 (Figure 3) show that SCD haplotypes are present only in the general Lebanese population indicating penetration of the sickle gene into the population at large.
Figure 3.
Reduced Median Networks of J-M267, J-M172, and E-M35.
Discussion
We have shown that R-M343 STR haplotypes clearly discriminate between Lebanese and African origins, unlike other common haplogroups which also are not represented in the African populations. This enables identification of African chromosomes that have migrated to Lebanon. Further, SCD among R-M343 Lebanese subjects is largely confined to African haplotypes. The strong association of the sickle gene with the African R-M343 would suggest the source populations carried a high frequency of both markers. The sickle mutation is very common to African populations unlike R-M343 which is rare in Africa and found mainly in Europe and Asia. However, R-M343 has been found in high concentration in some populations from Central-West Africa where it reaches very high frequencies (up to 95%) in populations in the central Sahel; northern Cameroon, northern Nigeria, Chad, and Niger.30,31 For many centuries African slaves were drawn from those populations and driven across the central Sahara to the Mediterranean ports, a regular trade seems to have been established in the early Islamic era32 and continued until the 1840’s32, 33 confined then to the central and eastern basins of the Mediterranean still under Ottoman influence32. Deviations from Hardy-Weinberg equilibrium of diploid SCD in both genders with haploid male African markers in a Wright-Fisher model decay by a factor of 2 per generation. Therefore, an unstructured population would have SCD nearly uniformly distributed among Lebanese R-M343 haplotypes, however the R-M343 SCD subjects were exclusive to African haplotypes, and found only among Lebanese Muslims.
The probability that 28 or more out of 33 samples drawn from a population would be Muslim when drawn from a population with 58% Muslim is estimated to be by binomial test. Conversion to Islam provided a means to better treatment and possible later emancipation,33 and prohibition of non-Muslim slave ownership promoting slave conversions to Islam solely,34 explains SCD association with Muslim subjects. However, the limited penetration of SCD into Lebanese R-M343 contradicts a picture of many centuries of conversion and assimilation refreshed by caravan trade, implying a persistently structured population, even allowing for SCD introduction through the female line. Even though equilibration was not observed among R-M343 subjects, mixing was reflected by penetration to non-African haplogroups J-M267, J-M172, and E-M35. In all, this study reveals subtle population structure surviving for over two centuries in Lebanon, with significant medical consequences.
Acknowledgements
We thank the sample donors for taking part in this study. CTS is supported by The Wellcome Trust.
Bibliography
- 1.Serjeant GR. Geography and the clinical picture of sickle cell disease. An overview. Ann N Y Acad Sci. 1989;565:109–119. doi: 10.1111/j.1749-6632.1989.tb24157.x. [DOI] [PubMed] [Google Scholar]
- 2.Serjeant GR. Sickle-cell disease. Lancet. 1997;350:725–730. doi: 10.1016/S0140-6736(97)07330-3. [DOI] [PubMed] [Google Scholar]
- 3.Kamel K. Heterogeneity of sickle cell anaemia in Arabs: review of cases with various amounts of fetal haemoglobin. J Med Genet. 1979;16:428–430. doi: 10.1136/jmg.16.6.428. [DOI] [PMC free article] [PubMed] [Google Scholar]
- 4.Inati A, Jradi O, Tarabay H, Moallem H, Rachkidi Y, El Accaoui R, et al. Sickle cell disease: the Lebanese experience. Int J Lab Hematol. 2007;29:399–408. doi: 10.1111/j.1751-553X.2007.00964.x. [DOI] [PubMed] [Google Scholar]
- 5.Douaihy YCZ. The Lebanese 1907-2006: Confessions, Religions and Demographic Distribution. Beirut: 2007. [Google Scholar]
- 6.Inati A, Taher A, Bou Alawi W, Koussa S, Kaspar H, Shbaklo H, et al. Betaglobin gene cluster haplotypes and HbF levels are not the only modulators of sickle cell disease in Lebanon. Eur J Haematol. 2003;70:79–83. doi: 10.1034/j.1600-0609.2003.00016.x. [DOI] [PubMed] [Google Scholar]
- 7.Kurnit DM. Evolution of sickle variant gene. Lancet. 1979;1:104. doi: 10.1016/s0140-6736(79)90093-x. [DOI] [PubMed] [Google Scholar]
- 8.Solomon E, Bodmer WF. Evolution of sickle variant gene. Lancet. 1979;1:923. doi: 10.1016/s0140-6736(79)91398-9. [DOI] [PubMed] [Google Scholar]
- 9.Gabriel A, Przybylski J. Sickle-cell anemia: A Look at Global Haplotype Distribution. Nature Education. 2010;3:2. [Google Scholar]
- 10.Adekile AD. Anthropology of the beta S gene-flow from West Africa to north Africa, the Mediterranean, and southern Europe. Hemoglobin. 1992;16:105–121. doi: 10.3109/03630269209005685. [DOI] [PubMed] [Google Scholar]
- 11.Aksoy M. Hemoglobin S in Eti-Turks and the Allewits in Lebanon. Blood. 1961;17:657–659. [PubMed] [Google Scholar]
- 12.Ragusa A, Lombardo M, Sortino G, Lombardo T, Nagel RL, Labie D. βS Gene in Sicily Is in Linkage Disequilibrium With the Benin Haplotype: Implications for Gene Flow. American Journal of Hematology. 1988;27:139–141. doi: 10.1002/ajh.2830270214. [DOI] [PubMed] [Google Scholar]
- 13.Zalloua PA, Xue Y, Khalife J, Makhoul N, Debiane L, Platt DE, et al. Y-chromosomal diversity in Lebanon is structured by recent historical events. Am J Hum Genet. 2008;82:873–882. doi: 10.1016/j.ajhg.2008.01.020. [DOI] [PMC free article] [PubMed] [Google Scholar]
- 14.Bereir RE, Hassan HY, Salih NA, Underhill PA, Cavalli-Sforza LL, Hussain AA, et al. Co-introgression of Y-chromosome haplogroups and the sickle cell gene across Africa’s Sahel. Eur J Hum Genet. 2007;15:1183–1185. doi: 10.1038/sj.ejhg.5201892. [DOI] [PubMed] [Google Scholar]
- 15.Hitti P. Lebanon in History from the Earliest Times to the Present. Macmillan; London: 1957. [Google Scholar]
- 16.El-Sibai M, Platt DE, Haber M, Xue Y, Youhanna SC, Wells RS, et al. Geographical structure of the Y-chromosomal genetic landscape of the Levant: a coastal-inland contrast. Ann Hum Genet. 2009;73:568–581. doi: 10.1111/j.1469-1809.2009.00538.x. [DOI] [PMC free article] [PubMed] [Google Scholar]
- 17.Zalloua PA, Platt DE, El Sibai M, Khalife J, Makhoul N, Haber M, et al. Identifying genetic traces of historical expansions: Phoenician footprints in the Mediterranean. Am J Hum Genet. 2008;83:633–642. doi: 10.1016/j.ajhg.2008.10.012. [DOI] [PMC free article] [PubMed] [Google Scholar]
- 18.Abu-Amero KK, Hellani A, Gonzalez AM, Larruga JM, Cabrera VM, Underhill PA. Saudi Arabian Y-Chromosome diversity and its relationship with nearby regions. BMC Genet. 2009;10:59. doi: 10.1186/1471-2156-10-59. [DOI] [PMC free article] [PubMed] [Google Scholar]
- 19.Berniell-Lee G, Calafell F, Bosch E, Heyer E, Sica L, Mouguiama-Daouda P, et al. Genetic and demographic implications of the Bantu expansion: insights from human paternal lineages. Mol Biol Evol. 2009;26:1581–1589. doi: 10.1093/molbev/msp069. [DOI] [PubMed] [Google Scholar]
- 20.Cadenas AM, Zhivotovsky LA, Cavalli-Sforza LL, Underhill PA, Herrera RJ. Y-chromosome diversity characterizes the Gulf of Oman. Eur J Hum Genet. 2008;16:374–386. doi: 10.1038/sj.ejhg.5201934. [DOI] [PubMed] [Google Scholar]
- 21.Gomes V, Sanchez-Diz P, Amorim A, Carracedo A, Gusmao L. Digging deeper into East African human Y chromosome lineages. Hum Genet. 2010;127:603–613. doi: 10.1007/s00439-010-0808-5. [DOI] [PubMed] [Google Scholar]
- 22.Onofri V, Alessandrini F, Turchi C, Fraternale B, Buscemi L, Pesaresi M, et al. Y-chromosome genetic structure in sub-Apennine populations of Central Italy by SNP and STR analysis. Int J Legal Med. 2007;121:234–237. doi: 10.1007/s00414-007-0153-y. [DOI] [PubMed] [Google Scholar]
- 23.Robino C, Crobu F, Di Gaetano C, Bekada A, Benhamamouch S, Cerutti N, et al. Analysis of Y-chromosomal SNP haplogroups and STR haplotypes in an Algerian population sample. Int J Legal Med. 2008;122:251–255. doi: 10.1007/s00414-007-0203-5. [DOI] [PubMed] [Google Scholar]
- 24.Bandelt HJ, Forster P, Sykes BC, Richards MB. Mitochondrial portraits of human populations using median networks. Genetics. 1995;141:743–753. doi: 10.1093/genetics/141.2.743. [DOI] [PMC free article] [PubMed] [Google Scholar]
- 25.Kruskal J. Multidimensional scaling by optimizing goodness of fit to a nonmetric hypothesis. Psychometrika. 1964:1–27. [Google Scholar]
- 26.Excoffier L, Laval G, Schneider S. Arlequin (version 3.0): an integrated software package for population genetics data analysis. Evol Bioinform Online. 2005;1:47–50. [PMC free article] [PubMed] [Google Scholar]
- 27.Excoffier L, Smouse PE, Quattro JM. Analysis of molecular variance inferred from metric distances among DNA haplotypes: application to human mitochondrial DNA restriction data. Genetics. 1992;131:479–491. doi: 10.1093/genetics/131.2.479. [DOI] [PMC free article] [PubMed] [Google Scholar]
- 28.Hartl DL, Clark AG. Principles of Population Genetics. 4th edn. Sinauer Associates; Sunderland, MA: 2007. Fourth Edition. [Google Scholar]
- 29.Felsenstein J. Theoretical Evolutionary Genetics. 2009 e-book available from Department of Genome Sciences, University of Washington, Seattle at http://evolution.gs.washington.edu/pgbook/pgbook.html.
- 30.Cruciani F, Santolamazza P, Shen P, Macaulay V, Moral P, Olckers A, et al. A back migration from Asia to sub-Saharan Africa is supported by high-resolution analysis of human Y-chromosome haplotypes. Am J Hum Genet. 2002;70:1197–1214. doi: 10.1086/340257. [DOI] [PMC free article] [PubMed] [Google Scholar]
- 31.Cruciani F, Trombetta B, Sellitto D, Massaia A, Destro-Bisol G, Watson E, et al. Human Y chromosome haplogroup R-V88: a paternal genetic record of early mid Holocene trans-Saharan connections and the spread of Chadic languages. Eur J Hum Genet. 2010;18:800–807. doi: 10.1038/ejhg.2009.231. [DOI] [PMC free article] [PubMed] [Google Scholar]
- 32.Wright J. The Mediterranean middle passage: the nineteenth century slave trade between Tripoli and the Levant. The Journal of North African Studies. 1996;1:42–58. [Google Scholar]
- 33.Lovejoy P. Transformations in Slavery: A History of Slavery in Africa. CUP; Cambridge: 1983. [Google Scholar]
- 34.Ben-Naeh Y. Blond, Tall, with Honey-Colored Eyes: Jewish Ownership of Slaves in the Ottoman Empire. Jewish History. 2006;20:315–332. [Google Scholar]


