Abstract
Cells with stem cell-like properties are now viewed as initiating and sustaining many cancers. This suggests that cancer can be cured by driving these cancer stem cells to extinction. The problem with this strategy is that ordinary stem cells are apt to be killed in the process. This paper sets bounds on the killing differential (difference between death rates of cancer stem cells and normal stem cells) that must exist for the survival of an adequate number of normal stem cells. Our main tools are birth–death Markov chains in continuous time. In this framework, we investigate the extinction times of cancer stem cells and normal stem cells. Application of extreme value theory from mathematical statistics yields an accurate asymptotic distribution and corresponding moments for both extinction times. We compare these distributions for the two cell populations as a function of the killing rates. Perhaps a more telling comparison involves the number of normal stem cells NH at the extinction time of the cancer stem cells. Conditioning on the asymptotic time to extinction of the cancer stem cells allows us to calculate the asymptotic mean and variance of NH. The full distribution of NH can be retrieved by the finite Fourier transform and, in some parameter regimes, by an eigenfunction expansion. Finally, we discuss the impact of quiescence (the resting state) on stem cell dynamics. Quiescence can act as a sanctuary for cancer stem cells and imperils the proposed therapy. We approach the complication of quiescence via multitype branching process models and stochastic simulation. Improvements to the τ-leaping method of stochastic simulation make it a versatile tool in this context. We conclude that the proposed therapy must target quiescent cancer stem cells as well as actively dividing cancer stem cells. The current cancer models demonstrate the virtue of attacking the same quantitative questions from a variety of modeling, mathematical, and computational perspectives.
Keywords: Birth–death process, Cancer, Stem cells, Extinction probability, Finite Fourier transform, Stochastic simulation
1. Introduction
Cancer cells with stem cell-like properties represent a novel target of therapy that may revolutionize the treatment of cancer. Mathematical models sharpen our understanding of how cancer stem cell populations evolve and suggest optimal strategies to attack them. Because they undergo repeated divisions, stem cells accumulate mutations over time. Cells derived from stem cells start down differentiation pathways that involve a limited number of cell divisions. Once they reach the end of their pathways, differentiated cells no longer accumulate the mutations caused by faulty DNA replication during cell division. Thus, many oncologists contend that only cells with stem cell-like properties can drive cancer [2,4,5,13,17,21,41,46,49,51,52,54,55,57,59,64–66,68,71]. Because normal stem cells are vital for the maintenance and repair of tissues [58], safe eradication of cancer stem cells requires selectively targeting cancer stem cells while sparing normal stem cells. In the current paper we explore in depth this hypothetical strategy and discuss its implications for the design of the next generation of cancer therapeutics. In a related paper we apply and extend some of these results to address current challenges facing medical oncologists in targeting leukemic stem cells [61].
There are controversies about what is meant by a cancer stem cell. Some of the properties we describe may hold for some malignant progenitor cells. Some authors use the term stem-like cell and tumor initiating cell when referring to cells with the above properties. We use the term stem cell in this article in that sense.
Our point of departure is the stochastic theory of linear birth–death processes. This is well trod ground mathematically [18,28,31,39,40,42,45], but the current problems raise novel issues not encountered in the standard treatments. For instance, how can one approximate the distribution of the extinction time for either population of stem cells? This brings in extreme-value theory from statistics, eigenfunction expansions, and the finite Fourier transform. We particularly fixate on three related questions: (a) What is the killing differential (difference between death rates of cancer stem cells and normal stem cells) that makes our hypothetical therapy viable? (b) What is the distribution of the number of normal stem cells at the random time of extinction of the cancer stem cells? (c) What implications does the phenomenon of quiescence have for the proposed therapy? To answer questions (a) and (b), we condition one birth–death process on the random extinction time of the other birth–death process. To answer question (c), we turn to multi-type branching processes, with stem cells of either kind divided into active and quiescent types. Because some of our answers are approximate, it helps to look at the same problem from multiple perspectives. This leads us to introduce the subject of stochastic simulation by τ-leaping [60]. Except for numerically unstable eigenfunction expansions, the different techniques discussed here reinforce one another and increase our confidence in the basic model.
| Nomenclature | |
| CSC | cancer stem cell |
| HSC | hematopoietic stem cell |
| NH | number of healthy stem cells at random time of extinc- tion of cancer stem cells |
| Mn | time at which n clans of stem cells go extinct |
| Greek symbols | |
| β | birth rate per stem cell |
| δ | death rate per stem cell |
| ϕ | rate of quiescence per actively dividing stem cell |
| α | rate of awakening per quiescent stem cell |
| ν | death rate per quiescent stem cell |
| βC | birth rate per cancer stem cell |
| δC | death rate per cancer stem cell |
| βH | birth rate per healthy stem cell |
| δH | death rate per healthy stem cell |
| ϕC | rate of quiescence per actively dividing cancer stem cell |
| αC | rate of awakening per quiescent stem cancer cell |
| νC | death rate per quiescent stem cancer stem cell |
| ϕH | rate of quiescence per actively dividing healthy stem cell |
| αH | rate of awakening per quiescent healthy stem cell |
| νH | death rate per quiescent healthy stem cell |
Before presenting an overview of the rest of the paper, let us comment on the relevance of stochastic models in general and birth–death processes in particular. In a nutshell, stochastic models are ideal for studying stem cell dynamics because key events of interest, such as extinction of a population of stem cells, are probabilistic in nature. Stem cells occupy well defined niches in the body, and it is not too hard to imagine the stem cell clans behaving independently, at least in the short run. Thus, linear birth–death processes appear to offer a good vehicle for modeling [18,28,31,39,40,42,45].
In the next section, we provide a brief overview of stem cell biology. In Section 3 we start with the distribution of the extinction time for a subcritical birth–death process starting with a single cell. This classical result is inadequate for our purposes because we typically start with many cells and must track all clans issuing from them. Using extreme-value theory, we find an accurate asymptotic distribution for the time at which all clans go extinct. This result allows us to compare probability densities for the extinction times of two coexisting populations of stem cells: normal stem cells and cancer stem cells, dying at different rates under therapy. Convergence in distribution does not imply convergence of moments, so in Section 3.2 we verify convergence of the mean and variance of the extinction times to the mean and variance of the asymptotic distribution.
In Section 3.3, we study the number of normal stem cells NH remaining at the random time all cancer stem cells go extinct. We derive the mean and variance for NH by conditioning on the extinction time of cancer stem cells. These quantities are heavily dependent on the selectivity of a therapy. We also compute the full distribution of NH using eigenvalue expansions and the finite Fourier transform. In Section 3.5 we discuss the quiescent (resting) state of the stem cell, and its impact on cancer stem cell dynamics under therapies that selectively eliminate actively dividing cells. Quiescence requires new models and a different set of numerical tools. We particularly focus on simulation and τ-leaping in Section 4. Our discussion summarizes all findings and comments on the role of mathematical modeling in cancer therapy.
2. Biological background
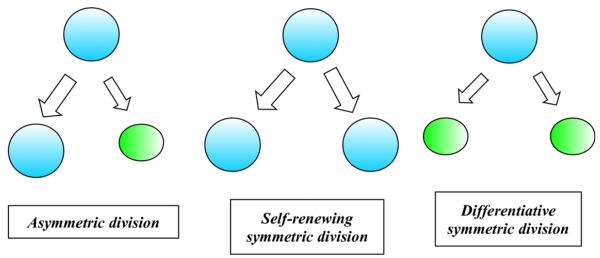
Let us begin by describing some biological features of stem cells that shape our birth–death process models. Two of the principal distinguishing features of stem cells are self-renewal and potency [48]. Self-renewal refers to the ability of a cell to indefinitely reproduce copies of itself at the same level of differentiation. In asymmetric cell division, a stem cell produces an identical daughter cell and a second more differentiated daughter cell. A stem cell can also divide symmetrically, generating two copies of itself in self-renewing symmetric division, or generating two partially differentiated daughter cells in differentiative symmetric division. Fig. 1 depicts the three modes of cell division.
Fig. 1.
Self-renewal capacity of stem cells.
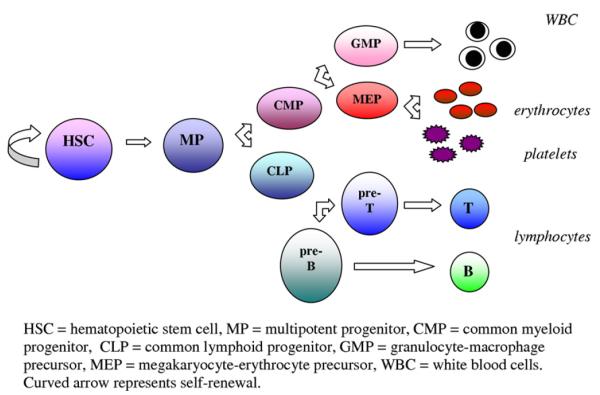
Potency is the capacity of a stem cell to replenish all of the highly specialized cells of a tissue. For instance, hematopoietic stem cells can give rise to a closely related family of cells that circulate in the blood. Fig. 2 illustrates the ability of the hematopoietic stem cell to generate multipotent progenitors, which then begin the process of differentiation, either into the myeloid lineage or the lymphoid lineage. The cells of the myeloid lineage carry oxygen to tissues (erythrocytes), help with clot formation (platelets), and fight acute infection (granulocytes), while the cells of the lymphoid lineage populate the immune system (B and T lymphocytes). It is noteworthy that progenitor cells do have the ability to self-renew, but only for a limited time. Only stem cells have the capacity for indefinite self-renewal. (see Fig. 3)
Fig. 2.
Multipotency of hematopoietic stem cells. Adapted from [7].
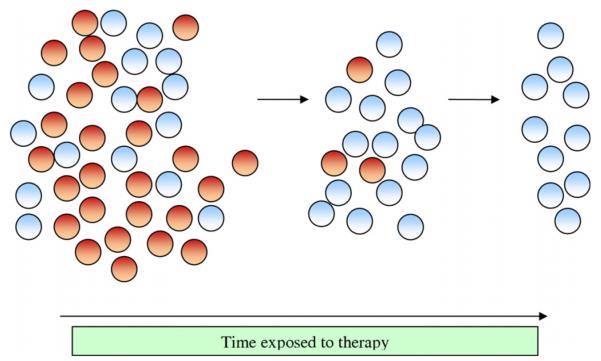
Fig. 3.
Selective destruction of cancer stem cells under targeted therapy.
Additional important features of stem cells include slow self-renewal and quiescence; these allow stem cells to maintain a long life span [48]. Different kinds of stem cells spend varying percentages of time in an actively dividing state and a quiescent (resting) state. For example, embryonic stem cells spend about 90% of the time in an actively dividing state, whereas hematopoietic stem cells are quiescent approximately 75% of the time [11]. Stem cells can enter the state of quiescence and later re-awaken.
3. Stem cell extinction times under therapy
In our simplified model of therapy, there are two populations of stem cells, normal stem cells and cancer stem cells. These coexisting populations do not interact. The cancer stem cells originate by a sequence of mutations from the normal stem cells. We take the existence of cancer stem cells as given and ignore repeated transitions to the cancer state. We model each population as a linear birth–death process Xt in continuous time t with constant birth rate β and constant death rate δ per particle. The process Xt counts the number of particles at time t.
Birth–death processes have been the subject of extensive study for many decades [18,28,31,39,40,42,45]. Some classic results that are useful to us are the mean and variance of the number of particles at time t starting with n particles at time 0 by time t
| (1) |
| (2) |
and the probability of extinction of a population starting with a single particle at time 0:
| (3) |
The major theme of this paper is the comparison of the times until extinction of the two stem cell populations. We now apply and refine the elementary results described above.
3.1. Extinction times with multiple clans
Suppose we start with n stem cells at time 0. If Ti denotes the time of extinction of the clan emanating from stem cell i, then we are interested in the time Mn = maxiTi at which all n clans go extinct. Assuming that each clan behaves independently as a linear birth–death process with parameters β and δ, the distribution of Mn is
where F(t) is given by Eq. (3). Fortunately, we can apply the asymptotic theory of extreme order statistics [20,36] to understand the distribution of Mn. The standard case of the theory says that there are two sequences of constants an and bn such that
| (4) |
for all t. The extreme value (Gumbel) distribution exp(−e−t) has mean γ and variance π2/6, where γ ≈ 0.57722 is the Euler–Mascheroni constant. The moment generating function of the extreme value distribution can be written for argument θ as
| (5) |
in terms of Euler’s gamma function. It is plausible that
and we will prove this later.
The key to finding the sequences an and bn is to identify a function R(t) such that
| (6) |
for all x. (See Theorem 14 of [20].) Once we have R(t) in hand, we determine an and bn via the equations and bn = R(an). In the current situation, R(t) is the constant (δ — β)−1. The equation
entails
which in turn implies
| (7) |
It follows that grows at the slow rate ln n and tends to the constant π2/[6(δ − β)2].
These conclusions are all predicated on satisfaction of condition (6). In view of Eq. (3), we have
This proves condition (6) and validates all of the conclusions drawn from it.
We can also solve for the time t that renders the extinction probability F(t)n equal to a given number p > 0. Since
we have
In view of the identity (3), the solution of the equation p = F(t)n therefore satisfies
| (8) |
This is precisely the approximation the extreme value theory entails.
As an illustration of our results, consider an advanced form of leukemia. We now have separate birth rates, death rates, and initial numbers of stem cells, which we subscript by the index H for healthy and C for cancerous, corresponding to the normal hematopoietic stem cell (HSC) and cancer stem cell (CSC) populations. Total initial hematopoietic stem cell population size (22,000) is based on numbers extrapolated from murine and feline data [1]. Because recent evidence suggests that HSCs divide approximately once every 42 weeks [1], we accordingly chose our birth rates βH = βC = 0.02 week−1.
The size of the CSC compartment can be highly variable across individuals and within an individual over time. For more aggressive malignancies, such as melanoma, higher proportions of cell functionally defined as CSCs are observed [56]. We begin with a large ratio of cancer stem cells to healthy stem cells to model an advanced phase of disease.
Birth rates of CSCs, βC, may vary for different tumors and may, in fact, vary over the course of disease [6,38]. In our models, we use the birth rate of normal hematopoietic stem cells [1] as a starting point. We make the assumption that birth rates are identical for healthy stem cells and leukemic stem cells. Although this assumption may not be realistic, we emphasize that our results are more dependent on the difference between birth and death rates than on the rates themselves.
Our death rates (δH and δC) reflect the range of rates and selectivities that might occur under a wide group of therapeutic agents. As new therapies targeting stem cells emerge, new death rates will be observed. Unfortunately, we do not have an estimate of killing rates of either healthy stem cells or cancer stem cells under therapy. These have not been observed. However, we do have an estimate of the normal death rate of healthy stem cells without therapy ~0.002 per cell per day [14,50]. This death rate was estimated for hematopoietic stem cells based on response to imatinib, which probably does not target leukemic stem cells. We hypothesize that the death rate of both CSCs and HSCs will be higher under therapy that is designed to target cancer stem cells, and our chosen death rate parameters reflect this assumption. Examples of therapies that have been shown to be effective in selectively targeting cancer stem cells in chronic leukemia include parthenolide in chronic myelogenous leukemia [37]. Antigen expression patterns, and hence susceptibility to therapy, may vary from patient to patient [19,37].
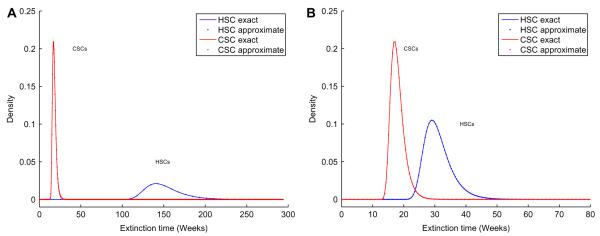
Suppose for the sake of argument, we start with nH = 4,400 and nC = 17,600 and take δH = 0.08 week−1 and δC = 0.59 week−1. Our asymptotic results allow us to examine the probability densities of the extinction times of both CSCs and HSCs. The top panel of Fig. 4 shows that the asymptotic probability density of the extinction time of CSCs has a narrow spike around 18 weeks, whereas that of HSCs has a narrow spike around 139 weeks. We observe good agreement between results obtained using the Gumbel approximation (dotted lines) and exact results (solid lines) obtained by differentiating the distribution function. There is very little overlap between the two extinction-time densities. This suggests that for the given parameter values, most likely the CSCs would be eradicated long before the HSCs become extinct. The appearance of these probability density curves confirms a wide therapeutic window of opportunity. However, when we take the death rates δH = 0.31 week−1 and δC = 0.59 week−1, the densities displayed in the bottom panel of Fig. 4) dangerously overlap.
Fig. 4.
Extinction time densities for CSCs and HSCs. Top: δC = 0.59 week−1, δH = 0.08 week−1. Bottom: δC = 0.59 week−1, δC = 0.31 week−1.
The weak ln n dependence of the sequence an on n suggests the possibility of safely eradicating CSCs even when they sharply out-number HSCs. In this regard, it is helpful to define the selectivity σ of a therapy as the ratio
of the differences between death and birth rates for CSCs versus HSCs. For safe eradication one needs σ to be substantially greater than ln nC/ln nH.
Passing back and forth between the formulas (3) and (9) allows us to plot the extinction probability for the HSCs at the time when the extinction probability for the CSCs reaches a predetermined level p. The survival probability of the HSC population increases fairly quickly as the difference between dH and dC grows. For example, take δH = 0.08 week−1 and βC = βH = 0.02 week−1. To be 80% certain that at least one ordinary stem cell remains when we are 99.9% certain no CSC remains, δC must be 0.15 week−1 or larger, corresponding to s ≥ 2.2.
3.2. Convergence of extinction time moments
The convergence in distribution displayed in Eq. (4) does not necessarily entail convergence of moments. We address this delicate question first for means. Our point of departure is the right-tail integral
for the mean of Mn. To gain insight into how this integral depends on n, we make the change of variables
| (9) |
The change of variables implies the change in differentials
| (10) |
and the range of integration (0, 1) for s. Since
it follows that
| (11) |
where γ enters the picture through the well-known expansion
of the harmonic sum [27], and
by virtue of the boundedness of 1/(δ − βs) on [0, 1]. Our formula for confirms the limit
We now validate a similar limit for the variance of the extinction times. Expressing the second moment as an integral of the right-tail probability and taking into account Eqs. (9) and (10) produce
| (12) |
We will attack the integral (12) in piecemeal fashion. For instance,
Fortunately, the two further helpful identities
are true [27]. It follows that
Another piece of the integral (12) is amenable to the fundamental theorem of calculus; namely,
The integral
because (δ − βs)−1 and ln (δ − βs) are bounded on [0, 1]. Likewise,
because
Two other parts of the integral partially cancel. The first part amounts to
The second part is
The sum of these two parts is
Because ln (1 + x) ≤ x for x > 0, it follows that
Putting together the various parts of the integral (12) and multiplying by give
In view of the asymptotic expression (11) for the mean, we have
which implies the convergence of the variance of to the variance of the Gumbel distribution.
3.3. How many HSCs remain when CSCs go extinct?
The single most important measure of success in therapy is the count of HSCs when the cancer stem cells go extinct. This is a difficult issue to attack mathematically because one must take a snapshot of the HSC population at a random stopping time. Let NH be the number of HSCs at the random time DC when the cancer stem cells are eradicated. This notation is consistent with the convention in this section of subscripting all quantities by either H and C to indicate the HSC population and the CSC population, respectively. To make progress, we make the simplifying assumption that the random variable
conforms exactly to the extreme value distribution. To recover the mean and variance of NH, we condition on DC in the formulas
| (13) |
| (14) |
Consider first the mean of NH. According to Eq. (1), we have
Thus, Eq. (13) shows that evaluation of boils down to evaluation of the moment generating function of DC. In view of Eq. (5), DC has moment generating function
| (15) |
A brief calculation now gives
To calculate the variance of NH from the decomposition (14), we note that Eq. (2) implies
Invoking the generating function (15) therefore yields
| (16) |
We handle the second term on the right of Eq. (14) by first noting that . We combine this with
to get
| (17) |
Eqs. (14), (16), and (17) fully determine .
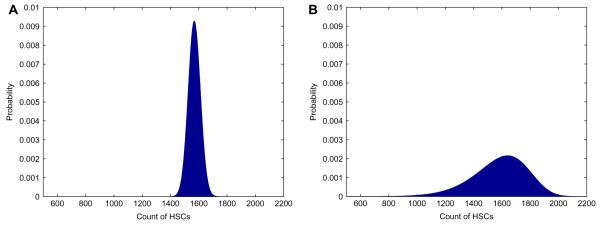
Let us define the killing efficiency κ of a therapy as the ratio of the death rate to birth rate of CSCs, κ = δC/βC. We can then formulate the mean number of HSCs present at the time when all the CSCs are eradicated as a function of the selectivity σ of a therapy and the killing efficiency, according to the formula
| (18) |
The variance can also be formulated as a function of κ and σ. Fig. 5 plots the average as a function of σ and κ. A higher selectivity entails a higher average number of HSCs at the time of eradication of the CSCs. For example, starting with nH = 4,400 and nC = 17,600, with a killing efficiency κ = 25, and a selectivity σ = 10 or greater, we expect 1,581 HSCs to survive. It is noteworthy that the selectivity required to ensure that, on average, 1,000 HSCs remain at the time of CSC extinction (σ = 10) is much higher than the selectivity required to be 80% sure that at least one HSC survives (σ = 2.2). Values of the average are heavily dominated by σ. Examination of Eq. (18) reveals that κ is less important in determining the average . In contrast, κ does play a large role in determining the average time to eradication of the CSCs. For instance with σ held constant at 10, the extinction time is approximately 4 years when κ = 3 and 18 weeks when κ = 25. The corresponding values for are 1,640 and 1,581.
Fig. 5.
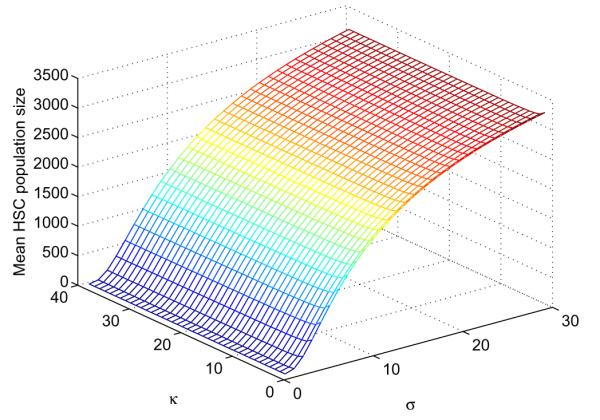
Dependence of on selectivity σ and killing efficiency κ of a therapy.
3.4. Eigenfunction expansions and finite Fourier transforms
Previous sections have dealt with means and variances. Finding the full distribution of the number of HSCs at the time of extinction of the CSCs requires new techniques. We explored two possibilities, eigenfunction expansions [39,35] and Fourier analysis [32,44,45]. Despite their elegance, eigenfunction expansions turn out to be far less reliable than approximations based on the finite Fourier transform. Indeed, the eigenfunction approximation to the distribution of NH suffers serious roundoff errors when NH is supported on a large number of points. The terms in the series are large and tend to alternate in sign. Fourier analysis offers a more numerically stable method of computing the distribution of NH. The Fourier approach applies generically to any probability generating function [32,44]. To extract the coefficients of P(s), extend it to the boundary of the unit circle in the complex plane via the equation , where . This creates a periodic function in t whose kth Fourier coefficient pk can be recovered via the finite Riemann sum
In practice, one evaluates this finite Fourier transform via the fast Fourier transform algorithm for some large power m of 2. For sufficiently large m, all of the coefficients p0, … , pm−1 can be computed accurately. Accuracy can be checked by comparing the numerically computed mean and variance of P(s) with its theoretical mean and variance.
To apply the Fourier method to find the distribution of NH, let GH(s, t) and GC(s, t) be the probability generating functions of the number of HSCs and CSCs at the fixed time t. Thus, the generating function of the number of normal stem cells at the random time when cancer stem cells are eradicated is given by
which can be numerically evaluated for any s, including s on the boundary of the unit circle. With this generating function at our disposal, we can retrieve the distribution of NH by the fast Fourier transform as just explained.
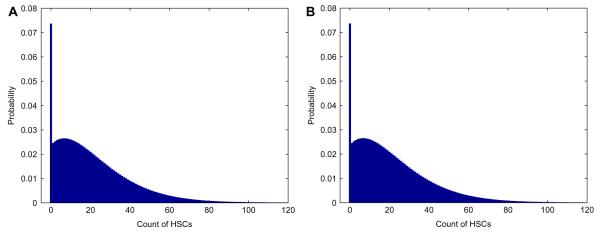
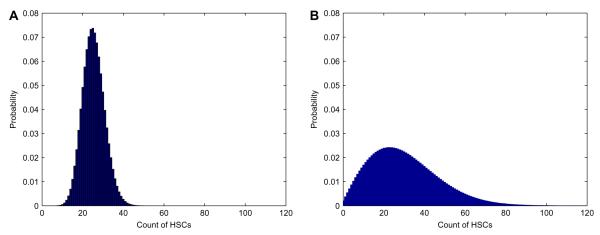
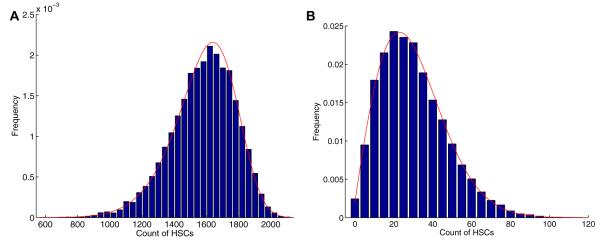
Fig. 6 shows the distribution of normal cells at the random time when cancer stem cells become extinct calculated by fast Fourier transform. The numerical means and variances from this distribution match those implied by formulas (13) and (14). The large spike at zero is caused by the amount of times the healthy population reaches extinction. Figs. 7 and 8 display the distributions of normal stem cells at fixed and random times under two typical parameter settings. As expected the distribution at a fixed time of CSC extinction is less variable than that generated with a random time. For the parameters chosen in Fig. 7, there appears to be an adequate number of HSCs at the time of CSC extinction, suggesting a safe therapy. By contrast, when we increase the death rate of HSCs (Fig. 8), we see that there is some chance that the HSCs will be wiped out by the time all CSCs have been eradicated.
Fig. 6.
The distribution of normal stem cells when cancer stem cells are eradicated based on the finite Fourier transform. The parameter setting is nH = 4,400, βH = 0.024 week−1, δH = 0.03 week−1, nC = 17,600, βC = 0.024 week−1, and δC = 0.036 week−1.
Fig. 7.
Distribution of HSCs when CSCs become extinct, assuming death rate of HSCs δH = 0.08 week−1. Initial clan sizes are nH = 4,400 and nC = 17,600, birth rates are βH = βC = 0.024 week−1, and death rate of CSCs δC = 0.59 week−1. Top: Distribution at the (fixed) mean cancer extinction time 18 weeks. Bottom: Distribution at the (random) cancer extinction time.
Fig. 8.
Distribution of HSCs when CSCs become extinct, assuming death rate of HSCs δH = 0.31 week−1. Initial clan sizes are nH = 4,400 and nC = 17,600, birth rates are βH = βC = 0.024 week−1, and death rate of CSCs δC = 0.59 week−1. Top: Distribution at the (fixed) mean cancer extinction time 18 weeks. Bottom: Distribution at the (random) cancer extinction time.
3.5. Therapy in the presence of quiescence
In the reversible state of quiescence, a stem cell does not divide. Here we consider therapies that target actively dividing stem cells and largely spare quiescent stem cells. In this case, we predict that the active cancer stem cell population will be eradicated first and leave behind a quiescent cancer stem cell population, which on awakening causes recurrence of the cancer. We now present a model that validates this intuition. The model therefore highlights the danger in targeting only active cancer stem cells. For the sake of simplicity, we ignore the slow flow of active stem cells into the resting state of quiescence. We will repair this defect in Section 3.6.
Let ν be the death rate per quiescent cancer stem cell, α be rate of awakening of a quiescent cancer stem cell, and G(t) be the probability that a quiescent cancer stem cell and all of its descendants have gone extinct by time t. As in the previous model, β and δ are the birth and death rates, respectively, per cell for the actively dividing cancer stem cells. We begin by deriving an expression for G(t). Considering the short time interval (0, s), it is clear that
where F(t) is the extinction probability by time t starting with a single active stem cell. Sending s to 0 leads to the differential equation
with solution
Given the identity
it follows that
| (19) |
In view of Eq. (3), we have
Substituting this in Eq. (19) produces
Further progress can be made by exploiting the expansion
in the integral
In conclusion, we find that
| (20) |
The explicit expression (20) allows us to determine the fate of a population of m cancer stem cells in quiescence. Consistent with our assumption that the killing rate δ of active cancer stem cells is much higher than the killing rate ν of quiescent cancer stem cells, we take α + ν < β − δ. In this regime, formula (20) can be replaced by the approximations
| (21) |
where c is the positive constant
Note that the error term o(1) in (21) tends to 0 exponentially fast as t tends to ∞.
The extinction time for the last surviving clan issuing from the m initial quiescent stem cells has distribution function Gm(t)= G(t)m. The asymptotic theory of extreme order statistics also applies to Gm(t). Once again we proceed by identifying a constant R such that
for all x. In light of the approximation (21), we have
and this ratio approaches e−x if and only if R = (α + ν)−1. Therefore, the previously cited extreme value theorem implies that
for sequences am and bm defined by
and bm = R = (α + ν)−1. Ignoring the error term o(1), we deduce that
The bottom line of this analysis is that the mean time to extinction for the m quiescent cancer stem cells is approximately
| (22) |
On the other hand, the mean extinction time for the n active cancer stem cells is
| (23) |
Our assumption α + ν < δ − β is equivalent to (δ − β)−1 < (α + ν)−1. Thus, unless n is much larger than m, the active cancer stem cells go extinct before the quiescent cancer stem cells. This is the opposite of what a viable therapy should achieve.
3.6. Distribution of HSCs in the presence of quiescence
Instead of ignoring flow into the quiescent state, one can incorporate it as part of a comprehensive branching process model [16]. We now briefly sketch this model. Consider a two-type branching process with quiescent cells as type 1 particles and active cells as type 2 particles. In addition to the notation of the previous section, let ϕ be the rate per cell of falling into quiescence. In a branching process, a particle reproduces at the time of its death. Let fij be the mean number of daughter particles of type j that a type i particle produces. Straightforward reasoning determines the reproduction matrix F = (fij) in our model as
Other key ingredients are the death rates per particle. These can be summarized by the vector ψ with components ψ1 = α + ν and ψ2 = ϕ + β + δ. These constructs determine a matrix M(t) whose typical entry mij(t) equals the mean number of particles of type j at time t starting with a single particle of type i at time 0. Again standard arguments show that M(t)= etΩ, where Ω = [ψi(fij − 1{i = j})]. Similar but more complicated reasoning yield the variance–covariance matrix of the particle counts starting from any initial configuration of particles [16].
To capture the full distribution of particle counts at a future time, it is convenient to introduce a bivariate generating function Pi(t, z) for the joint particle counts at time t starting from a single particle of type i at time 0. In our model, the backward differential equations for these two generating functions amount to
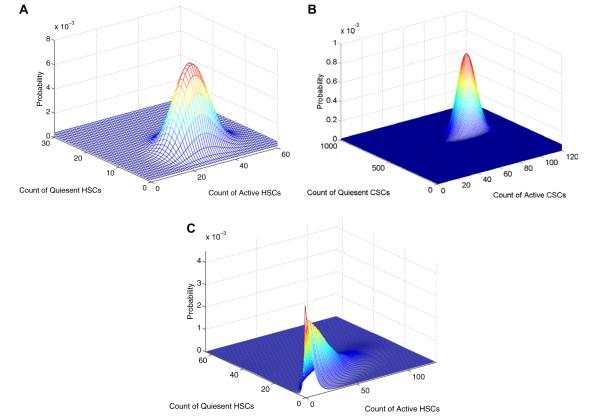
with initial condition Pi(0, z)= zi. The probability of extinction by time t equals P1(t, 0)n1 P2(t, 0)n2, where ni is the number of type i particles at time 0. Although it is impossible to solve for P1(t, z) and P2(t, z) analytically, it is certainly possible to solve for them numerically for any fixed value of z. This suggests retrieving the bivariate distributions via the 2D fast Fourier transform. In practice, this procedure works well and gives means and variances closely approximating the theoretical means and variances. Extension to the kind of random times we have stressed is feasible. Fig. 9 displays some typical results, for the parameter choices: βH = βC = 0.024 week−1, δC = 0.59 week−1, δH = 0.08 week−1, νH = νC = 0.00024 week−1, ϕC = ϕH = 0.007 week−1, and αC = αH = 0.07 week−1. Here we show the distribution of quiescent and active CSCs at the fixed mean extinction time of active CSCs, as estimated from Eq. (23), and the distribution of HSCs at the mean extinction time of quiescent CSCs, as estimated from Eq. (22). Finally, we show the distribution of HSCs at the random time of extinction of both quiescent and active CSCs.
Fig. 9.
Dynamics of quiescent and active HSCs and CSCs at fixed and random extinction times. Top: Distribution of HSCs remaining at the mean extinction time of quiescent CSCs (114 weeks). Middle: Distribution of CSCs at the mean extinction time of active CSCs (18 weeks). Bottom: Distribution of HSCs at the random time of CSC extinction.
4. Stochastic simulation
Because branching process models resist full mathematical analysis, progress depends on a variety of numerical tools. Unfortunately, as model complexity increases, all known deterministic numerical methods falter under the overwhelming computational loads. At this point simulation becomes an attractive alternative. Simulation has the further virtue of simplicity of implementation. Even when better tools are available, simulation promotes rapid testing of models and checking of approximate solutions. For these reasons, we now describe our experience with stochastic simulation in the stem cell model.
Recent advances in stochastic simulation are geared to the study of continuous-time Markov chains with a finite number of particle types, interacting via a finite number of reaction channels. While the methods first described by Gillespie [23,24] were rooted in applications to chemical reaction kinetics, particle-based stochastic simulation models have broad applications in fields as diverse as queuing theory, population dynamics, gene regulation, and biochemical networks [33,67]. The stochastic simulation algorithm (SSA) employs a wait and jump mechanism to simulate the behavior of a chain. Because it simulates every reaction, SSA can be annoyingly slow in models with large particle counts. The τ-leaping method [8,25] leaps over intermediate events by taking a fixed time step of length τ, chosen so that all reaction propensities (intensities) are relatively constant during the leap interval. At the end of the interval, each reaction channel fires a Poisson number of times with mean determined by the product of its propensity and τ. The τ-leaping method trades small losses in accuracy for much larger time steps. Our recent step anticipation leaping (SAL) method [60] generalizes τ-leaping by projecting linear and quadratic changes in reaction propensities. This promotes better accuracy without compromising speed. Here we employ the SAL method to explore stem cell dynamics in both the presence and absence of quiescence. The simulations substantiate our previous analytic and numerical results.
In a continuous-time Markov chain with a finite number of particle types, let Xt be the particle count vector at time t, rj be the propensity of reaction j, and ej be the increment to Xt caused by the firing of reaction j. The τ-leaping method runs an independent Poisson process for each reaction channel and sums the results over short time intervals. In ordinary τ-leaping, reaction channel j will fire rjτ times on average during (t, t + τ). One therefore updates the particle count vector Xt = x by the sum Xt+τ = x + ∑jNj∊j, where Nj are independent Poisson variates with means rjτ. In SAL, we expand each propensity to first order, replacing the constant intensity rj of ordinary τ-leaping by the linear intensity
Under this approximation, reactions of type j occur according to an inhomogeneous Poisson process during (t, t + τ), and the mean number of reactions is
This raises the question of how to calculate the derivative . The most natural route uses the chain rule
and sets
| (24) |
where is the increment to species k caused by reaction j. The reaction rate Eq. (24) models the mean behavior of the system when particle counts are high and stochastic fluctuations can be ignored. The following examples employ linear SAL. Quadratic extrapolation is possible, but the improvements over linear extrapolation are rather modest [60].
4.1. Empirical distribution of HSCs when CSCs go extinct
In our basic model without quiescence, there are 2 populations of cells and 4 reaction channels. The Markov chain Xt has component Xt1 counting the CSCs and component Xt2 counting the HSCs. Table 1 lists the reaction channels, propensities, and reaction increments. Here indicates the change in species k under reaction j. Any unspecified is assumed to be 0.
Table 1.
Simulation of CSCs and HSCs under therapy.
| Reaction | Propensity | Increment vector |
|---|---|---|
| CSC birth | βCx 1 | |
| CSC death | δCx 1 | |
| HSC birth | βHx 2 | |
| HSC death | δHx 2 |
Stochastic simulation allows us to explore the distribution of the number NH of HSCs at the random time of extinction of the CSCs; we simply record the number of HSCs when the CSC count reaches 0. Fig. 10 shows the distribution of NH over 10,000 SAL trials for the two values δH = 0.08 week−1 and δH = 0.31 week−1. The other reaction rates βC = βH = 0.024 week−1 and δC = 0.59 week−1 match our earlier choices.
Fig. 10.
Distribution of the number of HSCs at the random time of CSC extinction. Solid bars represent results obtained using stochastic simulation, while lines represent results obtained using finite Fourier transform. Top: δH = 0.08 week−1, σ = 10. Bottom: δH = 0.31 week−1, σ = 2.
These results highlight the dependence of NH on the selectivity σ of therapy. In the top panel of Fig. 10, with selectivity σ = 10, there is very little chance that the population of HSCs goes extinct before all CSCs are eradicated. By contrast, in the bottom panel of Fig. 10, with selectivity σ = 2, there is a good chance that HSCs go extinct before CSC eradication. The random variable NH has mean ± one standard deviation of 1,580 ± 198 for σ = 10 and 30.0 ± 17.1 for σ = 2. These results agree well with our analytic formulas and numerical results based on the finite Fourier transform.
4.2. Simulations in the presence of quiescence
When we introduce quiescence into the model, we have 4 populations of cells: active CSCs (type 1) and HSCs (type 2) and quiescent CSCs (type 3 or qCSC) and HSCs (type 4 or qHSC). Table 2 lists the reactions, propensities, and increment vectors of the extended model.
Table 2.
Simulation with quiescence and awakening.
| Reaction | Propensity | Increment vector |
|---|---|---|
| CSC birth | βCx 1 | |
| CSC death | δCx 1 | |
| CSC quiescence | ϕCx 1 | , |
| qCSC awakening | αCx 3 | , |
| qCSC death | νCx 3 | |
| HSC birth | βHx 2 | |
| HSC death | δHx 2 | |
| HSC quiescence | ϕHx 2 | , |
| qHSC awakening | αHx 4 | , |
| qHSC death | νHx 4 |
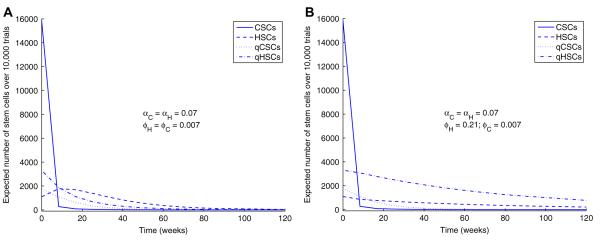
Because the deaths of quiescent cells, both qCSCs and qHSCs, are rare events, we set νC = νH = 0.00024 week−1. To deduce the relative rates of awakening and falling into quiescence, consider a simple 2-state Markov chain ignoring birth and death and modeling only the passage of a single stem cell back and forth between the active and quiescent states. This chain is reversible, and the principle of detailed balance identifies π = α/(ϕ + α) as the equilibrium fraction of active stem cells. Based on observations in adult mice that approximately 75% of long-term self-renewing hematopoietic stem cells are quiescent [11], and observations in patients with chronic myelogenous leukemia that 8.7% of CD34 cells are in a quiescent state [34], we take πH = 0.25 and πC = 0.9. While no data are available on rates of activation and quiescence of stem cells, we start with activation rates αH = αC = 0.07 week−1, and calculate the rates of quiescence ϕH = 0.21 week−1 and ϕC = 0.007 week−1 using the detailed balance condition. Given a total stem cell population size of 22,000 [1], we again start with a large proportion (80%) of CSCs: nH = 4,400 HSCs and nC = 17,600 CSCs. Based on the above proportions of quiescent and active HSCs and CSCs, the initial value X0 = x has components x1 = 15,840, x2 = 1,100, x3 = 1,760, and x4 = 3,300.
We will consider two cases. The first assumes a slow backflow to quiescence (ϕC = ϕH = 0.007 week−1). This scenario may be more realistic as quiescence is most likely regulated by similar mechanisms for both types of cells, and healthy stem cells might be expected to spend more time in an active state during malignancy. The second scenario is less likely and assumes that the CSCs and HSCs have reached two different equilibrium distributions. Here the backflow of quiescence is slow for CSCs (ϕC = 0.007 week−1) and fast for HSCs (ϕH = 0.21 week−1). We use our previous birth rates βH = βC = 0.024 week−1 and death rates δC = 0.59 week−1 and δH = 0.08 week−1.
Following the trajectories of the 4 populations of stem cells over time in Fig. 11, we see it takes a much longer time for the CSCs to go extinct when quiescence is involved (t = 40 weeks). When the backflow to quiescence is much slower for CSCs (ϕC = 0.007 week−1; ϕH = 0.21 week−1), there is still an adequate number of HSCs at the time of extinction of the CSCs, approximately 590 (124 active and 466 quiescent), though far fewer than if therapy were to target quiescent CSCs. However, when backflow to quiescence is slow for both CSCs and HSCs, ϕC = ϕH = 0.007 week−1, by the time all CSCs are finally eradicated, there are only approximately 18 HSCs (13 active and 5 quiescent). In the second scenario, quiescence serves as a sanctuary for the HSCs. The first scenario agrees with the analytic results of our modeling described in Section 3.5 and emphasizes the need for therapy to target both active and quiescent CSCs. The second scenario hints at greater subtlety and emphasizes the need for accurate measurement of all parameters.
Fig. 11.
Trajectories of active and quiescent stem cell populations. Top: Same quiescence rates for CSCs and HSCs. Bottom: Quiescence rate for HSCs ≫ quiescence rate for CSCs.
5. Conclusions
Cancer therapy based on eradicating CSCs is admittedly speculative. However, given the toll of mortality and morbidity exacted by cancer, this is a strategy worth considering in detail. Mathematical models can guide the rational design of drugs and treatments. Of course, model predictions will have to be checked by animal experiments and careful analysis of patient outcomes. Premature trials with poor outcomes can sour the prospects of even a good therapy. Our findings are cause for guarded optimism. We have shown that the relative numbers of CSCs and HSCs at the time of initiating therapy are less relevant than the selectivity of therapy. Modeling stem cell population dynamics as a birth–death process permits characterization of the extinction times for active and quiescent stem cells and calculation of the distribution of the number of HSCs at the time of eradication of CSCs. We anticipate that comparing in vitro killing rates of CSCs and HSCs will be useful in screening targeted therapies. How applicable the models will be depends on underlying parameters such as absolute quantities of stem cells, death rates of HSCs and CSCs, and relative rates of quiescence and awakening. These parameters will doubtless vary for different tumor types and stem cell populations.
Therapies proposed to target cancer stem cells operate via several different molecular mechanisms (see Table 3). For leukemic stem cells, there are small molecule targeted biologic therapies, antibody-based and immune-mediated therapies, and stem cell microenvironment targeted therapies [29,37,53,63]. DMAPT offers an example of a small molecule potentially useful in therapy; DMAPT is a parthenolide derivative that selectively eliminates leukemic stem cells and spares normal hematopoietic stem cells. The half maximal inhibitory concentration for normal stem cells under DMAPT is 10 times higher than that for leukemic stem cells. Therapies that inhibit the PI3K/PTEN/Akt pathway, which regulates growth and apoptosis of stem cells, work more efficiently in leukemic stem cells than in normal hematopoietic stem cells [30,69,70]. Dasatinib, a small molecule inhibitor of BCR-ABL, targets leukemic stem, progenitor, and differentiated cells in chronic myelogenous leukemia, but does not target the corresponding quiescent populations [12]. Antibody-based therapies inhibit the homing of the LSC to its niche (anti-CD44), activate innate immunity by targeting IL-3 (anti-CD23), and inhibit intracellular signaling. Immune-mediated cell killing is also being proposed as a mechanism to target leukemic stem cells. CD47 is an antigen expressed on leukemic stem cells which binds to a signal-regulatory protein on macrophages and stops the ingestion of the leukemic stem cells by the macrophages [47]. An antibody to CD47 is being developed to block its interaction with macrophages, facilitating activation of phagocytes. An important property of stem cells is niche-dependence [48]. Stem cell niches, distributed throughout the body, serve to regulate the total number of stem cells and whether or not stem cells maintain an undifferentiated state. Therapies that target the microenvironment are predicated on the assumptions that niche regulation is aberrant in cancer and targeting niche regulation will inhibit the abnormally activated pathways. It remains to be seen whether niche targeting will be selective for cancer stem cells. Future models should include simulation of stem cell-niche interactions.
Table 3.
Proposed therapies targeting leukemic stem cells.
| Type | Example | Mechanism |
|---|---|---|
| Small molecule therapies | DMAPT | induces differentiation and apoptosis |
| MG-132 | proteasome inhibitor | |
| ABT-737 | bcl-2 inhibitor, regulates apoptosis |
|
| PI3K/PTEN/Akt | regulates growth and apoptosis |
|
| inhibitor | ||
| Dasatinib | inhibitor of BCR-ABL | |
| Antibody-based therapies | Diphtheria- toxin-IL-3 fusion protein |
inhibit intracellular signaling |
| anti-CXCR4 | mediates SDF-1 interaction | |
| anti-CD44 | inhibit homing of LSC to its niche |
|
| anti-CD23 | activate innate immunity | |
| anti-CD47 | immune-mediated cell killing |
|
|
Therapies targeting the
microenvironment |
γ-secretase inhibitor |
inhibit self-renewal |
| PI3K inhibitor anti-VEGF therapy |
block prosurvival signaling target hypoxic milieu |
Other proposed cancer stem cell therapies work by inducing differentiation. The tremendous potential for cure by combining differentiating agents with chemotherapy has been demonstrated in acute myelogenous leukemia with all-trans retinoic acid. In our models we consider symmetric division leading to two differentiated cells as a type of stem cell death.
We find that selectivity is an important determinant of the safety of a proposed therapy. In contrast, killing efficiency is important in determining the appropriate duration of therapy needed to drive a cancer stem cell population extinct. Both of these measures are heavily dependent on the difference between birth and death rates of a stem cell population, rather than on the birth or death rate alone. It is possible that the symmetric birth rate of cancer stem cells is much higher than that of healthy hematopoietic stem cells. For example, the regulation of asymmetric stem cell division may be disturbed during the process of carcinogenesis [10]. Because our models focus on the importance of the difference between birth and death rates, we make the simplifying assumption that the birth rates for the HSC and CSC populations are the same and simply vary death rates. If the amount of time spent by CSCs in self-renewing symmetric division were found to be substantially higher than that for HSC, the death rate of CSCs under a proposed therapy would need to be that much higher to obtain the same selectivity.
Cancer modeling is becoming more of a preoccupation for applied mathematicians. The variety of approaches is impressive. These range from continuum mechanics models of tumor growth to reaction–diffusion models of tumor vascularization and optimization of radiation doses in radiation therapy [3,9,22,62]. Branching processes and continuous-time Markov chain models have long provided quantitative insights into the dynamics of cancer initiation and proliferation [42,45]. Our stem cell models continue in this tradition. In stem cell dynamics, the population of HSCs is critically small, and their chance elimination has devastating consequences. This sober fact highlights the importance of tight control over killing differentials. Stochastic models of drug resistance of stem cells have also been explored [26,43,50]. Here modeling mutation is crucial. Further research is surely merited on the mutational pathways leading to cancer, the genetic instability of cancer stem cells, the development of resistance mutations during therapy, and the role of the stem cell niche in regulating stem cell and progenitor expansion.
We predict that stochastic simulation methods will play an increasing role in the development of more sophisticated cancer models. Stochastic simulation is ideal for studying complex systems with multiple cellular species tied together by multiple reaction channels. We have modeled sensitivity to therapy by varying death rates. To capture the role of the stem cell niche, one could assign CSCs that escape niche regulation higher birth rates or higher rates of awakening from quiescence. We have omitted progenitor cells and partially and fully differentiated cells from our models. Adding all of the complications requires flexible modeling tools. Multitype branching processes can take us only so far. As soon as the different cell types begin to interact, the branching process paradigm breaks down. This should not mean the abandonment of stochastic models, but it does put a premium on the development of faster, more accurate, and more convenient implementations of stochastic simulation. These urgent needs and the burgeoning of systems biology as a whole will drive the field of stochastic simulation.
In conclusion, mathematical modeling and the development of rational stem cell therapy will go hand in hand. The current stem cell models give us hope that attacking CSCs can cure cancer. To be successful, targeted therapies must be tuned to spare HSCs and eradicate quiescent as well as active CSCs. This second criterion rules out drugs that solely attack dividing cells. Only stochastic models can capture the extinction and small numbers phenomena connected with stem cells. These models will ultimately provide the same extraordinary insight into cancer therapy responses and resistance that they have in HIV treatment [15]. If we are fortunate, models of the two diseases will cross fertilize each other for years to come.
Acknowledgements
The authors thank Dr. Elliot Landaw, Dr. Van Savage, and Lindsay Riley for helpful comments and suggestions on this manuscript. This research was supported in part by USPHS grants GM53275 and MH59490, and by a Young Investigator Award from the American Society of Clinical Oncology.
References
- [1].Abkowitz JL, Catlin SN, McCallie MT, Guttorp P. Evidence that the number of hematopoietic stem cells per animal is conserved in mammals. Blood. 2002;100:2665. doi: 10.1182/blood-2002-03-0822. [DOI] [PubMed] [Google Scholar]
- [2].Al-Hajj M, Wicha MS, Benito-Hernandez A, et al. Prospective identification of tumorigenic breast cancer cells. Proc. Natl. Acad. Sci. USA. 2003;100:3983. doi: 10.1073/pnas.0530291100. [DOI] [PMC free article] [PubMed] [Google Scholar]
- [3].Ambrosi D, Mollicab F. On the mechanics of a growing tumor. Int. J. Eng. Sci. 2002;40:1297. [Google Scholar]
- [4].Bao S, Wu Q, McLendon RE, et al. Glioma stem cells promote radioresistance by preferential activation of the DNA damage response. Nature. 2006;444:756. doi: 10.1038/nature05236. [DOI] [PubMed] [Google Scholar]
- [5].Bao S. Targeting cancer stem cells through L1CAM suppresses glioma growth. Cancer Res. 2008;68:6043. doi: 10.1158/0008-5472.CAN-08-1079. [DOI] [PMC free article] [PubMed] [Google Scholar]
- [6].Bonnet D, Dick JE. Human acute myeloid leukemia is organized as a hierarchy that originates from a primitive hematopoietic cell. Nat. Med. 1997;3:730. doi: 10.1038/nm0797-730. [DOI] [PubMed] [Google Scholar]
- [7].Butler E, Lichtman MA, Coller BS, Kipps TJ, Seligsohn U. Williams Hematology. Sixth ed McGraw-Hill; New York: 2001. [Google Scholar]
- [8].Cao Y, Gillespie DT, Petzold LR. Efficient step size selection for the tau-leaping simulation method. J. Chem. Phys. 2006;124:1. doi: 10.1063/1.2159468. [DOI] [PubMed] [Google Scholar]
- [9].Casciari JJ, Sotirchos SV, Sutherland RM. Variations in tumor cell growth rates and metabolism with oxygen concentration, glucose concentration, and extracellular pH. J. Cell. Physiol. 1992;151:386. doi: 10.1002/jcp.1041510220. [DOI] [PubMed] [Google Scholar]
- [10].Caussinus E, Gonzalez C. Induction of tumour growth by altered stem-cell asymmetric division in Drosophila melanogaster. Nat. Genet. 2005;37:1125. doi: 10.1038/ng1632. [DOI] [PubMed] [Google Scholar]
- [11].Cheshier SH, Morrison SJ, Liao X, Weissman IL. In vivo proliferation and cell cycle kinetics of long-term self-renewing hematopoietic stem cells. Proc. Natl. Acad. Sci. USA. 1999;96:3120. doi: 10.1073/pnas.96.6.3120. [DOI] [PMC free article] [PubMed] [Google Scholar]
- [12].Copland M, Hamilton A, Elrick LJ, et al. Dasatinib (BMS-354825) targets an earlier progenitor population than imatinib in primary CML but does not eliminate the quiescent fraction. Neoplasia. 2006;107:4532. doi: 10.1182/blood-2005-07-2947. [DOI] [PubMed] [Google Scholar]
- [13].Cox CV, Everly RS, Oakhill A, et al. Characterization of acute lymphoblastic leukemia progenitor cells. Blood. 2004;104:2919. doi: 10.1182/blood-2004-03-0901. [DOI] [PubMed] [Google Scholar]
- [14].Dingli D, Michor F. Successful therapy must eradicate cancer stem cells. Stem Cells. 2006;24:2603. doi: 10.1634/stemcells.2006-0136. [DOI] [PubMed] [Google Scholar]
- [15].Dorman KS, Kaplan AH, Lange KL, Sinsheimer JS. Mutation takes no vacation: can structured treatment interruptions increase the risk of drug-resistant HIV-1? J Acquir. Immune Defic. Syndr. 2000;25:398. doi: 10.1097/00042560-200012150-00003. [DOI] [PubMed] [Google Scholar]
- [16].Dorman K, Sinsheimer JS, Lange K. In the garden of branching processes. SIAM Rev. 2004;46:222. [Google Scholar]
- [17].Eckfeldt CE, Mendenhall EM, Verfaillie CM. The molecular repertoire of the ‘almighty’ stem cell. Nat. Rev. Mol. Cell. Bio. 2005;6:726. doi: 10.1038/nrm1713. [DOI] [PubMed] [Google Scholar]
- [18].Feller W. An Introduction to Probability Theory and Its Applications. John Wiley & Sons, Inc.; New York: 1968. [Google Scholar]
- [19].Feller N, van der Pol MA, van Stijn A, et al. MRD parameters using immunophenotypic detection methods are highly reliable in predicting survival in acute myeloid leukemia. Leukemia. 2004;18:1380. doi: 10.1038/sj.leu.2403405. [DOI] [PubMed] [Google Scholar]
- [20].Ferguson TS. A Course in Large Sample Theory. Chapman & Hall/CRC; New York: 1996. [Google Scholar]
- [21].Fialkow PJ, Jacobson RJ, Papayannopoulou T. Chronic myelocytic leukemia: clonal origin in a stem cell common to the granulocyte, erythrocyte, platelet and monocyte/macrophage. Am. J. Med. 1977;63:125. doi: 10.1016/0002-9343(77)90124-3. [DOI] [PubMed] [Google Scholar]
- [22].Gatenby RA, Gawlinski ET. A reaction–diffusion model of cancer invasion. Cancer Res. 1996;56:5745. [PubMed] [Google Scholar]
- [23].Gillespie DT. A general method for numerically simulating the stochastic time evolution of coupled chemical reactions. J. Comput. Phys. 1976;22:403. [Google Scholar]
- [24].Gillespie DT. Exact stochastic simulation of coupled chemical reactions. J. Phys. Chem. 1977;81:2340. [Google Scholar]
- [25].Gillespie DT. Approximate accelerated stochastic simulation of chemically reacting systems. J. Chem. Phys. 2001;115:1716. [Google Scholar]
- [26].Goldie JH, Coldman AJ. Quantitative model for multiple levels of drug resistance in clinical tumors. Cancer Treat Rep. 1983;67:923. [PubMed] [Google Scholar]
- [27].Graham RL, Knuth DE, Patashnik O. Concrete Mathematics. Addison-Wesley Publishing Company; Menlo Park, CA: 1989. [Google Scholar]
- [28].Grimmett GR, Stirzaker DR. Probability and Random Processes. Clarendon Press; Oxford: 1992. [Google Scholar]
- [29].Guzman ML, Rossi RM, Karnischky L. The sesquiterpene lactone parthenolide induces apoptosis of human acute myelogenous leukemia stem and progenitor cells. Blood. 2005;105:4163. doi: 10.1182/blood-2004-10-4135. [DOI] [PMC free article] [PubMed] [Google Scholar]
- [30].Guzman ML, Neering SJ, Upchurch D, et al. Nuclear factor-kappaB is constitutively activated in primitive human acute myelogenous leukemia cells. Blood. 2001;98:2301. doi: 10.1182/blood.v98.8.2301. [DOI] [PubMed] [Google Scholar]
- [31].Harris TE. The Theory of Branching Processes. Dover Publications, Inc.; New York: 1989. [Google Scholar]
- [32].Henrici P. Fast Fourier methods in computational complex analysis. SIAM Rev. 1979;21:481. [Google Scholar]
- [33].Higham DJ. Modeling and simulating chemical reactions. SIAM Rev. 2008;50:347. [Google Scholar]
- [34].Holyoake TL, Jiang X, Jorgensen HG, et al. Primitive quiescent leukemic cells from patients with chronic myeloid leukemia spontaneously initiate factor-independent growth in vitro in association with up-regulation of expression of interleukin-3. Blood. 2001;97:720. doi: 10.1182/blood.v97.3.720. [DOI] [PubMed] [Google Scholar]
- [35].Ismail MEH, Letessier J, Valent G. Birth and death processes with absorption. Internat. J Math. Math. Sci. 1992;15:469. [Google Scholar]
- [36].Jagers P, Klebaner FC, Sagitov S. On the path to extinction. Proc. Nat. Acad. Sci. 2007;104:6107. doi: 10.1073/pnas.0610816104. [DOI] [PMC free article] [PubMed] [Google Scholar]
- [37].Jordan CT. Can we finally target the leukemic stem cells? Best Pract Res. Clin. Haematol. 2008;21:615. doi: 10.1016/j.beha.2008.07.006. [DOI] [PMC free article] [PubMed] [Google Scholar]
- [38].Rosen JM, Jordan CT. The increasing complexity of the stem cell paradigm. Science. 2009;324:1670. doi: 10.1126/science.1171837. [DOI] [PMC free article] [PubMed] [Google Scholar]
- [39].Karlin S, McGregor J. Linear growth birth and death processes. J. Math. Mech. 1958;7:643. [Google Scholar]
- [40].Karlin S, Taylor H. A First Course in Stochastic Processes. Elsevier; San Diego: 1975. [Google Scholar]
- [41].Kavalerchik E, Goff D, Jamieson CHM. Chronic myeloid leukemia stem cells. J. Clin. Oncol. 2008;26:2911. doi: 10.1200/JCO.2008.17.5745. [DOI] [PubMed] [Google Scholar]
- [42].Kimmel M, Axelrod DE. Branching Processes in Biology. Springer-Verlag; New York: 2002. [Google Scholar]
- [43].Komarova NL, Wodarz D. Drug resistance in cancer: principles of emergence and prevention. Proc. Natl. Acad. Sci. USA. 2005;102:9714. doi: 10.1073/pnas.0501870102. [DOI] [PMC free article] [PubMed] [Google Scholar]
- [44].Lange KL. Numerical Analysis for Statisticians. Springer-Verlag; New York: 1999. [Google Scholar]
- [45].Lange KL. Applied Probability. Springer-Verlag; New York: 2003. [Google Scholar]
- [46].Lapidot T, Sirard C, Vormoor J, et al. A cell initiating human acute myeloid leukaemia after transplantation into SCID mice. Nature. 1994;367:645. doi: 10.1038/367645a0. [DOI] [PubMed] [Google Scholar]
- [47].Majeti R, Chao MP, Alizadeh AA, et al. CD47 is an adverse prognostic factor and therapeutic antibody target on human acute myeloid leukemia stem cells. Cell. 2009;138:286. doi: 10.1016/j.cell.2009.05.045. [DOI] [PMC free article] [PubMed] [Google Scholar]
- [48].Martinez-Agosto JA, Mikkola HKA, Hartenstein V, Banerjee U. The hematopoietic stem cell and its niche: a comparative view. Genes Dev. 2007;21:3044. doi: 10.1101/gad.1602607. [DOI] [PubMed] [Google Scholar]
- [49].Matsui W, Hugg CA, Wang Q, et al. Characterization of clonogenic multiple myeloma cells. Blood. 2004;103:2332. doi: 10.1182/blood-2003-09-3064. [DOI] [PMC free article] [PubMed] [Google Scholar]
- [50].Michor F, Hughes TP, Iwasa Y, Branford S, Shah NP, Sawyers CL, Nowak MA. Dynamics of chronic myeloid leukaemia. Nature. 2005;435:1267. doi: 10.1038/nature03669. [DOI] [PubMed] [Google Scholar]
- [51].Morrison SJ, Kimble J. Asymmetric and symmetric stem-cell divisions in development and cancer. Nature. 2006;441:1068. doi: 10.1038/nature04956. [DOI] [PubMed] [Google Scholar]
- [52].O’Brien CA, Pollett A, Gallinger S, et al. A human colon cancer cell capable of initiating tumour growth in immunodeficient mice. Nature. 2007;445:106. doi: 10.1038/nature05372. [DOI] [PubMed] [Google Scholar]
- [53].Okamoto OK, Perez JF. Targeting cancer stem cells with monoclonal antibodies: a new perspective in cancer therapy and diagnosis. Expert Rev. Mol. Diagn. 2008;8:387. doi: 10.1586/14737159.8.4.387. [DOI] [PubMed] [Google Scholar]
- [54].Pardal R, Clarke MF, Morrison SJ. Applying the principles of stem-cell biology to cancer. Nat. Rev. Cancer. 2003;3:895. doi: 10.1038/nrc1232. [DOI] [PubMed] [Google Scholar]
- [55].Prince ME, Sivanandan R, Kaczorowski A, et al. Identification of a subpopulation of cells with cancer stem cell properties in head and neck squamous cell carcinoma. Proc. Natl. Acad. Sci. USA. 2007;104:973. doi: 10.1073/pnas.0610117104. [DOI] [PMC free article] [PubMed] [Google Scholar]
- [56].Quintana E, Shackleton M, Sabel MS, Fullen DR, Johnson TM, Morrison SJ. Efficient tumour formation by single human melanoma cells. 2008. p. 593. [DOI] [PMC free article] [PubMed]
- [57].Reya T, Morrison SJ, Clarke MF, Weissman IL. Stem cells, cancer, and cancer stem cells. Nature. 2001;414:105. doi: 10.1038/35102167. [DOI] [PubMed] [Google Scholar]
- [58].Ruzankina Y, Pinzon-Guzman C, Asare A, et al. Deletion of the developmentally essential gene ATR in adult mice leads to age-related phenotypes and stem cell loss. Cell Stem Cell. 2007;1:113. doi: 10.1016/j.stem.2007.03.002. [DOI] [PMC free article] [PubMed] [Google Scholar]
- [59].Schatton T, Murphy GF, Frank NY, et al. Identification of cells initiation human melanomas. Nature. 2008;451:345. doi: 10.1038/nature06489. [DOI] [PMC free article] [PubMed] [Google Scholar]
- [60].Sehl ME, Alekseyenko AL, Lange KL. Accurate stochastic simulation via the step anticipation τ-leaping (SAL) algorithm. J. Comput. Biol. 2009;16:1195. doi: 10.1089/cmb.2008.0249. [DOI] [PMC free article] [PubMed] [Google Scholar]
- [61].Sehl ME, Sinsheimer JS, Zhou H, Lange KL. Differential destruction of stem cells: implications for targeted cancer stem cell therapy. Cancer Res. 2009;69:9481. doi: 10.1158/0008-5472.CAN-09-2070. [DOI] [PMC free article] [PubMed] [Google Scholar]
- [62].Shepard DM, Ferris MC, Olivera GH, Mackie TR. Optimizing the delivery of radiation therapy to cancer patients. SIAM Rev. 1999;41:721. [Google Scholar]
- [63].Shih I, Wang T. Notch signaling, γ-secretase inhibitors, and cancer therapy. Cancer Res. 2007;67:1879. doi: 10.1158/0008-5472.CAN-06-3958. [DOI] [PubMed] [Google Scholar]
- [64].Singh SK, Hawkins C, Clarke ID, et al. Identification of human brain tumour initiating cells. Nature. 2004;432:396. doi: 10.1038/nature03128. [DOI] [PubMed] [Google Scholar]
- [65].Suva M, Riggi N, Stehle J, et al. Identification of cancer stem cells in Ewing’s sarcoma. Cancer Res. 2009;69:1776. doi: 10.1158/0008-5472.CAN-08-2242. [DOI] [PubMed] [Google Scholar]
- [66].Wicha MS, Liu S, Dontu G. Cancer stem cells: an old idea – a paradigm shift. Cancer Res. 2006;66:1883. doi: 10.1158/0008-5472.CAN-05-3153. [DOI] [PubMed] [Google Scholar]
- [67].Wilkinson DJ. Stochastic Modelling for Systems Biology. Chapman & Hall/CRC; Boca Raton, FL: 2006. [Google Scholar]
- [68].Xin L, Lawson DA, Witte ON. The Sca-1 cell surface marker enriches for a prostate-regenerating cell sub-population that can initiate prostate tumorigenesis. Proc. Natl. Acad. Sci. USA. 2005;102:6942. doi: 10.1073/pnas.0502320102. [DOI] [PMC free article] [PubMed] [Google Scholar]
- [69].Xu Q, Simpson SE, Scialla TJ, Bagg A, Carroll M. Survival of acute myeloid leukemia cells requires PI3 kinase activation. Blood. 2003;102:972. doi: 10.1182/blood-2002-11-3429. [DOI] [PubMed] [Google Scholar]
- [70].Yilmaz OH, Valdez R, Theisen BK, Guo W, Ferguson DO, Wu H, Morrison SJ. Pten dependence distinguishes haematopoietic stem cells from leukaemia-initiating cells. Nature. 2006;441:475. doi: 10.1038/nature04703. [DOI] [PubMed] [Google Scholar]
- [71].Yilmaz OH, Morrison SJ. The PI-3kinase pathway in hematopoietic stem cells and leukemia-initiating cells: a mechanistic difference between normal and cancer stem cells. Blood Cells Mol. Dis. 2008;41:73. doi: 10.1016/j.bcmd.2008.02.004. [DOI] [PMC free article] [PubMed] [Google Scholar]


