Abstract
Background:
Registration of high-resolution tissue images is a critical step in the 3D analysis of protein expression. Because the distance between images (~4-5μm thickness of a tissue section) is nearly the size of the objects of interest (~10-20μm cancer cell nucleus), a given object is often not present in both of two adjacent images. Without consistent correspondence of objects between images, registration becomes a difficult task. This work assesses the feasibility of current registration techniques for such images.
Methods:
We generated high resolution synthetic 3-D image data sets emulating the constraints in real data. We applied multiple registration methods to the synthetic image data sets and assessed the registration performance of three techniques (i.e., mutual information (MI), kernel density estimate (KDE) method [1], and principal component analysis (PCA)) at various slice thicknesses (with increments of 1μm) in order to quantify the limitations of each method.
Results:
Our analysis shows that PCA, when combined with the KDE method based on nuclei centers, aligns images corresponding to 5μm thick sections with acceptable accuracy. We also note that registration error increases rapidly with increasing distance between images, and that the choice of feature points which are conserved between slices improves performance.
Conclusions:
We used simulation to help select appropriate features and methods for image registration by estimating best-case-scenario errors for given data constraints in histological images. The results of this study suggest that much of the difficulty of stained tissue registration can be reduced to the problem of accurately identifying feature points, such as the center of nuclei.
Keywords: 3-D Tissue Image Registration, Cancer Heterogeneity Analysis, Tissue Image Processing, Kernel Density
INTRODUCTION AND BACKGROUND
Tumor heterogeneity and the existence of rare foci are common problems hampering cancer diagnosis, prognosis, and treatment planning.[2] Molecular diagnosis of cancer involves identification and development of biomarker tests to understand the heterogeneity. In typical biomarker analysis procedures, an assay of stains interrogates the tissue for the presence of biomarkers, such as protein expression via immunohistochemistry. In a two-dimensional histological section, only a slice of the tumor microenvironment is visible. 3D confocal monitoring of breast cancer cell lines has revealed important features of temporal-spatial organization of solid tumors.[3] To understand the micro diversity of malignant cells in a tumor micro-environment, multiplexed quantum dot (QD) stains have recently been used to isolate and differentiate heterogeneous cancer cells in situ in thin slices of tissue.[4]
Combining QD-stained adjacent slices to create a 3D representation may give pathologists better insight into tumor composition and progression at the cellular level. For instance, analyzing the biomarker distribution along with cellular morphology of prostate acini[5] in 3D may help clinicians make a better prostate cancer diagnosis. However, precise alignment (registration) of 2D histological entities is required for 3D reconstruction. Some works have proposed histological image registration techniques, but mostly in a multimodal context.[6,7] Other works on histological image registration,[8,9] pertain to whole slide microscopy images at relatively low resolution. Registration of very small histological entities (cells, nuclei) images, acquired from adjacent sections, remains largely an open problem. Several issues make the registration task difficult at high resolution (<0.2 μm/pixel). First, at the micrometer scale of histological entities, it is not feasible to introduce fiduciary markers for subsequent image registration, whereas fiduciary markers are used for whole slide images.[10] Secondly, because the nuclei diameter in cancerous cells may lie in the range of 10-20 μm,[11] small cells and nuclei may not be traced throughout the entire longitudinal dimension of the tissue. As a result, there is inherent lack of correspondences between images due to cells “appearing” or “disappearing” between adjacent sections [Figure 1].
Figure 1.
(a-b) Sample images for two adjacent slices stained with quantum dots. Note the ambiguity in correspondences in the two marked regions; (c) DAPI stained image corresponding to (b); (d) QD stained slice 25μm (5 sections) apart from slice (b). Note the change in acini shape between (b) and (d)
In this work, we analyze the problem of high-resolution tissue image registration via synthetic data simulations. We model image data corresponding to a single prostate acinus and evaluate the performance of various registration techniques. We simulate the registration process using both intensity-based and feature-based methods. For the intensity-based method, we use mutual information (MI) since several works have successfully demonstrated its effectiveness for registration of medical images.[9,12] We use two feature-based registration techniques. The first technique is based on the kernel density estimate (KDE) of feature points and has been proposed for registration of point sets with noise and outliers.[1] The second technique, based on principal component analysis (PCA), has also been used for image registration.[13] Our analysis is important for two main reasons. First, the difficulty of the problem leads to an absence of a reliable ground truth, even for manually registered images. Our simulations, which are based on a continuous 3D model of prostate acini, provide a known ground-truth with which we can analyze the performance of registration techniques. Secondly, our analysis shows that, given a consistent feature space, KDE and PCA methods can register high-resolution images when the size of histological objects is comparable to section thickness. We anticipate application of our methods to register real tissue slices at high resolution.
METHODOLOGY
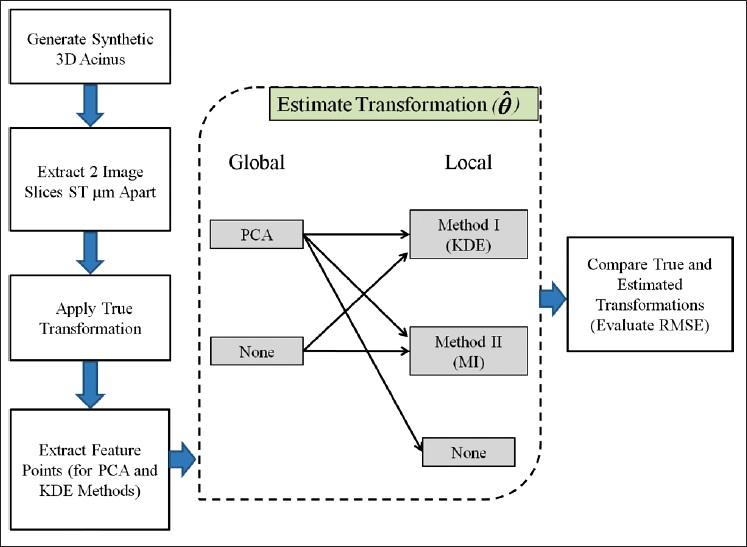
Figure 2 shows the simulation methodology. In this section, we describe our synthetic data, the registration methods, and the evaluation technique.
Figure 2.

Simulation pipeline for evaluation of registration methods
Synthetic Data Generation
Our ultimate goal is to register QD stained images of prostate acini[5] at high resolution for biomarker analysis in 3D [Figures 1a,b]. However, we realized that different biomarkers will stain different sections depending on the presence or absence of malignancy.[4] This fact amplifies the correspondence problem. Thus, multispectral images corresponding to biomarker expression are not ideal to extract features for image registration. To deal with this issue, we counterstained the QD stained sections with DAPI (4’, 6-diamidino-2-phenylindole). DAPI stains the nuclei irrespective of their malignancy status and thus DAPI stained images provides a coherent feature space [Figure 1c]. We started by modeling each nucleus in the acinus volume as a simple sphere and the acinus shape as a cylinder. Locations of spheres were initialized randomly, and then allowed to move due to a combination of nucleus-nucleus repulsion forces and forces of attraction to the shape of a cylinder. Parameters for nuclei size, internuclear distance, and acini size were determined by analysis of actual tissue images. The synthetic images are 1024×1024 pixel slices taken from the synthetic 3D volume data in 1 μm slice thickness (ST) increments with the x-y resolution 0.12 μm/pixel. Figure 3 shows one such volume and examples of 3 adjacent slices. In addition to spherical nuclei and cylindrical acini, we also investigated ellipsoidal nuclei and acini with rotating ellipsoidal cross sections. Our nomenclature for these data is circular acinus and circular nuclei (type 00), circular acinus and elliptical nuclei (type 01), elliptical acinus and circular nuclei (type 10), and elliptical acinus and elliptical nuclei (type 11).
Figure 3.
(a): Synthetic volume with spherical cells arranged around a cylindrical acinus. (b): A close-up region of the volume. (c): A typical slice of the volume. (d): Adjacent slice at a z-depth of 1μm from slice in (c). (e): A slice at z-depth of 5μm (typical section thickness in real slices) from slice in (c). Note the changing number of cells and their sizes in (c), (d) and (e)
Image Registration Methods
Method I (MI) - Intensity-based registration using mutual information: Mutual information (MI) between two images X and Y is defined as MI(X,Y) = H(X) + H(Y) - H(X,Y) where H (X)and H (Y) are the entropies of images X and Y respectively.[12]
Method II (KDE) - Point-based registration using a Gaussian kernel density estimate (KDE): We used point-based registration proposed by Tsin and Kanade.[1] For a given model point set M, the registration problem is defined as finding the optimal transformation T (m, θ), m ∈ M that minimizes the cost function C(S,M,θ)=–Σx{PM(x,θ)/║PM(x,θ)║}·{PS(x)/║PS(x)║}; θ is the transformation parameter and PM (x, θ) is the kernel density estimate of the transformed point set under transformation θ. For a given point set S, the kernel density estimate (KDE) of S is given by PS(x)=1/|S|Σs∈SK(x,s), where K(x,s) is a Gaussian Parzen window centered at point s and |S| is the size of the point set. A Gaussian KDE results in compactness of point sets and helps infer structure from points while reducing the noise by a smoothing operation.
Method III (PCA) - Image registration using principal components: PCA has been used for medical image registration such as for MRI[13] and for optimizer initialization.[9] In our analysis, besides being used as standalone methods, PCA has also been used for the initialization of MI and KDE methods. We estimated translation as the difference between means of the feature point sets. We estimated the rotation angle between two images by first finding the principal eigenvectors of the covariance of the feature points, and then determining the angle between them. Since PCA analysis gives numerical values for the eigenvectors, there is ambiguity in the angle estimation. In our simulations, we constrain the true rotations in the range [0°-50°]. Knowing the bounds on rotation, we estimate three angles  and
and  and select the one that is closest to the range [0°-50°].
Selection of Feature Points
We believe that nuclei centers are the most consistent information since other factors (nuclear footprint and acini contour) change from one slice to another. To test our hypothesis, we extract feature points for PCA using two methods. In the first method, we simply threshold the images above zero and use the resulting “on” pixels in the binary image as feature points for estimating eigenvectors. In the second method, we extract the nuclei centers as feature points. Since nuclei overlap in real and synthetic images, object segmentation and centroids detection do not always work. In our synthetic images (and in real images), the central nuclear regions are bright. So, we use h-maxima transform to extract these regions.[14] The h-maxima transformation is used to suppress all maxima whose depth is lower or equal to a given threshold level. We extract the nuclei centers as the centroids of the distinct objects in the h-maxima image.
Simulation Pipeline
We design our experiments to evaluate all three methods for varying ST (0-20 μm). A ST of 0 μm implies an image registered to itself, and serves as a useful control. We transform the synthetic image series using random translations in the range [50-100] pixels in x and y directions and rotations of up to 50°. To minimize the KDE cost function and -MI (maximizing MI being equivalent to minimizing -MI) we use the Nelder-Mead simplex search method.[15] To compare the registration errors, we use root mean square error (RMSE) defined as  where tx, ty, and α are the true values of translations and rotation and
  are the estimated values of these parameters using registration methods.
We generate five independent datasets of each type. The images obtained from the 3D volumes are down sampled by one-fourth with ST varying from 0 to 20 μm. For the KDE method, we vary the Gaussian kernel parameter σk. For the MI method, we filter the images with a Gaussian filter with the same standard deviation as used by the KDE method, i.e., σf = σk. We also test MI method with no filtering at all. We use different subscripts for these parameters since they are applied in a different manner. The parameter σk is applied to the point set derived from the images (KDE approach) and σf corresponds to the Gaussian filter applied to the image pair prior to MI registration. In order to estimate the effect of varying σ, values in the range [0-25] were used with increments of 1.25 for both σf and σk. At each value of σ and for each ST, we evaluate RMSE error. The optimal value corresponds to σ that gives minimum mean RMSE for a given dataset and at a given ST. In order to distinguish the implication of σ selection, we also use a fixed value of σ=22.5, which corresponds to the diameter of a nucleus.
RESULTS AND DISCUSSION
When we simulate registration using the MI method alone, several image pairs are not registered properly. On closer examination, the MI value at the estimated transformation is higher than the MI value at the true transformation for these image pairs. Similar findings were observed for the KDE method. One possible cause of these effects is the circular symmetry of the acinus, as this effect was less obvious in our data that did not contain acini with a circular cross-section. Another issue observed for all data types is the presence of local minimum around the global peak. We handle the local minima issue with two approaches: to smooth the data which in turn smoothens the cost surface compensating for the effect of sharp local peaks; or to initialize the local search close to the true solution. We used PCA and improved KDE and MI methods in most cases. Figure 4 shows the sample results from the best variant of each method. It is clear that PCA helps in global initialization with further refinement by KDE and MI.
Figure 4.
Overlaid display of the two images 5μm apart for best variant of each method. (a): Ground truth (aligned images). (b): Randomly transformed images. (c): PCA alignment with nuclei centers. (d): MI with PCA alignment (nuclei centers) and images filtered at optimal σf. (e): KDE with PCA alignment (nuclei centers) and optimal σk. Note the increasing improvement in cell alignment (yellow vertical arrow pointing to a single cell) from (c) to (e). KDE initialized with PCA gives the best results in (e). Also note the overlap between cyan and red arrows in the center indicating progressive improvement in alignment
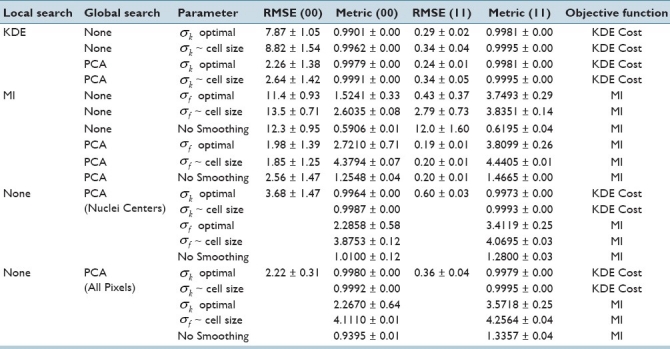
Table 1 shows the results at ST values of 0 μm. The cost metric in the table (columns 5 and 7) are evaluated using different values of σ parameter (column 3). All methods give reasonable accuracy when an image is registered with itself (ST = 0μm). More errors are observed for 00 cases, perhaps due to acinus symmetry. “Optimal smoothing” is beneficial for KDE and MI, suggesting that an intelligent selection of smoothing parameters may increase performance. MI without smoothing and with no PCA initialization converges to local solutions resulting in high error.
Table 1.
Mean RMSE for different methods at a ST of 0μm

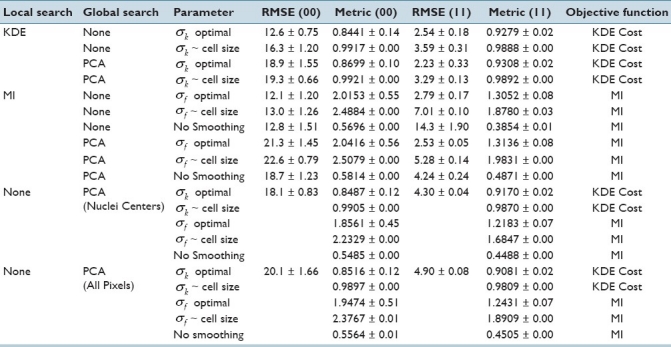
For a ST of 5 μm [Table 2], the PCA method with nuclei centers outperforms the PCA with all pixels, which is not the case for identical images. This supports our hypothesis that “nuclei centers” provides a more consistent feature space than “all pixels”. KDE performs better than MI for nontrivial ST. This further supports our hypothesis that nuclei centers (KDE) are more useful than image intensity (MI) for registering images of nuclei.
Table 2.
Mean RMSE for different methods at a slice thickness of 5μm

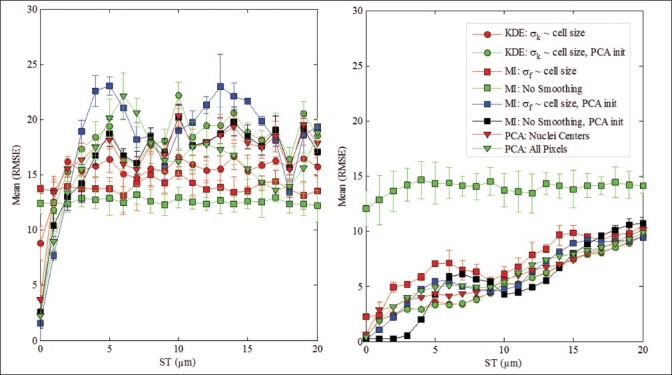
Figure 5 shows the comparison of three methods at various ST values. We plot only the results that do not involve “optimal” σ selection. The process of optimal σ selection is only of academic interest and is not practical for real images. From Figure 5, it is clear that the MI method is more prone to local convergence and cannot be applied without smoothing or PCA initialization. For MI, PCA initialization provides better performance than smoothing since smoothing results in a trade-off between local convergence and sharpness of the global maximum. For KDE, PCA initialization helps only moderately, as most of the local solutions are handled by using a fixed σk ~ nucleus diameter. We also note the performance variation in PCA with nuclei centers and PCA with all on pixels. When the two images are very similar (at lower ST values), “all pixels” PCA performs better and as ST increases, “nuclei center” PCA outperforms. We hypothesize that the semiperiodic performance of MI is due to some artificial regularity in the synthetic data, which sometimes organizes into hexagonal-close-packed spheres. Since we model the nuclei size as 10 μm, two image slices that are (10k) μm (k being an integer) apart, are similar with almost equivalent nuclei sizes. This results in slightly better performance around the 10 μm ST. Also, note the near-equal performance of PCA with all pixels and nuclei centers at these locations. However, for a typical section thickness of 5 μm, the KDE method performs better than the MI and PCA methods.
Figure 5.

Slice thickness (ST) versus mean RMSE for various methods. Left: Type 00 data. Right: Type 11 data
CONCLUSIONS
Overall, our results and analysis on synthetic data show that using a consistent feature space is helpful for accurate registration of high-resolution tissue image slices. We show that PCA initialization using nuclei centers can help the MI method achieve better performance. KDE performs slightly better than MI at ST = 5 μm, perhaps due to its consistent feature space. We also note that symmetry in the cell arrangement (such as around a circular acinus) can adversely affect registration. Our data generation and analysis technique is extendable to images of tissues other than prostate and for different image resolutions and inter-slice distances. We intend to apply our findings to the registration of real tissue images at high resolution.
ACKNOWLEDGMENTS
This research has been supported by grants from National Institutes of Health (P20GM072069, Bioengineering Research Partnership R01CA108468, Center for Cancer Nanotechnology Excellence U54CA119338, and 1RC2CA148265); Georgia Cancer Coalition (Distinguished Cancer Scholar Award to Professor Wang); Hewlett Packard, and Microsoft Research. We are grateful to Dr. Shuming Nie and Dr. Jian Liu for providing valuable prostate image data.
Footnotes
Available FREE in open access from: http://www.jpathinformatics.org/text.asp?2011/2/2/6/92037
REFERENCES
- 1.Tsin Y, Kanade T. A correlation-based approach to robust point set registration. European Conference on Computer Vision (ECCV) 2004;3:558–69. [Google Scholar]
- 2.Heppner GH. Tumor heterogeneity. Cancer Res. 1984;44:2259. [PubMed] [Google Scholar]
- 3.Vamvakidou AP, Mondrinos MJ, Petushi SP, Garcia FU, Lelkes PI, Tozeren A. Heterogeneous breast tumoroids: An in vitro assay for investigating cellular heterogeneity and drug delivery. J Biomol Screen. 2007;12:13–20. doi: 10.1177/1087057106296482. [DOI] [PubMed] [Google Scholar]
- 4.Liu J, Lau SK, Varma VA, Moffitt RA, Caldwell M, Liu T, et al. Molecular mapping of tumor heterogeneity on clinical tissue specimens with multiplexed quantum dots. ACS Nano. 2010;4:2755–65. doi: 10.1021/nn100213v. [DOI] [PMC free article] [PubMed] [Google Scholar]
- 5.Litterman AJ, Shapiro R, Berman R, Pavlick A, Daarvishian F, Blank S, et al. Detection of BRAF kinase mutations in melanoma, ovarian, and prostate carcinomas: Evidence for tumor heterogeneity in clinical samples. J Clin Oncol. 2009;27:15. [Google Scholar]
- 6.Meyer CR, Moffat BA, Kuszpit KK, Bland PL, Mckeever PE, Johnson TD, et al. A methodology for registration of a histological slide and in vivo MRI volume based on optimizing mutual information. Mol Imaging. 2006;5:16–23. [PMC free article] [PubMed] [Google Scholar]
- 7.Humm JL, Ballon D, Hu YC, Ruan S, Chui C, Tulipano PK, et al. A stereotactic method for the three-dimensional registration of multi-modality biologic images in animals: NMR, PET, histology, and autoradiography. Med Physics. 2003;30:2303–14. doi: 10.1118/1.1600738. [DOI] [PubMed] [Google Scholar]
- 8.Braumann UD, Scherf N, Einenkel J, Horn LC, Wentzensen N, Loeffler M, et al. Large histological serial sections for computational tissue volume reconstruction. Methods Inf Med. 2007;46:614–22. doi: 10.1160/me9065. [DOI] [PubMed] [Google Scholar]
- 9.Mosaliganti K, Pan T, Sharp R, Ridgway R, Iyengar S, Gulacy A, et al. Registration and 3d visualization of large microscopy images. SPIE Conference on Medical Imaging. 2006;6144:923–34. [Google Scholar]
- 10.Maurer CR, Jr, Fitzpatrick JM, Wang MY, Galloway RL, Jr, Maciunas RJ, Allen GS. Registration of head volume images using implantable fiducial markers. Medical Imaging. IEEE Trans Med Imaging. 1997;16:447–62. doi: 10.1109/42.611354. [DOI] [PubMed] [Google Scholar]
- 11.Patard JJ, Leray E, Rioux-Leclercq N, Cindolo L, Ficarra V, Zisman A, et al. Prognostic value of histologic subtypes in renal cell carcinoma: a multicenter experience. J Clin Oncol. 2005;23:2763–71. doi: 10.1200/JCO.2005.07.055. [DOI] [PubMed] [Google Scholar]
- 12.Maes F, Collignon A, Vandermeulen D, Marchal G, Suetens P. Multimodality image registration by maximization of mutual information. IEEE Trans Med Imaging. 1997;16:187–98. doi: 10.1109/42.563664. [DOI] [PubMed] [Google Scholar]
- 13.Shang L, Cheng Lv J, Yi Z. Rigid medical image registration using PCA neural network. Neurocomputing. 2006;69:1717–22. [Google Scholar]
- 14.Soille P. Secaucus, NJ, USA: Springer-Verlag; 2003. Morphological Image Analysis: Principles and Applications. New York, Inc. [Google Scholar]
- 15.Olsson DM, Nelson LS. The Nelder-Mead simplex procedure for function minimization. Technometrics. 1975;17:45–51. [Google Scholar]


