Abstract
Measurement of bone mass, geometry, density, and strength are critical in bone research and clinical studies. For peripheral quantitative computed tomography (pQCT), single and repeated measurements are particularly adversely affected by movement and positional variation. Dual-energy X-ray absorptiometry (DXA)–derived indices may alleviate these problems and provide useful alternative assessments. To evaluate this hypothesis, distal radius DXA and pQCT indices were compared in 101 healthy females aged 8.0 to 22.8 years (prepuberty to adulthood), reflecting a broad range of body sizes, physical maturity, and activity exposures. At the diaphysis, correlations were ρ =+0.74 to +0.98, with strong intermethod agreement for most indices. At the metaphysis, correlations were ρ =+0.64 to +0.97; intermethod agreement improved with modifications to the simplified geometric formulas more closely reflecting metaphyseal bone geometry. Further improvements may be possible because skeletal size and maturity-related biases in agreement were detected. Overall, DXA-derived indices may provide a useful assessment of bone geometry, density, and theoretical strength contingent on appropriate consideration of their limitations.
Keywords: BONE DENSITOMETRY, CLINICAL/PEDIATRICS, BONE QCT, BIOMECHANICS
Introduction
Pediatric bone assessment is important for both clinical and research applications, and a thorough understanding of bone growth patterns is critical to evaluations of normal and pathologic individuals. Although numerous bone analysis methods are available, to date, dual-energy X-ray absorptiometry (DXA) and peripheral quantitative computed tomography (pQCT) are the most common methods for quantitative assessment of bone mineral content, geometry, and density.
DXA is used extensively to diagnose osteoporosis and osteopenia in adults, distinguishing bone from nonbone tissue and correlating strongly with fracture risk.(1) DXA is favored for this application because it scans large regions of interest (ROIs) rapidly, inflicting low radiation doses. DXA is robust to movement and positional variation, improving scan quality and congruence of repeated measures within and between subjects—a critical issue in pediatric applications. DXA evaluates bone in two dimensions, yielding bone mineral content (BMC), bone projected area (area), and areal bone mineral density (aBMD; equal to BMC/area). Because aBMD does not represent a true volumetric density (BMC/volume), inter- and intraindividual differences in bone depth may be particularly influential in assessments of bone growth and adaptation.(2–4) Furthermore, DXA does not distinguish between trabecular and cortical bone and does not yield specific measures of geometry or theoretical strength, which are important parameters for describing bone growth. Because both bone mineral accrual and bone geometric growth are influential determinants of bone strength, ideal bone measurement techniques should account for variability of all measurement parameters.
In contrast, pQCT yields indices of BMC, geometry, volumetric density, and theoretical strength as standard outcomes, analyzing bone in three dimensions and distinguishing between trabecular and cortical tissue characteristics. For these reasons, pQCT would seem an ideal measurement technique; however, other limitations affect its application to pediatric populations. Compared with DXA, pQCT is less widely available and is limited primarily to research centers. Historically, both diagnostic and research applications have been hampered by the absence of standardized measurement and analysis protocols.(5) More critically, because pQCT samples thin slices of tissue, it is sensitive to movement and positional variation between and within subjects.(2) The latter issue may be particularly problematic in pediatric studies because children may find it difficult to remain still even for brief measurement periods. In addition, body size growth and variation make the assessment of analogous measurement sites challenging for intra- and intersubject comparisons.(5–7)
Thus a method of bone assessment that combines the strengths and minimizes the weaknesses of DXA and pQCT would be valuable for both pediatric and adult populations. Sievänen and colleagues published formulas that use simplified geometric models to derive indices of bone geometry, density, and theoretical strength from standard DXA outcomes.(8) Previously published work by our group evaluated agreement between these DXA-derived indices and pQCT measures at the radial metaphysis and diaphysis, demonstrating strong correlations and intermethod agreement for many outcomes in a sample of healthy, postmenarcheal female adolescents.(7) Although this early analysis evaluated subjects of disparate physical activity levels (primarily distinguishing ex-gymnasts and nongymnasts), it evaluated intermethod agreement over a relatively narrow range of age, maturity, and body size. Accordingly, for the current study, we compared DXA-derived and pQCT-measured indices of bone density, geometry, and strength over a broader maturational spectrum, evaluating the applicability of this methodology across childhood and adolescent growth.
Methods
Subjects were recruited from an ongoing longitudinal study evaluating bone growth in relation to gymnastic activity in prepubertal and adolescent females. Protocols were approved by the Institutional Review Board of SUNY Upstate Medical University, and subjects/parents gave written, informed assent/consent to participate, in accordance with the Declaration of Helsinki. Although 106 subjects were enrolled, at the time of analysis, only 101 females (premenarche, n =44; postmenarche, n =57) provided usable data; exclusions were primarily due to pQCT movement artifacts among premenarcheal subjects. Height was assessed using wall-mounted rulers and a right angle. Weight was measured in light clothing using a digital scale (Detecto, Webb City, MO, USA). Forearm length was measured from the olecranon to the ulnar styloid using a ruler. Menarcheal status and date were assessed by questionnaire at 6-month intervals.
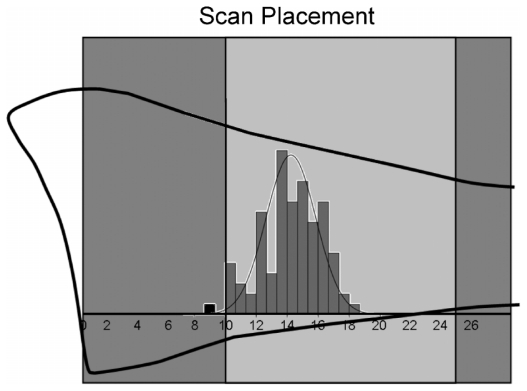
As detailed in a previous publication, contemporaneous DXA and pQCT scans assessed the nondominant distal radius at the metaphysis and diaphysis.(7) DXA evaluated ultradistal (UD) and 1/3 ROIs using a distal articular reference (Hologic QDR 4500W; Holistic, Waltham, MA, USA). The UD ROI sampled a length of bone measuring 15.1 mm; the 1/3 radius ROI was 21.0 or 20.0 mm long, as dictated by the Hologic analysis program (for forearm length <22 cm, ROI length =21.0 mm; for forearm length ≥ 22.0 cm, ROI length =20.0 mm). In contrast to standard Hologic analysis positioning (based on the ulnar articular surface), the analysis box was specifically positioned to include the radial articular cartilage and exclude the carpal bones.(9) Radius-based positioning prevents discrepancies in radius ROIs that would result from differences in the relative positions of the distal ulna and radius articular surfaces. This procedure improves the comparability of radius DXA ROIs in all subjects (immature and mature). Both pQCT regions of interest were 2 mm thick, evaluating 4% and 33% ROIs (physeal and articular references, respectively) (Norland-Stratec XCT 2000; Medizintechnik GmbH, White Plains, NY, USA).(7) Since both diaphyseal ROIs are positioned based on articular references and percentages of total ulnar length, the 33% pQCT ROI is centrally located within the 1/3 DXA ROI. In contrast, the position of the physeally determined 4% pQCT ROI varies among individuals; it generally lies within the distal portion of the UD DXA ROI (the latter is positioned a standard 10 mm distance from the articular reference; Fig. 1).
Fig. 1.
Positions of 4% pQCT regions of interest (ROI) within the ultra-distal DXA (UD) ROI. The distal radius is represented by the black bone outline intersected by the DXA analysis box. The light-gray box represents the UD ROI. The histogram represents the distribution of 4% pQCT scans (mm), with medium-gray bars denoting scans falling within the UD ROI and a single black bar representing the lone scan placed outside the UD ROI. To put the scale of the image into context, subject ulnar lengths ranged from 170 to 295 mm.
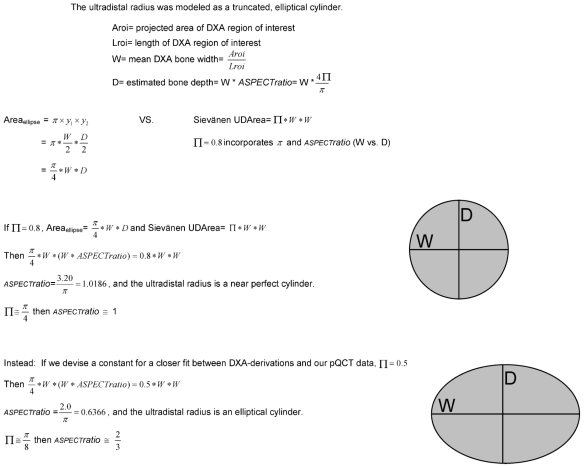
DXA output was used to derive geometric and strength variables using formulas published by Sievänen and colleagues.(7,8) (Please note: In Dowthwaite and colleagues,(7) in Table 1, the DXA equation for ultradistal BMAD is missing an exponent in the denominator; the correct formula should divide by the square of ROI projected area.) Metaphyseal and diaphyseal comparisons are listed in Table 1. In an attempt to improve intermethod agreement for metaphyseal variables, substitutions were made for the constant terms in the DXA-derived formulas of Sievänen and colleagues (Π=0.5 instead of Π =0.8, assuming an approximate anteroposterior width versus lateral width aspect ratio of 0.64 instead of approximately 1.0 for all ultradistal radii; Fig. 2). Fall-strength ratios were calculated by dividing the site-specific bone index by the product of forearm length (cm) and body weight (kg)(6,10,11); to facilitate graphic presentation, all fall-strength ratios were multiplied by 1000.
Table 1.
DXA-Derived and pQCT-Measured Indices for Comparison
| Metaphysis (n =94) | Diaphysis (n =97) | ||
|---|---|---|---|
| DXA (UD) | pQCT (4%) | DXA (1/3) | pQCT (33%) |
| Bone mineral apparent density (BMAD, g/cm3) | Total vBMD (TBvBMD, g/cm3) | Bone mineral apparent density (BMAD, g/cm3) | Total vBMD (TBvBMD, g/cm3) |
| Total/periosteal CSA (pCSA, mm2) | Total/periosteal CSA (pCSA, mm2) | Total/periosteal CSA (pCSA, mm2) | Total/periosteal CSA (pCSA, mm2) |
| Index of structural strength in axial compression (IBS, g2/cm4) | Index of structural strength in axial compression (IBS, g2/cm4) | Section modulus (Z, mm3) | Polar strength-strain index (SSI, mm3) |
| IBS fall-strength ratio | IBS fall-strength ratio | Z fall-strength Ratio | SSI fall-strength Ratio |
| Cortical CSA (cCSA, mm2) | Cortical CSA (cCSA, mm2) and cortical/subcortical CSA (cscCSA, mm2) | ||
| Intramedullary CSA (imCSA, mm2) | Intramedullary CSA (imCSA, mm2) | ||
| Cortical thickness (mm) | Cortical thickness (mm) | ||
vBMD =volumetric bone mineral density; CSA =cross-sectional area.
Fig. 2.
Derivation of alternative constant for metaphyseal aspect ratio.
Statistics
Data were analyzed using SPSS software (Version 17.0, SPSS, Inc., Chicago, IL, USA). Analogous pQCT and DXA parameters were compared using Spearman correlations (ρ, α =0.05). Inter-method comparisons were made using Bland-Altman plots (Microsoft Excel 2003, Redmond, WA, USA)(12) with equal X- and Y-axis scale ranges to facilitate visual interpretation. It is important to note that the position of the Y-axis origin may vary between graphs.
Results
In total, 101 subjects provided scans for these analyses. Individual DXA and pQCT scan pairs from several subjects were excluded due to pQCT movement artifacts (diaphysis, n =4; metaphysis n =7), yielding different sample sizes for metaphyseal and diaphyseal comparisons. In the final analysis, subjects represented nongymnasts (n =51) and ex/gymnasts (n =50) ranging in age from 8.0 to 22.8 years (mean =15.0 years; Table 2). Additional subject characteristics are described in Table 2. For all comparisons, DXA and pQCT indices were significantly positively correlated; on average, correlations were stronger at the diaphysis (ρ =+0.74 to +0.98, p <.001) than at the metaphysis (ρ =+0.64 to +0.97, p <.001; Tables 3 and 4).
Table 2.
Subject Characteristics: Mean (SD) [Minimum to Maximum]
| Total sample (n =101) | Premenarche (n =44) | Postmenarche (n =57) | |
|---|---|---|---|
| Chronologic age (years) | 15.0 (4.8) [8.0 to 22.8] | 10.0 (1.7) [8.0 to 14.3] | 18.8 (2.2) [14.2 to 22.8] |
| Gynecologic age (years) | N/A | N/A | 5.6 (2.3) [0.23 to 10.1] |
| Height (cm) | 151.2 (15.9) [107.0 to 179.0] | 137.6 (13.5) [107.0 to 158.0] | 161.7 (7.3) [144.0 to 179.0] |
| Body mass (kg) | 47.6 (14.5) [20.0 to 91.0] | 35.2 (11.3) [20.0 to 72.0] | 57.2 (8.0) [41.0 to 91.0] |
| Physical activity level (h/wk) | 5.9 (5.6) [0.0 to 38.0] | 5.7 (4.2) [0.13 to 16.67] | 6.1 (6.6) [0.0 to 38.0] |
| Forearm length (cm) | 23.3 (2.5) [17.0 to 29.5] | 21.2 (2.2) [17.0 to 25.0] | 24.9 (1.4) [22.5 to 29.5] |
Table 3.
Diaphyseal DXA Versus pQCT Indices: Correlation Coefficients and Mean Differences
| DXA | pQCT | Spearman’s ρ | DXA-pQCT mean difference (−2 to +2 SD) |
|---|---|---|---|
| Bone mineral apparent density (BMAD, g/cm3) | Total volumetric BMD (tvBMD, g/cm3) | +0.74 | −0.281 (−0.401 to −0.161) |
| Periosteal CSA (pCSA, mm2) | Periosteal CSA (pCSA, mm2) | +0.96 | 31.27 (2.72 to 59.82) |
| Section modulus (Z, mm3) | Polar strength-strain index (SSI, mm3) | +0.96 | −18.62 (−62.47 to 25.24) |
| Z fall-strength Ratio | SSI fall-strength ratio | +0.88 | −0.01 (−0.05 to 0.02) |
| Cortical CSA (cCSA, mm2) | Cortical/subcortical CSA (cscCSA, mm2) | +0.98 | 2.86 (−4.25 to 9.96) |
| Cortical CSA (cCSA, mm2) | Cortical CSA (cCSA, mm2) | +0.98 | 4.51 (−2.32 to 11.35) |
| Intramedullary CSA (imCSA, mm2) | Intramedullary CSA (imCSA, mm2) | +0.84 | 28.41 (1.41 to 55.41) |
| Cortical thickness (CWT, mm) | Cortical thickness (CWT, mm) | +0.90 | −0.51 (−1.00 to −0.03) |
Table 4.
Metaphyseal DXA Versus pQCT Indices: Correlation Coefficients and Mean Differences
| DXA-pQCT mean difference (−2 to +2 SD) | ||||
|---|---|---|---|---|
| DXA-derived index | pQCT Measure | Spearman’s ρ | Uncorrecteda | Correcteda |
| Bone mineral apparent density (BMAD, g/cm3) | Total volumetric BMD (TvBMD, g/cm3) | +0.64 | −0.145 (−0.284 to −0.006) | 0.017 (−0.118 to 0.152) |
| Periosteal CSA (pCSA, mm2) | Periosteal CSA (pCSA, mm2) | +0.87 | 109.80 (−20.69 to 240.28) | −5.23 (−71.6 to 61.1) |
| Index of structural strength in axial compression (IBS, g2/cm4) | Index of structural strength in axial compression (IBS, g2/cm4) | +0.97 | −0.134 (−0.309 to 0.040) | 0.002 (−0.092 to 0.095) |
| IBS fall strength (ratio) | IBS fall strength (ratio) | +0.89 | −0.109 (−0.216 to −0.002) | 0.013 (−0.079 to 0.104) |
Uncorrected differences represent Sievänen calculations, whereas corrected differences apply a modified heuristic constant.
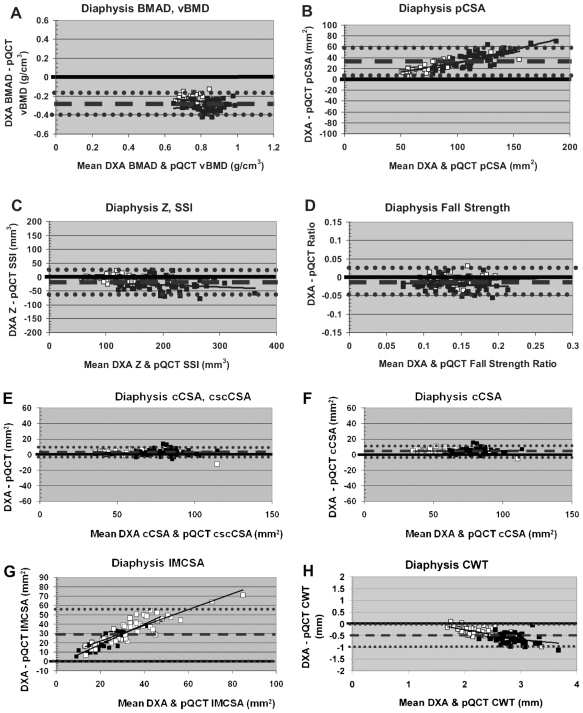
At the diaphysis, DXA-derived BMAD underestimated pQCT tbvBMD (Table 3, Fig. 3A). DXA-derived pCSA slightly overestimated pQCT pCSA with strong intermethod agreement and a positive bone-size-related bias (Table 3, Fig. 3B). Intermethod agreement was strong with no clear bias for diaphyseal Z/SSI and fall-strength ratio; DXA-derived indices provided slight underestimations of pQCT measures (Table 3, Fig. 3C, D). The strongest intermethod agreement and correlation were exhibited by comparisons of DXA-derived cCSA to pQCT cscCSA and pQCT cCSA (Fig. 3E, F); results were virtually identical for both pQCT cortical area measures. DXA-derived imCSA overestimated pQCT imCSA, apparently reflecting a bone-size-related bias (DXA derivation exceeds the pQCT measure, magnitude of inter-method differential positively correlated with bone size; Table 3, Fig. 3G). Although intermethod agreement is stronger, a similar but reverse pattern of bone-size bias appears to affect diaphyseal cortical thickness (DXA derivation falls short of pQCT measure, magnitude of intermethod differential positively correlated with bone size; Table 3, Fig. 3H).
Fig. 3.
Bland-Altman plots for diaphyseal DXA versus pQCT comparisons. Hollow boxes indicate premenarcheal subjects. Filled boxes indicate postmenarcheal subjects. Dashed lines denote mean intermethod differential. Dotted lines denote ± 2 SD.
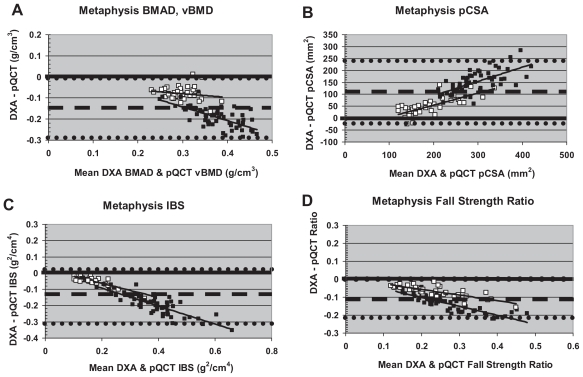
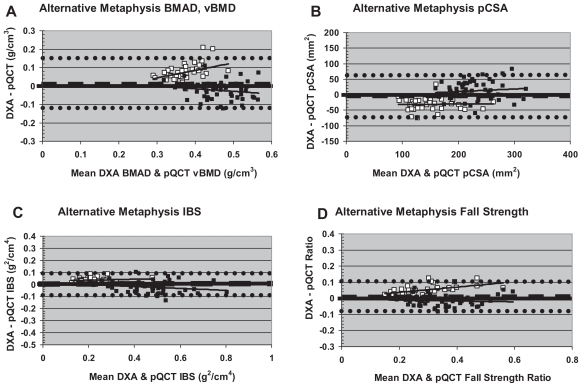
At the metaphysis, intermethod agreement for indices of volumetric density varied by menarche status (Table 4, Fig. 4A). Intermethod agreement was stronger in premenarcheal girls versus postmenarcheal girls. In order to alleviate intermethod differences, an alternative constant was employed in calculations of DXA-derived BMAD, yielding improved intermethod agreement (mean difference closer to zero), with no change in correlation (Table 4, Fig. 5A). With the modified formula, DXA-derived BMAD exceeded pQCT TBvBMD in premenarcheal girls. In contrast, in postmenarcheal girls, DXA BMAD more closely approximated pQCT TBvBMD (Fig. 5A). In premenarcheal girls, the magnitude of the intermethod difference was strongly positively correlated with bone density.
Fig. 4.
“Uncorrected” Bland-Altman plots for metaphyseal DXA versus pQCT comparisons. Hollow boxes indicate premenarcheal subjects. Filled boxes indicate postmenarcheal subjects. Dashed lines denote mean intermethod differential. Dotted lines denote ± 2 SD.
Fig. 5.
Bland-Altman plots for metaphyseal DXA versus pQCT comparisons using the alternative constant for DXA derivations. Hollow boxes indicate premenarcheal subjects. Filled boxes indicate postmenarcheal subjects. Dashed lines denote mean intermethod differentials. Dotted lines denote ±2 SD.
For metaphyseal pCSA, IBS, and fall strength, using the original Sievänen and colleagues constant, intermethod agreement was comparatively weak and negatively correlated with bone size (lowest agreement in postmenarcheal subjects; Figure 4B–D). For pCSA, DXA-derived results exceeded pQCT indices in almost all subjects (Fig. 4B), whereas for IBS and fall-strength ratio, DXA-derived results fell short of pQCT indices (Fig. 4C, D). Once again, substitution of the alternative constant for DXA derivations improved intermethod agreement without changing correlation (Table 4, Fig. 5B–D). With the revised formula, DXA-derived pCSA exceeded pQCT pCSA in postmenarcheal girls and fell short of pQCT pCSA in premenarcheal girls (Fig. 5B), whereas DXA-derived IBS and fall-strength ratio generally fell short of pQCT indices in postmenarcheal girls and exceeded them in premenarcheal girls (Fig. 5C, D). However, compared with other metaphyseal variables, revised bone strength indices (IBS, fall strength) exhibited stronger overall agreement with less clear-cut maturity and bone-size-related deviance (Fig. 5C, D).
Discussion
In general, DXA-derived bone geometry, density, and strength indices were positively correlated with pQCT measures, with stronger correlations and intermethod agreement at the diaphysis than at the metaphysis. Maturity- and/or bone-size-based variability in intermethod agreement was prevalent at the metaphysis but less evident for diaphyseal parameters.
The apparent maturity-related bias in metaphyseal patterns was alleviated by substitution of Π =0.5 instead of the original Π=0.8 used by Sievänen and colleagues in all metaphyseal formulas for DXA derivations. The net effect of this substitution is to treat the ultradistal radius not as a near-perfect truncated cylinder (anteroposterior/lateral aspect ratio approximately equal to 1.0) but as a more elliptical, truncated cylinder (anteroposterior/lateral aspect ratio approximately equal to 0.64). The original description of the derivation formulas by Sievänen and colleagues indicates their intent to represent the ultradistal radius as an elliptical, truncated cylinder using Π=0.8.(8) While investigating alternative heuristic constants to represent the relationship between π and the aspect ratio, we noted that application of Π =0.8 represented the distal radius as a nearly perfect cylinder. Substitution of Π =0.5 represented an aspect ratio of approximately anteroposterior width =6.4 versus lateral width =10. Since the latter agrees much more with the observed elliptical or oblong cross-sectional shape of the distal radius in our results, we substituted this constant in our second set of calculations.
Nonetheless, as noted previously, substitution of a modified constant did not yield perfect concordance between DXA derivations and pQCT measures for metaphyseal indices, nor did it obliterate all maturity/bone-size-correlated intermethod deviance. On the whole, there was still considerable metaphyseal intermethod deviance. This is likely attributable to variable placement of the 4% pQCT ROI in the wider, distal portion of the UD DXA ROI in most individuals. UD DXA results reflect a mean of properties across the total metaphyseal ROI; this includes both narrower bone more distant from the physis/physeal scar and broader bone in the distal portion of the ROI (confluent with the pQCT site). Thus DXA results are not necessarily a poor reflection of metaphyseal geometry and volumetric density; rather, DXA-derived results reflect the qualities of a far broader and more variable region of bone than is assessed by pQCT.
In our analysis, substitution of a modified constant succeeded in achieving lower intermethod deviance (mean closer to zero) and effectively split the difference between premenarcheal and postmenarcheal patterns. These results suggest a difference in bone shape associated with maturity or between smaller and bigger bones, with the modified constant representing an “averaged” shape for pre- and postmenarcheal metaphyses. Alternatively, there may be a maturity-specific bias in pQCT ROI placement within the ultradistal ROI. Finally, placement of the UD ROI is based on a uniform 10-mm distance from the distal articular reference, which represents a greater proportion of bone length in younger, smaller girls than in older girls. In contrast, placement of the pQCT scan is based on the combined factors of physeal location and ulnar length such that its location is determined in proportion with bone length. Thus the UD DXA ROI may include a more metaphysis-like region in mature girls and a more diaphysis-like region in younger girls, whereas the pQCT 4% ROI is likely more uniform.
On the whole, diaphyseal patterns did not reflect a maturity-related bias in bone parameters. This may be attributable to the comparatively uniform, central placement of the 33% pQCT ROI within the relatively uniform 1/3 DXA ROI. This diaphyseal uniformity contrasts markedly with the variable placement of the 4% pQCT ROI within the UD DXA ROI and the internal variability of the UDROI in both dimensions and properties (from distal to proximal). Cortical thickness presents the strongest case for a diaphyseal maturity-related bias and some possibility of an additional bone-size bias (Fig. 3H); postmenarcheal cortical thickness is much more strongly, uniformly, and consistently underestimated than premenarcheal cortical thickness.
Diaphyseal indices were influenced by skeletal size bias. DXA-derived pCSA was overestimated in the diaphyseal region (Fig. 3B) likely due to pCSA inflation error, as previously described by our group.(7) pCSA Inflation error occurs when actual bone shape varies from the cylindrical-model assumptions. We have noted previously that larger bones tend to deviate most strongly from this model, with expanded anteroposterior DXA width (pQCT X-plane width) relative to DXA out-of-plane depth (pQCT Y-plane depth).(7) Because the cylindrical model assumes equal anteroposterior width/depth dimensions, increased anteropos-terior width versus out-of-plane depth results in inflated DXA-derived CSA values compared with pQCT measures.(7) In this sample, many of the largest bones may reflect exposure to mechanical loading via gymnastics (and other activities); this loading appears to generate a teardrop-shaped diaphysis, potentially via muscular and nonmuscular loading of the interosseous ligament.(13,14)
Reflecting opposite manifestations of a probable bone size bias, DXA derivations overestimated pQCT imCSA and underestimated pQCT CWT (Fig. 3G, H). It is possible that shortcomings in the cortical volumetric BMD assumption compounded this phenomenon via both inadequacy of the categorical Tanner stage–based volumetric BMD and assumption of equal volumetric BMD in gymnasts and nongymnasts. Although previous work by our group and Ward and colleagues did not detect significant gymnastic exposure differences in cortical volumetric BMD,(15,16) Eser and colleagues reported a significantly lower cortical volumetric BMD in ex-gymnasts relative to nongym-nasts.(17) If ex/gymnasts do, in fact, have lower cortical volumetric BMD than nongymnasts, this would result in deflation of derived CWT and inflation of derived imCSA in ex/gymnasts. This deflation/inflation phenomenon would result from division of total BMC by cortical volumetric BMD to derive CWT, which is inversely related to imCSA. This phenomenon appears to be most likely in the case of imCSA because subsets of the sample exhibit both extremely large imCSA (both methods) and extremely large intermethod deviance (major DXA-derived overestimates). Since CWT and imCSA were affected across the board (ex/gymnasts and nongymnasts), we suspect that the current categorical Tanner stage–based volumetric BMD estimate may be responsible for some of this deviation. It is possible that better intermethod agreement would result from cortical volumetric BMD based on chronologic age or ulnar length, as well as physical activity level.
Overall, the best intermethod agreement for diaphyseal parameters was observed for DXA cCSA versus pQCT cscCSA, reflecting the fact that these are the most stringently analogous quantities. DXA cCSA includes all BMC and assumes that it is distributed within the cortex at a uniform volumetric BMD. In contrast, pQCT cCSA includes BMC only over a 710 mg/cm3 threshold, whereas pQCT cscCSA incorporates diaphyseal BMC above a density threshold of 540 mg/cm3. Extremely strong intermethod agreement also was observed for cCSA and Z/SSI, most likely because the vast majority of diaphyseal bone is distributed peripherally within the cortical ring, in accordance with the assumptions of the simplified geometric model.
Limitations
This study was based on a sample of healthy female subjects and may not reflect variability in pathologic populations or males. Because this study compares two complementary methods of bone assessment (one highly specific, the other representing a broad region of bone), this study does not aim to determine which method is correct or incorrect. Instead, pQCT is treated as the “gold standard” for evaluation of bone geometry, volumetric density, and theoretical strength. A different approach may have been warranted if we were evaluating fracture risk because DXA aBMD generally is considered a superior assessment tool for this general index of bone quality in adults. Future work should evaluate the influence of these factors and develop maturity- or bone-size-specific formulas to improve DXA-derived geometric, densitometric, and strength indices.
Conclusion
DXA-derived indices of bone geometry, density, and strength agree well with pQCT measures, particularly when a modified heuristic constant is applied for metaphyseal calculations. DXA-derived indices and pQCT measures provide complementary assessments of both pediatric and adult bone in healthy individuals, yielding more meaningful interpretations of bone characteristics than either index alone. In particular, DXA-derived indices are promising due to the widespread availability and applicability of DXA scans. These indices may be further improved via modifications to current assumptions regarding cortical volumetric BMD variation.
Acknowledgments
We would like to thank Cathy Riley, Tina Craig, Rebecca Hickman, Kristy Kmack, and Eileen Burd for their assistance during measurement sessions. We are extremely grateful for the participation of all our subjects and the support of their parents, without whom this research would not have been possible. This research was funded by the National Institute of Arthritis and Musculos-keletal and Skin Diseases (R01 AR54145), as well as grants from SUNY Upstate Medical University.
Footnotes
Disclosures
All the authors state that they have no conflicts of interest.
References
- 1.Flynn J, Foley S, Jones G. Can BMD assessed by DXA at age 8 predict fracture risk in boys and girls during puberty? An eight-year prospective study. J Bone Miner Res. 2007;22:1463–1467. doi: 10.1359/jbmr.070509. [DOI] [PubMed] [Google Scholar]
- 2.Binkley T, Berry LR, Specker BL. Methods for measurement of pediatric bone. Rev Endocr Metab Disord. 2008;9:95–106. doi: 10.1007/s11154-008-9073-5. [DOI] [PubMed] [Google Scholar]
- 3.Cole JH, Dowthwaite JN, Scerpella TA, van der Meulen MCH. Correcting fan-beam magnification in clinical densitometry scans of growing subjects. J Clin Densitom. 2009;12:322–329. doi: 10.1016/j.jocd.2009.05.002. [DOI] [PMC free article] [PubMed] [Google Scholar]
- 4.Van Rijn R, Van Kuijk C. Of small bones and big mistakes: bone densitometry in children revisited. Eur J Radiol. 2009;71:432–439. doi: 10.1016/j.ejrad.2008.08.017. [DOI] [PubMed] [Google Scholar]
- 5.Zemel B, Bass S, Binkley T, et al. Peripheral quantitative computed tomography in children andadolescents: the 2007 ISCD pediatric official positions. J Clin Densitom. 2008;11:59–74. doi: 10.1016/j.jocd.2007.12.006. [DOI] [PubMed] [Google Scholar]
- 6.Rauch F, Neu C, Manz F, Schonau E. The development of metaphyseal cortex-implications for distal radius fractures during growth. J Bone Miner Res. 2001;16:1547–1555. doi: 10.1359/jbmr.2001.16.8.1547. [DOI] [PubMed] [Google Scholar]
- 7.Dowthwaite JN, Hickman RM, Kanaley JA, Ploutz-Snyder RJ, Spadaro JA, Scerpella TA. Distal radius strength: a comparison of DXA-derived vs pQCT-measured parameters in adolescent females. J Clin Densi-tom. 2009;12:42–53. doi: 10.1016/j.jocd.2008.06.001. [DOI] [PubMed] [Google Scholar]
- 8.Sievänen H, Kannus P, Nieminen V, Heinonen A, Oja P, Vuori I. Estimation of various mechanical characteristics of human bones using dual energy x-ray absorptiometry: methodology and precision. Bone. 1996;18:17S–27S. doi: 10.1016/8756-3282(95)00376-2. [DOI] [PubMed] [Google Scholar]
- 9.Scerpella TA, Dowthwaite JN, Rosenbaum PF. Sustained skeletal benefit from childhood mechanical loading. Osteoporos Int. 2010 doi: 10.1007/s00198-010-1373-4.. Published online September 14, 2010. [DOI] [PMC free article] [PubMed] [Google Scholar]
- 10.Ruff C. Growth tracking of femoral and humeral strength from infancy through late adolescence. Acta Paediatr. 2005;94:1030–1037. doi: 10.1111/j.1651-2227.2005.tb02041.x. [DOI] [PubMed] [Google Scholar]
- 11.Dowthwaite JN, Flowers PPE, Spadaro JA, Scerpella TA. Bone geometry, density and strength indices of the distal radius reflect loading via childhood gymnastic activity. J Clin Densitom. 2007;10:65–75. doi: 10.1016/j.jocd.2006.10.003. [DOI] [PMC free article] [PubMed] [Google Scholar]
- 12.Bland JM, Altman DG. Statistical methods for assessing agreement between two methods of clinical measurement. Lancet. 1986;1:307–310. [PubMed] [Google Scholar]
- 13.Nanyan P, Prouteau S, Jaffre C, Benhamou L, Courteix D. Thicker radial cortex in physically active prepubertal girls compared to controls. Int J Sports Med. 2005;26:110–115. doi: 10.1055/s-2004-817859. [DOI] [PubMed] [Google Scholar]
- 14.Dowthwaite JN, Scerpella TA. Skeletal geometry and indices of bone strength in artistic gymnasts. J Musculoskelet Neuronal Interact. 2009;9:198–214. [PMC free article] [PubMed] [Google Scholar]
- 15.Ward K, Roberts SA, Adams JE, Mughal MZ. Bone geometry and density in the skeleton of pre-pubertal gymnasts and school children. Bone. 2005;36:1012–1018. doi: 10.1016/j.bone.2005.03.001. [DOI] [PubMed] [Google Scholar]
- 16.Dowthwaite JN, Scerpella TA. Distal radius geometry and skeletal strength indices after peripubertal artistic gymnastics. Osteoporos Int. 2011;22:207–216. doi: 10.1007/s00198-010-1233-2. [DOI] [PMC free article] [PubMed] [Google Scholar]
- 17.Eser P, Hill B, Ducher G, Bass SL. Skeletal benefits after long-term retirement in former elite female gymnasts. J Bone Miner Res. 2009;24:1981–1988. doi: 10.1359/jbmr.090521. [DOI] [PubMed] [Google Scholar]


