

Abstract
BACKGROUND
Patients with depression and poorly controlled diabetes, coronary heart disease, or both have an increased risk of adverse outcomes and high health care costs. We conducted a study to determine whether coordinated care management of multiple conditions improves disease control in these patients.
METHODS
We conducted a single-blind, randomized, controlled trial in 14 primary care clinics in an integrated health care system in Washington State, involving 214 participants with poorly controlled diabetes, coronary heart disease, or both and coexisting depression. Patients were randomly assigned to the usual-care group or to the intervention group, in which a medically supervised nurse, working with each patient’s primary care physician, provided guideline-based, collaborative care management, with the goal of controlling risk factors associated with multiple diseases. The primary outcome was based on simultaneous modeling of glycated hemoglobin, low-density lipoprotein (LDL) cholesterol, and systolic blood-pressure levels and Symptom Checklist–20 (SCL-20) depression outcomes at 12 months; this modeling allowed estimation of a single overall treatment effect.
RESULTS
As compared with controls, patients in the intervention group had greater overall 12-month improvement across glycated hemoglobin levels (difference, 0.58%), LDL cholesterol levels (difference, 6.9 mg per deciliter [0.2 mmol per liter]), systolic blood pressure (difference, 5.1 mm Hg), and SCL-20 depression scores (difference, 0.40 points) (P<0.001). Patients in the intervention group also were more likely to have one or more adjustments of insulin (P = 0.006), antihypertensive medications (P<0.001), and antidepressant medications (P<0.001), and they had better quality of life (P<0.001) and greater satisfaction with care for diabetes, coronary heart disease, or both (P<0.001) and with care for depression (P<0.001).
CONCLUSIONS
As compared with usual care, an intervention involving nurses who provided guideline-based, patient-centered management of depression and chronic disease significantly improved control of medical disease and depression. (Funded by the National Institute of Mental Health; ClinicalTrials.gov number, NCT00468676.)
Evidence-based care management for single conditions improves outcomes among patients with diabetes,1 coronary heart disease, 2 and depression,3 but organizing diagnosis-specific programs is complex and costly, so such programs are not routinely available.4,5 Care for patients with multiple chronic illnesses is expensive, and coordination of care among specialties can be inadequate.5,6 In previous trials involving high-risk Medicare patients with diabetes, heart disease, or both, nurse care-management interventions did not improve patient outcomes.7 However, these interventions were primarily delivered by telephone, had no physician supervision, did not include medication recommendations to primary care physicians, and were not integrated into primary care.
Since the care of patients with multiple chronic diseases accounts for the majority of health care costs, effective approaches to managing such complex care in primary care are needed, particularly when psychological and physical disorders coexist.4,5 A possible approach to organizing services for patients with multiple conditions is to identify clusters of coexisting illnesses with compatible management guidelines (e.g., diabetes and coronary heart disease).8,9 Major depression is prevalent among patients with diabetes and coronary heart disease10,11 and is a risk factor for poor self-care,12,13 complications, and death.14,15
We conducted a randomized, controlled trial to determine whether a primary care-based, care-management intervention for multiple conditions would improve medical outcomes and depression scores among patients with major depression and poorly controlled diabetes, coronary heart disease, or both.
METHODS
STUDY PARTICIPANTS
Participants were recruited from May 2007 through October 2009. Patients and primary care physicians in 14 primary care clinics in the Group Health Cooperative in Washington State participated.
Using electronic medical records, we identified patients with diagnoses of diabetes, coronary heart disease, or both coded according to the International Classification of Diseases, 9th Revision, or Current Procedural Terminology codes for coronary-artery interventions (Appendix 1 in the Supplementary Appendix, available with the full text of this article at NEJM.org). These patients had one or more measures of poor disease control within the previous 12 months, including: blood pressure above 140/90 mm Hg (based on two blood-pressure readings at separate visits within 12 months), a low-density lipoprotein (LDL) cholesterol level above 130 mg per deciliter (>3.4 mmol per liter), or a glycated hemoglobin level of 8.5% or higher. We recruited patients who were ambulatory, spoke English, and planned to be enrolled in a health-maintenance-organization (HMO) plan for 12 months. Exclusion criteria were the following: terminal illness, residence in a long-term care facility, severe hearing loss, planned bariatric surgery within 3 months, pregnancy or breast-feeding, ongoing psychiatric care, bipolar disorder or schizophrenia, use of an antipsychotic or mood-stabilizer medication, and observed mental confusion suggesting dementia.
Eligible patients received the Patient Health Questionnaire–2 (PHQ-2)16 depression screening by mail or telephone. Patients with PHQ-2 scores of 3 or more (on a scale of 0 to 6, with higher scores indicating a greater severity of depression) completed the Patient Health Questionnaire–9 (PHQ-9) (with scores ranging from 0 to 27 and higher scores indicating a greater severity of depression) by telephone interview. We used cutoff points of 3 or higher on the PHQ-2 and 10 or higher on the PHQ-9 to identify patients who were eligible for the trial; scores in this range have high sensitivity and specificity for major depression.16 Eligible patients completed a baseline interview and gave oral consent for laboratory tests before an in-person visit, at which they provided written informed consent.
STUDY PROCEDURES
Research assistants who were unaware of the intervention status implemented study procedures. At baseline, 6 months, and 12 months, telephone interviewers assessed depression symptoms, health risk behaviors, and satisfaction with the care of depression and diabetes, coronary heart disease, or both. Blood-pressure and glycated hemoglobin levels were measured in person at baseline, 6 months, and 12 months, and fasting LDL cholesterol levels were measured at baseline and 12 months. Blood pressure was measured three times after 20 minutes of rest in a sitting position, with the mean of the latter two blood-pressure readings used in the analyses. Laboratory tests were performed at the laboratories of the health plan, and the results entered into the electronic medical record.
RANDOMIZATION
Patients were assigned to a treatment group with the use of a permuted-block design, with randomly selected block sizes of 4, 6, and 8 patients. After the baseline evaluation, a study nurse contacted patients assigned to the intervention to initiate treatment.
STUDY DESIGN
Three part-time registered nurses with experience in diabetes education collaborated with primary care physicians to implement the intervention. Study nurses attended a 2-day training course on depression management, behavioral strategies, and glycemic, blood-pressure, and lipid control. A psychiatrist, a family physician, an internist who specialized in nephrology, an endocrinologist, a psychologist, and a nurse provided the training materials that were developed for the trial (Appendix 2 in the Supplementary Appendix).
INTERVENTION PROGRAM
A 12-month intervention aimed to manage depression and improve glycemic, blood-pressure, and lipid control by integrating a treat-to-target program for diabetes and coronary heart disease with collaborative care for depression.17 The intervention combined support for self-care with pharmacotherapy to control depression, hyperglycemia, hypertension, and hyperlipidemia. Patients worked collaboratively with nurses and primary care physicians to establish individualized clinical and self-care goals. In structured visits in each patient’s primary care clinic every 2 to 3 weeks, nurses monitored the patient’s progress with respect to management of depression (according to the PHQ-9 score), control of medical disease, and self-care activities. Treatment protocols guided adjustments of commonly used medicines in patients who did not achieve specific goals (Appendix 3 in the Supplementary Appendix). First-line agents included diuretics and angiotensin-converting-enzyme inhibitors for hypertension, statins for hyperlipidemia, metformin for hyperglycemia, and citalopram or sustained-release bupropion for depression. Nurses followed patients proactively to provide support for medication adherence.
Using motivational and encouraging coaching,18 nurses helped patients solve problems and set goals for improved medication adherence and self-care (e.g., exercising and self-monitoring of blood-pressure and glucose levels). Patients received self-care materials, including The Depression Helpbook,19 a video compact disk on depression care, a booklet and other materials on chronic disease management, and self-monitoring devices (e.g., blood-pressure or blood-glucose meters) appropriate to their condition.
SUPERVISION
Nurses received weekly supervision with a psychiatrist, primary care physician, and psychologist to review new cases and patient progress. An electronic registry was used to track PHQ-9 scores and glycated hemoglobin, LDL cholesterol, and blood-pressure levels. The supervising physicians recommended initial choices and changes in medications tailored to the patient’s history and clinical response. The nurse communicated recommended medication changes to the primary care physician responsible for medication management.
MAINTENANCE PLAN
Once a patient achieved targeted levels for relevant measures, the nurse and patient developed a maintenance plan that included stress reduction, behavioral goals, continued use of medications, and identification of prodromal symptoms associated with worsening depression and glycemic control. The nurses then followed patients with telephone calls every 4 weeks to complete a PHQ-9 and review adherence and laboratory test results. Patients with disease control that worsened were offered follow-up visits or telephone calls and protocol-based intensification of treatment regimens.
OUTCOME MEASURES
The initial primary outcome was the percentage of patients achieving disease control at 12 months on all three disease-control measures (glycated hemoglobin level, <7.0% or decrease of ≥0.5 percentage point; systolic blood pressure, <130 mm Hg or decrease of ≥10 mm Hg; and LDL cholesterol level, <100 mg per deciliter [<2.6 mmol per liter] or decrease of ≥15%). This outcome was changed in August 2009 (before study data became available for analysis in November 2009) to a multivariate primary outcome with simultaneous modeling of four separate 12-month outcomes (depression according to the Symptom Checklist–20 [SCL-20] score,20 glycated hemoglobin level, systolic blood pressure, and LDL cholesterol level) allowing estimation of a single overall treatment effect (see the Statistical Analysis section). Secondary measures included the originally proposed composite measure of medical control at 12 months based on the three disease-control factors, Patient Global Rating of Improvement for depression (on a scale of 1 to 7, with higher scores indicating improvement in symptoms),21 satisfaction with care for depression and for diabetes, coronary heart disease, or both based on a 5-point scale (from poor to excellent), quality of life over the previous 1-month period (on a scale from 0 to 10, with higher scores indicating improved quality of life), days of adherence to diet and exercise regimens in the previous week, and health care costs.22 In post hoc analyses, we assessed the proportion of patients with a decrease in systolic blood pressure of 10 mm Hg or more from baseline and a decrease in the glycated hemoglobin level of 1.0% or more.
Medication adjustments were defined by the following treatment changes over a 12-month period: an increase in the number of medication classes prescribed, a change in the daily dosage of at least one ongoing medication, a switch to a medication in a different class, or a switch to a different medication within the same class23 (Appendix 4 in the Supplementary Appendix).
ENHANCED USUAL CARE
Primary care physicians at the HMO plan provided medical services for patients with diabetes, depression, and coronary heart disease. Patients could self-refer to mental health care or primary care physicians could refer them. After randomization, patients in the usual-care group were advised to consult with their primary care physician to receive care for depression and for diabetes, coronary heart disease, or both. With the patients’ permission, primary care physicians were notified about depression and poor control of medical disease and received laboratory test results at baseline, 6 months, and 12 months.
STUDY OVERSIGHT
A data and safety monitoring board reviewed methods initially and outcomes every 6 months thereafter. The trial was approved by the institutional review board of the Group Health Research Institute.
STATISTICAL ANALYSIS
We estimated that 145 patients would be needed per group, assuming 15% attrition, to provide 80% power to detect a mean (±SD) difference in SCL-20 depression scores of 0.165±0.5 points and a 15% difference in patients achieving disease control on all three measures (glycated hemoglobin level, <7.0% or decrease of ≥0.5%; systolic blood pressure, <130 mm Hg or decrease of ≥10 mm Hg; and LDL cholesterol level, <100 mg per deciliter [<2.6 mmol per liter] or decrease of ≥15%) with a two-tailed alpha value of less than 0.05.
While data collection was under way, we considered more efficient methods for estimating the overall intervention effect that were consistent with our goal of assessing the combined effect on the four primary study outcomes. As a result, in August 2009, we revised our analysis plans to describe study outcomes at 12 months after randomization, using a scaled marginal model24; this change was made before study data became available for analysis. Although the recruitment target of 290 patients was not reached, the use of the scaled marginal model24 was considerably more powerful than the analytic approach used to plan sample size. This multivariate model jointly described the four 12-month outcomes (SCL-20 score, glycated hemoglobin level, systolic blood pressure, and LDL cholesterol level) and allowed us to test for a primary effect of the intervention among outcomes, scaling each outcome by its standard error, so that intervention effects could be interpreted as effect sizes. The model was estimated by iterating between estimation of the covariance associated with outcomes and generalized-estimating-equation estimation of scaled outcomes. All observations were used in the generalized-estimating-equation step, but only observations with complete covariate and outcome data were used to update the standard-error estimate. We used a score test to assess the equality of the intervention effect among outcomes. We carried out post hoc analyses to assess the intervention effect on SCL-20 scores alone and on the glycated hemoglobin level, systolic blood pressure, and LDL cholesterol level as a group.
Logistic regression was used to assess associations between intervention status and the Patient Global Rating of Improvement score, clinical depression response (i.e., ≥50% decrease in the SCL-20 score), and satisfaction with care at 6 and 12 months. Linear regression was used to assess the relationship between intervention status and quality of life at 6 and 12 months. Analyses across time points were performed with the use of regression models to adjust for baseline measures, with generalized estimating equations to account for correlation over time. Pearson’s chi-square test was used to evaluate between-group differences in the proportion of patients with overall medical improvement, one or more adjustments in each of five classes of medications, and 2 or more days per week of adherence to diet and exercise regimens.
RESULTS
STUDY PARTICIPANTS
Of 164 primary care physicians invited, 151 (92%) agreed to participate. Of 214 patients enrolled (106 in the intervention group and 108 in the usual-care group), 88% completed all 6-month telephone and laboratory assessments and 83% completed all 12-month assessments (Fig. 1). The characteristics of the patients in the intervention group and the usual-care group were similar at baseline (Table 1).
Figure 1. Enrollment, Randomization, and Follow-up of the Study Patients.
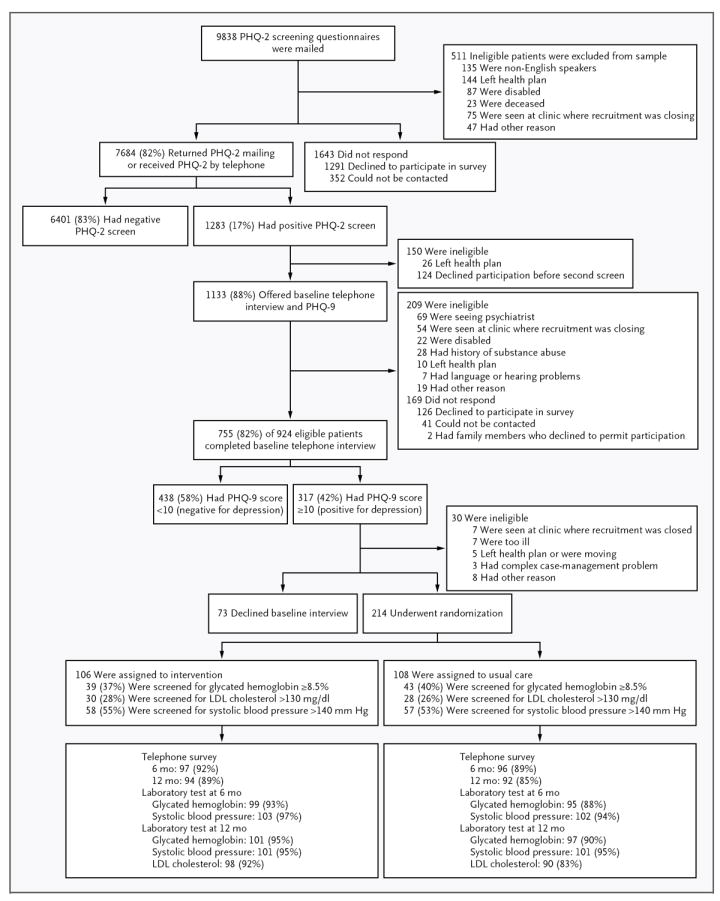
LDL denotes low-density lipoprotein, PHQ-2 Patient Health Questionnaire–2, and PHQ-9 Patient Health Questionnaire–9.
Table 1.
Characteristics of the Patients.*
| Characteristic | Intervention Group (N = 106) | Usual-Care Group (N = 108) |
|---|---|---|
| Age — yr | 57.4±10.5 | 56.3±12.1 |
| Female sex — % | 48 | 56 |
| ≥1 yr of college — % | 61 | 56 |
| Minority race or ethnic group (non-white or Hispanic) — % | 25 | 22 |
| Employment — % | ||
| Part-time or full-time | 53 | 59 |
| Retired | 34 | 26 |
| Unemployed or disabled | 10 | 13 |
| Homemaker | 3 | 2 |
| ≥1 Antidepressant prescription filled in previous 12 mo — no. (%) | 61 (57) | 57 (53) |
| PHQ-9 | ||
| Score | 14.7±3.8 | 13.9±3.1 |
| Range | 10.0 to 26.0 | 10.0 to 23.0 |
| Depression for ≥2 yr — % | 72 | 76 |
| SCL-20 | ||
| Score | 1.7±0.6 | 1.7±0.6 |
| Range | 0.2 to 3.25 | 0.3 to 2.95 |
| Glycated hemoglobin — % | 8.1±2.0 | 8.0±1.9 |
| LDL cholesterol — mg/dl | 106.5±35.3 | 109.0±36.5 |
| Systolic blood pressure — mm Hg | 136±18.4 | 132±17.2 |
| Diabetes (with or without coronary heart disease) — % | 89 | 82 |
| Coronary heart disease — % | 23 | 30 |
| Body-mass index | 36.9±8.3 | 36.6±8.5 |
Plus-minus values are means ±SD. The body-mass index is the weight in kilograms divided by the square of the height in meters. To convert values for low-density lipoprotein (LDL) cholesterol to millimoles per liter, multiply by 0.02586. PHQ-9 denotes Patient Health Questionnaire–9, and SCL-20 Symptom Checklist–20.
More than 99% of patients in the intervention group completed an initial visit, and 82% had at least four in-person visits with the nurse. Patients in the intervention group had a mean of 10.0 in-person and 10.8 telephone visits with the nurse care manager over the 12-month period. The estimated mean cost per patient, including all nurse contacts, physician supervision, and information system support, was $1,224 (Appendix 5 in the Supplementary Appendix).
PRIMARY AND SECONDARY OUTCOMES
At 12 months, patients in the intervention group had significantly greater overall improvement than controls with respect to the glycated hemoglobin, LDL cholesterol, systolic blood pressure, and SCL-20 depression outcomes (Table 2). Post hoc tests showed significant differences between the intervention group and the control group on the SCL-20 score alone and the joint 12-month glycated hemoglobin, LDL cholesterol, and systolic blood-pressure outcomes, as well as significant between-group differences on three of the four disease-control measures. Post hoc analyses also showed that patients in the intervention group had significant improvement on the joint primary outcome as compared with controls with each of the three nurses who provided the intervention (P<0.05). The unadjusted differences between the intervention and control groups in individual outcomes were as follows: glycated hemoglobin level, 0.58 percentage points; LDL cholesterol level, 6.9 mg per deciliter (0.2 mmol per liter); systolic blood pressure, 5.1 mm Hg; and SCL-20 score, 0.40 (effect size, 0.67) (Appendix 6 in the Supplementary Appendix).
Table 2.
Differences in Outcomes in Control of the Primary Disease.*
| Outcome | Unadjusted Estimate | Estimated Between-Group Difference (95% CI) | P Value† | ||||
|---|---|---|---|---|---|---|---|
| Intervention Group (N = 105) | Usual-Care Group (N = 106) | Four-Outcome Composite | SCL-20 Alone and Three-Disease Composite | ||||
| change‡ | change‡ | ||||||
| SCL-20 score§ | |||||||
| Baseline | 1.74±0.59 | 0.91 | 1.65±0.60 | 0.51 | −0.41 (−0.56 to −0.26)¶ | <0.001 | <0.001¶ |
| 6 mo | 0.84±0.68 | 1.26±0.72 | |||||
| 12 mo | 0.83±0.68 | 1.14±0.66 | |||||
| Glycated hemoglobin — % | |||||||
| Baseline | 8.14±2.03 | 0.81 | 8.04±1.87 | 0.23 | −0.56 (−0.85 to −0.27)¶ | <0.001 | |
| 6 mo | 7.42±1.32 | 7.87±1.93 | |||||
| 12 mo | 7.33±1.21 | 7.81±1.90 | |||||
| LDL cholesterol — mg/dl | |||||||
| Baseline | 106.8±35.4 | 14.9 | 109.4±36.7 | 8.0 | −9.1 (−17.5 to −0.8)∥ | ||
| 12 mo | 91.9±36.7 | 101.4±36.6 | |||||
| Systolic blood pressure — mm Hg | |||||||
| Baseline | 135.7±18.4 | 4.7 | 131.9±17.0 | −0.4 | −3.4 (−6.9 to 0.1)¶ | ||
| 6 mo | 131.9±15.2 | 133.5±20.4 | |||||
| 12 mo | 131.0±18.2 | 132.3±17.4 | |||||
Plus–minus values are means ±SD. To convert values for low-density lipoprotein (LDL) cholesterol to millimoles per liter, multiply by 0.02586. CI denotes confidence interval, and SCL-20 Symptom Checklist–20.
P values for the overall treatment effect are based on a two-sided score test for the intervention effect estimated from a multivariate model for 12-month scaled outcomes.
The change is the baseline mean minus the 12-month mean.
An SCL-20 score of 1.75 has been shown to have the highest sensitivity and specificity for the diagnosis of major depression based on structured psychiatric interviews.
Values are from a generalized-estimating-equation model predicting a 6- and 12-month outcome.
Values are from a linear-regression model predicting a 12-month outcome. (LDL cholesterol levels were not measured at 6 months.)
At 12 months, patients in the intervention group had significantly greater improvement than controls on the Patient Global Rating of Improvement, and a higher proportion had a 50% or greater reduction in the SCL-20 depression score (Table 3). At the 12-month follow-up, a significantly higher percentage of patients in the intervention group than in the control group had values on all three medical risk factors that were either below guidelines or showed clinically significant improvement. Patients in the intervention group also had greater improvement in quality of life, were more satisfied with the care that they received for depression and for diabetes, coronary heart disease, or both, and were more likely to have a decrease of 1.0% or greater in the glycated hemoglobin level from baseline and a decrease of 10 mm Hg or greater in systolic blood pressure (Appendix 7 in the Supplementary Appendix).
Table 3.
Clinical and Quality-of-Life Measures.*
| Outcome | Intervention Group | Usual-Care Group | P Value |
|---|---|---|---|
| Improvement on Patient Global Improvement Scale — no./total no. (%)† | |||
| 6 mo | 64/96 (67) | 15/91 (16) | <0.001‡ |
| 12 mo | 41/92 (45) | 16/91 (18) | |
| ≥50% decrease in SCL-20 score — no./total no. (%) | |||
| 6 mo | 57/97 (59) | 22/96 (23) | <0.001‡ |
| 12 mo | 56/94 (60) | 28/92 (30) | |
| All three medical measures below guidelines or showing clinically significant change at 12 mo — no./total no. (%)§ | 36/97 (37) | 19/87 (22) | 0.024¶ |
| ≥1.0 percentage point decrease in glycated hemoglobin level from baseline at 12 mo — no./total no. (%) | 37/102 (36) | 18/96 (19) | 0.006¶ |
| ≥10 mm Hg decrease in systolic blood pressure from baseline at 12 mo — no./total no. (%) | 41/101 (41) | 25/101 (25) | 0.016¶ |
| Satisfaction with care of depression — no./total no. (%)∥ | |||
| Baseline | 47/92 (51) | 43/92 (47) | <0.001¶ |
| 6 mo | 84/97 (87) | 53/86 (62) | |
| 12 mo | 81/90 (90) | 46/84 (55) | |
| Satisfaction with care of diabetes, heart disease, or both —no./total no. (%)∥ | |||
| Baseline | 73/104 (70) | 65/95 (68) | <0.001¶ |
| 6 mo | 87/97 (90) | 65/95 (68) | |
| 12 mo | 79/92 (86) | 62/88 (70) | |
| Quality-of-life score** | |||
| Baseline | 4.2±1.9 | 4.6±1.8 | <0.001 |
| 6 mo | 5.8±2.4 | 5.2±1.8 | |
| 12 mo | 6.0±2.2 | 5.2±1.9 |
Plus–minus values are means ±SD. SCL-20 denotes Symptom Checklist–20.
Improvement refers to the categories “a lot” to “completely better” on the Global Improvement Scale.
P values are based on a two-sided score test of the intervention effect with the use of 6- and 12-month data estimated from a logistic-regression model. (Measures of satisfaction were adjusted for the baseline value.)
Changes in medical measures were the following: glycated hemoglobin level, <7.0% or a ≥0.5% decrease from baseline; systolic blood pressure, <130 mm Hg or a ≥10 mm Hg decrease from baseline; and low-density lipoprotein cholesterol, <100 mg per deciliter (2.6 mmol per liter) or a ≥15% decrease from baseline.
P values are based on a two-sided Pearson’s chi-square test.
Satisfaction refers to “very satisfied” to “extremely satisfied” on the satisfaction scale.
Quality-of-life scores are based on a scale of 0 to 10, with higher scores indicating better quality of life. P values are based on a two-sided score test of the intervention effect with the use of 6- and 12-month data estimated from a linear regression model controlling for baseline value.
QUALITY OF CARE
As compared with controls, patients in the intervention group were significantly more likely to have one or more changes in the insulin dose and in antihypertensive and antidepressant medications over the 12-month period. There was no significant difference between groups in the proportion of patients adhering to recommended diet and exercise at least 2 days per week (Table 4, and Appendix 8 in the Supplementary Appendix).
Table 4.
One or More Adjustments of Medication over a 12-Month Period and Adherence at 12 Months to Diet and Exercise for 2 or More Days a Week.
| Variable | Intervention Group (N = 90) | Usual-Care Group (N = 91) | P Value* |
|---|---|---|---|
| Therapeutic class — no. (%) | |||
| Oral hypoglycemic agents | 34 (38) | 23 (25) | 0.07 |
| Insulin | 48 (53) | 30 (33) | 0.006 |
| Antihypertensive agents | 71 (79) | 45 (49) | <0.001 |
| Lipid lowering | 50 (56) | 39 (43) | 0.08 |
| Antidepressant | 79 (88) | 27 (30) | <0.001 |
| Adherence ≥2 days per wk — no./total no. (%) | |||
| Diet | |||
| General plan | 68/79 (86) | 63/78 (81) | 0.37 |
| Specific plan | 66/79 (84) | 60/78 (77) | 0.30 |
| Exercise | |||
| General plan | 43/79 (54) | 34/78 (44) | 0.17 |
| Specific plan | 23/79 (29) | 16/78 (21) | 0.21 |
P values were calculated with the use of Pearson’s chi-square test.
ADVERSE EVENTS
Over the 12-month trial, 27 patients in the intervention group and 23 patients in the control group had at least one hospitalization, and 1 patient in the intervention group and 2 patients in the control group died (Appendix 9 in the Supplementary Appendix).
DISCUSSION
The intervention was associated with improved outcomes among the joint primary disease-control measures in depressed patients with poorly controlled diabetes, coronary heart disease, or both. These four disease-control measures are associated with an increased risk of complications and death among patients with diabetes, coronary heart disease, or both.9,14,15,25-28 Patients in the intervention group (37%) were also more likely than patients who received usual care (22%) to meet guideline criteria or achieve clinically significant improvement from baseline values for control of glycated hemoglobin, LDL cholesterol, and systolic blood pressure and to have a decrease in systolic blood pressure of 10 mm Hg or more and a 1.0% or greater decrease in the glycated hemoglobin level.
Improvements in the primary outcomes in our study compared favorably with changes in single-condition quality-improvement trials. For example, a meta-analysis of 37 trials of collaborative care for depression showed an effect size of 0.25 (95% confidence interval [CI], 0.18 to 0.31)3 versus 0.67 in this trial. In a meta-analysis of 66 trials of diabetes care, the glycated hemoglobin level decreased by a mean of 0.42% (95% CI, 0.29 to 0.54)1 versus 0.58% in this study. In a systematic review of 44 trials, systolic blood pressure decreased by a mean of 4.5 mm Hg (95% CI, 1.8 to 6.6)29 versus 5.1 mm Hg in this trial. Although effects on the glycated hemoglobin level, LDL cholesterol level, and systolic blood pressure were modest, on a population level they may meaningfully decrease the risks of macrovascular and microvascular disease.28,30
Patients in the intervention group were more satisfied than controls with the care that they received for medical and psychological disorders. Satisfaction with care predicts enhanced self-care and more favorable outcomes.31 The intervention may have improved patient outcomes and satisfaction by systematically supporting both patients and the primary care team. Nurses enhanced patient self-care with education encompassing self-monitoring, behavioral activation (increase in enjoyable activities), goal setting, and problem solving to improve medication adherence. Weekly supervision and case reviews by attending physicians and nurses provided timely support for the primary care physician in adjusting medications to achieve specific clinical goals. These intervention components are consistent with evidence-based changes in primary care systems that are essential for improving outcomes in patients with chronic conditions.32
Patients with multiple medical conditions and depression have high health care costs.33 Those with three or more chronic conditions (43% of Medicare beneficiaries) account for more than 80% of Medicare health care costs.34 Coexisting depression is associated with increased morbidity, disability, and mortality and reduced quality of life.12,14,15 Developing effective models of care for such patients is a key challenge in improving the performance of health care systems.35 Our results suggest that an intervention involving coordinated efforts of physicians and nurses may facilitate the care of patients with multiple conditions within a primary care medical home.
The limitations of the present study include the lack of a control group with the same number of visits as the intervention group and inadequate power to examine between-group differences in rates of hospitalization or cardiovascular events. This trial was conducted in one health plan and used highly experienced nurses, potentially limiting generalizability. “Spillover” of the intervention is possible, since primary care physicians cared for patients in both the intervention and control groups; usual care was enhanced in the trial by notification of primary care physicians about depressive illness and the results of baseline, 6-month, and 12-month laboratory tests. Nevertheless, improvements in outcomes were significantly greater among patients in the intervention group (Appendix 10 in the Supplementary Appendix).
In summary, an intervention involving proactive follow-up by nurse care managers working closely with physicians, integrating the management of medical and psychological illnesses, and using individualized treatment regimens guided by treat-to-target principles improved both medical outcomes and depression in depressed patients with diabetes, coronary heart disease, or both.
Supplementary Material
Acknowledgments
Supported by grants (MH041739 and MH069741) from the Services Division of the National Institute of Mental Health (to Dr. Katon) and by institutional support from Group Health Cooperative.
Dr. Katon reports receiving support as an advisor to Wyeth and Eli Lilly and lecture fees from Wyeth, Eli Lilly, Forest, and Pfizer; Dr. Lin, serving on an advisory board for Physicians Postgraduate Press and receiving payment for a manuscript from Prescott Medical, lecture fees from HealthSTAR Communications (Eli Lilly), travel fees from the World Psychiatry Association, and a grant from the John A. Hartford Foundation; Dr. Von Korff, having a grant pending with Johnson & Johnson; Dr. Ciechanowski, serving on the editorial boards of Diabetic Living and Diabetes Forecast, owning Samepage, receiving lecture fees from Rewarding Health, having a patent for Samepage, and receiving travel fees from Roche Diagnostics; and Ms. McGregor, receiving travel and lecture fees from Group Health Cooperative.
We thank the patients, primary care physicians, consultants, and Group Health leaders for their support and participation; Tara Beatty, M.A., Malia Oliver, B.A., Sue Ruedebusch, R.N., Diana Griffith, R.N., and Sandy Randles, R.N., for their efforts and expertise; and Michelle Wong, M.P.H., M.P.P., R. James Dudl, M.D., and the Kaiser Permanente Care Management Institute for providing the treat-to-target diabetes guidelines that we adapted.
Footnotes
Disclosure forms provided by the authors are available with the full text of this article at NEJM.org.
No other potential conflict of interest relevant to this article was reported.
References
- 1.Shojania KG, Ranji SR, McDonald KM, et al. Effects of quality improvement strategies for type 2 diabetes on glycemic control: a meta-regression analysis. JAMA. 2006;296:427–40. doi: 10.1001/jama.296.4.427. [DOI] [PubMed] [Google Scholar]
- 2.McAlister FA, Lawson FM, Teo KK, Armstrong PW. Randomised trials of secondary prevention programmes in coronary heart disease: systematic review. BMJ. 2001;323:957–62. doi: 10.1136/bmj.323.7319.957. [DOI] [PMC free article] [PubMed] [Google Scholar]
- 3.Gilbody S, Bower P, Fletcher J, Richards D, Sutton AJ. Collaborative care for depression: a cumulative meta-analysis and review of longer-term outcomes. Arch Intern Med. 2006;166:2314–21. doi: 10.1001/archinte.166.21.2314. [DOI] [PubMed] [Google Scholar]
- 4.Schneider KM, O’Donnell BE, Dean D. Prevalence of multiple chronic conditions in the United States’ Medicare population. Health Qual Life Outcomes. 2009;7:82. doi: 10.1186/1477-7525-7-82. [DOI] [PMC free article] [PubMed] [Google Scholar]
- 5.Bodenheimer T, Berry-Millet R. Care management of patients with complex health care needs: research syntheses report. Princeton, NJ: Robert Wood Johnson Foundation; Nov, 2009. [PubMed] [Google Scholar]
- 6.Partnership for Solutions: a project of Johns Hopkins University and The Robert Wood Johnson Foundation. 2001 (http://www.partnershipforsolutions.org/partnership/index.html.
- 7.Peikes D, Chen A, Schore J, Brown R. Effects of care coordination on hospitalization, quality of care, and health care expenditures among Medicare beneficiaries: 15 randomized trials. JAMA. 2009;301:603–18. doi: 10.1001/jama.2009.126. [DOI] [PubMed] [Google Scholar]
- 8.American Diabetes Association. Standards of medical care in diabetes — 2008. Diabetes Care. 2008;31(Suppl 1):S12–S54. doi: 10.2337/dc08-S012. [DOI] [PubMed] [Google Scholar]
- 9.Smith SC, Jr, Allen J, Blair SN, et al. AHA/ACC guidelines for secondary prevention for patients with coronary and other atherosclerotic vascular disease: 2006 update: endorsed by the National Heart, Lung, and Blood Institute. Circulation. 2006;113:2363–72. doi: 10.1161/CIRCULATIONAHA.106.174516. Erratum, Circulation 2006; 113(22):e847. [DOI] [PubMed] [Google Scholar]
- 10.Mezuk B, Eaton WW, Albrecht S, Golden SH. Depression and type 2 diabetes over the lifespan: a meta-analysis. Diabetes Care. 2008;31:2383–90. doi: 10.2337/dc08-0985. [DOI] [PMC free article] [PubMed] [Google Scholar]
- 11.Lippi G, Montagnana M, Favaloro EJ, Franchini M. Mental depression and cardiovascular disease: a multifaceted, bidirectional association. Semin Thromb Hemost. 2009;35:325–36. doi: 10.1055/s-0029-1222611. [DOI] [PubMed] [Google Scholar]
- 12.Lin EH, Katon W, Von Korff M, et al. Relationship of depression and diabetes self-care, medication adherence, and preventive care. Diabetes Care. 2004;27:2154–60. doi: 10.2337/diacare.27.9.2154. [DOI] [PubMed] [Google Scholar]
- 13.Bush DE, Ziegelstein RC, Patel UV, et al. Post-myocardial infarction depression. Evid Rep Technol Assess (Summ) 2005;123:1–8. [PMC free article] [PubMed] [Google Scholar]
- 14.Katon WJ, Rutter C, Simon G, et al. The association of comorbid depression with mortality in patients with type 2 diabetes. Diabetes Care. 2005;28:2668–72. doi: 10.2337/diacare.28.11.2668. [DOI] [PubMed] [Google Scholar]
- 15.Lin EH, Rutter CM, Katon W, et al. Depression and advanced complications of diabetes: a prospective cohort study. Diabetes Care. 2010;33:264–9. doi: 10.2337/dc09-1068. [DOI] [PMC free article] [PubMed] [Google Scholar]
- 16.Arroll B, Goodyear-Smith F, Crengle S, et al. Validation of PHQ-2 and PHQ-9 to screen for major depression in the primary care population. Ann Fam Med. 2010;8:348–53. doi: 10.1370/afm.1139. [DOI] [PMC free article] [PubMed] [Google Scholar]
- 17.Riddle MC, Rosenstock J, Gerich J. The Treat-to-Target Trial: randomized addition of glargine or human NPH insulin to oral therapy of type 2 diabetic patients. Diabetes Care. 2003;26:3080–6. doi: 10.2337/diacare.26.11.3080. [DOI] [PubMed] [Google Scholar]
- 18.Rollnick S, Miller W. What is motivational interviewing? Behav Cogn Psychother. 1995;23:325–34. doi: 10.1017/S1352465809005128. [DOI] [PubMed] [Google Scholar]
- 19.Katon W, Ludman E, Simon G. The depression helpbook. Boulder, CO: Bull Publishing; 2003. [Google Scholar]
- 20.Derogatis LR, Lipman RS, Rickels K, Uhlenhuth EH, Covi L. The Hopkins Symptom Checklist (HSCL): a measure of primary symptom dimensions. Mod Probl Pharmacopsychiatry. 1974;7:79–110. doi: 10.1159/000395070. [DOI] [PubMed] [Google Scholar]
- 21.Guy W. ECDEU assessment manual for psychopharmacology. Rockville, MD: Department of Health, Education, and Welfare, National Institute of Mental Health; 1976. [Google Scholar]
- 22.Toobert DJ, Hampson SE, Glasgow RE. The summary of diabetes self-care activities measure: results from 7 studies and a revised scale. Diabetes Care. 2000;23:943–50. doi: 10.2337/diacare.23.7.943. [DOI] [PubMed] [Google Scholar]
- 23.Schmittdiel JA, Uratsu CS, Karter AJ, et al. Why don’t diabetes patients achieve recommended risk factor targets? Poor adherence versus lack of treatment intensification. J Gen Intern Med. 2008;23:588–94. doi: 10.1007/s11606-008-0554-8. [DOI] [PMC free article] [PubMed] [Google Scholar]
- 24.Roy J, Lin X, Ryan LM. Scaled marginal models for multiple continuous outcomes. Biostatistics. 2003;4:371–83. doi: 10.1093/biostatistics/4.3.371. [DOI] [PubMed] [Google Scholar]
- 25.Stratton IM, Adler AI, Neil HA, et al. Association of glycaemia with macrovascular and microvascular complications of type 2 diabetes (UKPDS 35): prospective observational study. BMJ. 2000;321:405–12. doi: 10.1136/bmj.321.7258.405. [DOI] [PMC free article] [PubMed] [Google Scholar]
- 26.Hansson L, Zanchetti A, Carruthers SG, et al. Effects of intensive blood-pressure lowering and low-dose aspirin in patients with hypertension: principal results of the Hypertension Optimal Treatment (HOT) randomised trial. Lancet. 1998;351:1755–62. doi: 10.1016/s0140-6736(98)04311-6. [DOI] [PubMed] [Google Scholar]
- 27.Gæede P, Vedel P, Larsen N, Jensen GVH, Parving H-H, Pedersen O. Multifactorial intervention and cardiovascular disease in patients with type 2 diabetes. N Engl J Med. 2003;348:383–93. doi: 10.1056/NEJMoa021778. [DOI] [PubMed] [Google Scholar]
- 28.Skyler JS, Bergenstal R, Bonow RO, et al. Intensive glycemic control and the prevention of cardiovascular events: implications of the ACCORD, ADVANCE, and VA Diabetes Trials: a position statement of the American Diabetes Association and a Scientific Statement of the American College of Cardiology Foundation and the American Heart Association. J Am Coll Cardiol. 2009;53:298–304. doi: 10.1016/j.jacc.2008.10.008. [DOI] [PubMed] [Google Scholar]
- 29.Walsh JM, McDonald KM, Shojania KG, et al. Quality improvement strategies for hypertension management: a systematic review. Med Care. 2006;44:646–57. doi: 10.1097/01.mlr.0000220260.30768.32. [DOI] [PubMed] [Google Scholar]
- 30.Adler AI, Stratton IM, Neil HA, et al. Association of systolic blood pressure with macrovascular and microvascular complications of type 2 diabetes (UKPDS 36): prospective observational study. BMJ. 2000;321:412–9. doi: 10.1136/bmj.321.7258.412. [DOI] [PMC free article] [PubMed] [Google Scholar]
- 31.Sherbourne CD, Hays RD, Ordway L, DiMatteo MR, Kravitz RL. Antecedents of adherence to medical recommendations: results from the Medical Outcomes Study. J Behav Med. 1992;15:447–68. doi: 10.1007/BF00844941. [DOI] [PubMed] [Google Scholar]
- 32.Wagner EH, Austin BT, Von Korff M. Organizing care for patients with chronic illness. Milbank Q. 1996;74:511–44. [PubMed] [Google Scholar]
- 33.Simon GE, Katon WJ, Lin EH, et al. Diabetes complications and depression as predictors of health care costs. Gen Hosp Psychiatry. 2005;27:344–51. doi: 10.1016/j.genhosppsych.2005.04.008. [DOI] [PubMed] [Google Scholar]
- 34.Anderson G, Horvath J. Chronic conditions: making the case for ongoing care. Princeton, NJ: Robert Wood Johnson Foundation’s Partnership for Solutions; 2002. [Google Scholar]
- 35.Institute of Medicine. Crossing the quality chasm: a new health system for the 21st century. Washington, DC: National Academies Press; 2001. [PubMed] [Google Scholar]
Associated Data
This section collects any data citations, data availability statements, or supplementary materials included in this article.