

Abstract
Clinically relevant formalin-fixed and paraffin-embedded (FFPE) tissues have not been widely used in neuroproteomic studies because many proteins are presumed to be degraded during tissue preservation. Recent improvements in proteomics technologies, from the 2D gel analysis of intact proteins to the “shotgun” quantification of peptides and the use of isobaric tags for absolute and relative quantification (iTRAQ) method has made the analysis of FFPE tissues possible. In recent years, iTRAQ has been one of the main methods of choice for high throughput quantitative proteomics analysis which enables simultaneous comparison of up to eight samples in one experiment. Our objective was to assess the relative merits of iTRAQ analysis of fresh frozen versus FFPE nervous tissues by comparing experimental autoimmune encephalomyelitis (EAE)-induced proteomic changes in FFPE rat spinal cords and frozen tissues. EAE-induced proteomic changes in FFPE tissues were positively correlated with those found in the frozen tissues, albeit with ~50% less proteome coverage. Subsequent validation of the enrichment of immunoproteasome (IP) activator 1 in EAE spinal cords led us to evaluate other proteasome and IP-specific proteins. We discovered that many IP-specific (as opposed to constitutive) proteasomal proteins were enriched in EAE rat spinal cords, and EAE-induced IP accumulation also occurred in the spinal cords of an independent mouse EAE model in a disability score-dependent manner. Therefore, we conclude that it is feasible to generate useful information from iTRAQ-based neuroproteomics analysis of archived FFPE tissues for studying neurological disease tissues.
Keywords: Immunoproteasome, experimental autoimmune encephalomyelitis, iTRAQ, formalin-fixed paraffin-embedded tissue, biomarker, mass spectrometry
Introduction
Proteomics technologies have offered unprecedented opportunities for the study of both central and peripheral nervous systems1. Rapid progress in quantitative proteomics methods have enabled the unbiased discovery of changes in the expression and post-translational modifications (PTM) of an ever-growing number of proteins in neurological disease models2. Proteomics technologies are widely used to discover novel biomarkers3, monitor disease progression4, 5, elucidate novel signal transduction pathways6, detect adverse effects of drugs7 and detect cell responses to environmental hazards8. Because cellular proteins are prone to proteolysis and chemical degradation during tissue processing and storage9, fresh or snap frozen tissues are the most desirable samples for use in proteomic investigations. In a clinical setting, however, it is not always practical or cost effective to rapidly collect and freeze a sufficient amount of nervous tissue for proteomics studies. In addition, unlike cancer, many CNS tissues can only be harvested within a few hours post-mortem, at which point massive proteolytic protein degradation events have already occurred10, 11. FFPE tissue archives are a valuable resource for retrospective proteomics biomarker or mechanistic studies. However, proteomics investigations of these samples have not been widely conducted due to the fact that the proteins in FFPE samples are believed to have been degraded during storage12, 13. In addition, formalin induces extensive cross-linkage between proteins and other molecular components in cells and tissues, making it difficult to extract sufficient intact proteins for conventional 2D gel-based proteomic studies14. In order to overcome this and other deficiencies associated with 2D gel analysis, including limited proteome coverage and sensitivity, newer quantitative proteomics methods have been developed. Typically, proteins are trypsin-digested into peptides that can be identified and quantified by sensitive tandem mass spectrometry (MS/MS) methods. The relative intensity of ion signals belonging to normal or PTM-peptides unique to a given protein can be used to extrapolate protein abundance and functional changes among different disease states or experimental conditions15. These types of analyses are called “shotgun” proteomics because tryptic peptides derived from total cellular protein digestion are usually randomly sequenced and quantified by mass spectrometers.
Shotgun proteomic quantification using the iTRAQ approach is among the most effective methods for the unbiased discovery of proteomic changes in diseased cells and tissues16. In iTRAQ, peptides derived from up to eight different biological conditions are first covalently conjugated to a set of eight different chemical “tags” with identical mass, i.e. isobaric; a mixture of labeled peptides can then be identified by MS/MS and the relative peptide abundance can be quantified by measuring the relative abundances of the isobaric tags. This method has been effectively used for the identification of novel proteomic changes in many neurological disease models, including changes of protein expression17, PTM18, and proteolysis19 in EAE spinal cords and other animal models of multiple sclerosis20. It is also an effective method for studying basic neurobiological systems, including peripheral neuroregeneration21, oligodendrocyte differentiation22 and the identification of potential targets for cocaine addiction treatment23. Because the iTRAQ method analyzes peptides instead of intact proteins, this method is effective for the quantification of peptides that can be extracted from FFPE tissue blocks or slides. Previously, we have used Liquid Tissue technology (Expression Pathology, MD) to extract peptides from FFPE slides, followed by iTRAQ technology to compare the relative expression of proteins among different FFPE human oral papilloma tissues24. Other studies have shown that proteins can be identified from various FFPE tissues with different degrees of efficiency14, 25–29. To our knowledge, a direct comparison of the relative merits of iTRAQ analyses of fresh versus FFPE tissues, especially in the context of nervous system tissues, has not been conducted. Therefore, to assess the relative effectiveness of iTRAQ analysis of FFPE tissues for neuroproteomics studies, we compared proteomic changes found by iTRAQ in FFPE rat EAE spinal cords with those observed in our previous study of freshly frozen tissues17
EAE is an animal model for multiple sclerosis, an autoimmune disease characterized by chronic inflammatory demyelination of the central nervous system (CNS)30, 31. EAE shares pathological features with human multiple sclerosis, including focal infiltration of spinal cords and other CNS tissues by lymphocytes and macrophages and immune cell-mediated damage to both myelin and axons32. EAE is typically induced by the immunization of genetically susceptible animals with immunogenic myelin components or by adoptive transfer with T cells that are reactive against CNS myelin antigens33–35. Distinct EAE models mimic specific facets or subtypes of multiple sclerosis, a complex disease with variable clinical courses33. For example, immunization of Lewis rats with myelin basic protein results in acute, monophasic EAE with progressive paralysis beginning 10 ± 12 days after immunization, followed by spontaneous remission and complete recovery within 8 ± 10 days36. EAE induced in C57BL/6 mice has other clinical and pathological features in common with human multiple sclerosis, i.e., a chronic disease course with relapses and nerve demyelination37. Based on iTRAQ neuroproteomics analysis of fresh frozen rat spinal cords, we have previously reported the identification of over 40 proteins with significantly altered abundance in EAE models compared to non-diseased controls17, including proteins involved in antigen processing, inflammation, neuroprotection and neurodegeneration. By comparison, we report in this study that FFPE treatment did not significantly affect iTRAQ quantification accuracy, although the detection sensitivity was reduced. We further explored the significance of PSME1 and other IP-specific proteins, which were among proteins found to be enriched in both FFPE and frozen samples, in EAE tissues.
Materials and Methods
Materials
HPLC-grade solvents and water were purchased from Mallinckrodt Baker, Inc., (Phillipsburg, NJ). Triethylammonium bicarbonate buffer (TEAB), protease inhibitor cocktail, phosphatase inhibitor cocktail I, and phosphatase inhibitor cocktail II were purchased from Sigma (St. Louis, MO). Tris(2-carboxyethyl)-phosphine (TCEP), methyl methanethiosulfonate (MMTS) and iTRAQ reagents were obtained from AB Sciex (AB, Foster City, CA). Sequencing grade modified trypsin was purchased from Promega Corp. (Madison, WI). PepClean C18 spin columns were purchased from Pierce (Rockford, IL). The Liquid Tissue® MS Protein Prep Kit was obtained from Expression Pathology (Rockville, MD).
EAE induction, disability evaluation and tissue harvesting
Both rat and mouse EAE models were used in this study. For the rat model, eight-week-old female Lewis rats were immunized with myelin basic protein emulsified in complete Freund's Adjuvant (CFA) or CFA/vehicle, as described previously38. For the mouse model, 8–10 weeks-old female C57BL/6 mice (Taconic, Hudson, NY) were immunized subcutaneously in the flank with 200 µg myelin oligodendrocyte glycoprotein peptide 35–55 (MEVGWYRSPFSRVVHLYRNGK; Stanford PAN Facility, Stanford, CA) emulsified in CFA that had been supplemented with M. tuberculosis strain H37RA (MT; Difco Laboratories, Detroit, MI) at 7 mg/ml. All mice also received an intraperitoneal injection of 350 ng pertussis toxin (List Biological, Campbell, CA) at 0 and 48 h post-immunization. Control mice received an emulsion containing only saline and adjuvant/MT. Animals were given food and water ad libitum and were monitored daily for clinical symptoms.
Rodent EAE disability severity was assessed with a 0–5 scoring system: no symptoms (0), tail weakness (0.5), tail paralysis (1), weakness in one hindlimb (1.5), weakness in both hindlimbs or paralysis of one hindlimb (2), weakness in one hindlimb and paralysis of one hindlimb (2.5), complete paralysis of both hindlimbs (3.0), tetraplegia (4), moribund (5). EAE stage 3 rats were used for iTRAQ proteomics and Western blotting comparison with the control rats. EAE stage 1–3 mice were also used for the biochemical analysis in this study. Animals were euthanized by exposure to CO2. The spinal cords were dissected, meninges were carefully removed, and the tissues were thoroughly rinsed with saline to remove blood. The lumbar spinal cord was immediately frozen on dry ice and then stored at −80 °C or fixed in formalin until later use. All animal handling protocols were performed according to institutional guidelines.
Fixation of rat spinal cords
After collection, the rat spinal cords were immediately immersed in a freshly prepared solution of 10% neutral buffered formalin and fixed for 24 h at room temperature. After fixation, the spinal cords were dehydrated through a graded alcohol series and embedded in paraffin wax. For iTRAQ analysis of the fixed tissues, 10 µm sections were cut from each paraffin block and placed on microscope slides. The slides were deparaffinized in xylene, rehydrated with 70% ethanol, and placed in distilled water for 1 min. An area of 16 mm2 (approximately 60,000 cells) was needle dissected from each tissue for protein/peptide extraction.
Protein Extraction and Digestion
Protocols for the sample preparation and iTRAQ labeling of fresh frozen rat tissues have been described in detail previously17, 19. Briefly, 15 mg of lumbar spinal cords from two controls and two EAE stage 3 rats were homogenized in 300 µl of a lysis buffer containing 25 mM TEAB (pH 8.0), 20 mM sodium carbonate and 2 µl of protease inhibitor cocktail. The supernatants obtained from centrifugation at 19,000 × g for 30 min were collected and adjusted to a pH of 8.0 with 0.1 M HEPES. For each control or EAE extract, the disulfides in 90 µg of protein were reduced with addition of 2 µl TCEP at 60 °C for 1 h, and the sample was then alkylated with addition of 1 µl of 200 mM MMTS and incubated at room temperature for 10 min. Then, 10 µg of trypsin was added to each of the four samples, followed by incubation at 37 °C overnight. The resulting peptides were labeled with the appropriate iTRAQ reagents, as described below.
For the analysis of needle-dissected FFPE rat spinal cord slides, peptide lysates from two control and two EAE stage 3 rats were prepared using the Liquid Tissue kit according to the manufacturer’s recommendations (Expression Pathology Inc., Gaithersburg, MD); this has been described in detail previously24. Briefly, cells from each sample were suspended in 20 µl of the Liquid Tissue buffer and heated at 95°C for 90 min, followed by cooling on ice for 2 min. Then, 1 µl of the trypsin reagent provided in the kit was added to each sample. The samples were incubated at 37°C for 1 h with vigorous shaking for 1 min at 20 min intervals and further incubated at 37°C overnight. After the digestion, samples were heated at 95°C for 5 min to deactivate the trypsin. The final peptide concentration of each sample was determined by a Micro BCA kit (Pierce, Rockford, IL, USA). Equal amount of peptides were dried completely using a Speed-Vac before further iTRAQ labeling.
iTRAQ Labeling and Tandem Mass Spectrometry
The iTRAQ manufacturer typically recommends that 50–100 µg of protein be used as the starting material for the iTRAQ chemical reaction. Therefore, we labeled peptides derived from 90 µg of proteins extracted from each frozen rat spinal cord. However, the Liquid Tissue extraction kit is optimized for processing only a small number of FFPE tissue slides with limited peptide yield. Consequently, only 12 µg of peptides extracted from each FFPE sample was processed for iTRAQ labeling. Labeling was conducted according to the manufacturer's protocol, with minor modifications (AB SCIEX, Foster City, CA). The 4-plex iTRAQ reagents were each dissolved in 100 µl of ethanol. Peptides obtained from frozen and FFPE tissues were labeled independently. For each iTRAQ labeling experiment, two groups of control peptides were labeled with iTRAQ tags 114 and 115 and EAE peptides were labeled with iTRAQ tags 116 and 117. Labeled peptides were then mixed and analyzed by two dimensional liquid chromatography coupled with tandem mass spectrometry (Fig. 1).
Fig. 1. Overview of iTRAQ analyses of FFPE and fresh frozen EAE tissues.

(A) FFPE spinal cord sections on microscope slides were de-paraffinized and processed using the Liquid Tissue kit according the manufacturer’s protocol. The resulting tryptic peptides from four animals (two controls and two EAE animals) were each labeled with a different iTRAQ reagent (annotated as 114 to 117, according to their size) and mixed together. (B) For fresh frozen tissue samples, following the initial extractions, proteins from four animals were reduced, alkylated, and subsequently digested by trypsin. The resulting tryptic peptides were labeled with iTRAQ reagents and mixed together. For both FFPE and frozen samples, mixtures of iTRAQ-labeled peptides were fractionated by two-dimensional liquid chromatography consisting of a strong cation exchange followed by reversed-phase HPLC. Separated peptides were analyzed by tandem mass spectrometry. Proteins and peptides were quantified using the iTRAQ reporter ion (A1 and B1) peak areas revealed in the tandem mass spectra and were identified by the b- and y- series of ion (A2 and B2).
iTRAQ-labeled peptide mixtures were dried completely using a Speed-Vac and re-suspended in 500 µl of solvent A (10 mM KH2PO4 and 20% acetonitrile (ACN), pH 2.7). Peptides were loaded onto a polysulfoethyl A strong cation exchange column (4.6 mm × 200 mm, 5 µm, 300 Å, Poly LC Inc., Columbia, MD) with an upstream guard column (4 mm × 10 mm) in solvent A at 1 ml/min. Elution was performed with a gradient of 0–60% solvent B (10 mM KH2PO4, 20% ACN, 600 mM KCl, pH = 2.7) over 60 min. Two minute fractions were collected and desalted via PepClean™ C18 spin columns. The second dimension reversed phase liquid chromatography was performed on an Ultimate™ Chromatography System equipped with a Probot matrix assisted laser desorption ionization (MALDI) spotting device (Dionex, Sunnyvale, CA). Desalted peptides from each ion exchange fraction were loaded onto a reversed phase 0.3 mm × 5 mm trapping column and resolved on a 75 µm × 150 mm capillary PepMap column (3 µm, 100 Å, C18, Dionex) using a 70 min step ACN gradient in 0.1% TFA, as described previously19. The HPLC eluent was mixed in a 1:3 ratio with the MALDI matrix (7 mg/ml alpha-cyano-4-hydroxycinnamic acid in 60% ACN, 5 mM ammonium monobasic phosphate and 50 fmol/µl each of the internal calibrants [Glu-1]-Fibrinopeptide B (Glu-Fib) and adrenocorticotropic hormone fragment 18–39 (ACTH(18–39)) through a 30 nl mixing tee and spotted onto the MALDI plates. Depending on instrument availability, the peptides were analyzed on either a 4700 (frozen samples) or a 4800 (FFPE samples) Proteomics Analyzer tandem mass spectrometer (AB Sciex) in a data-dependent fashion. MS spectra (m/z 800–3600) were acquired in positive ion mode with internal mass calibration. The ten most intense ions per MALDI spot were selected for subsequent tandem mass spectrometric (MS/MS) analysis in 1 keV mode. Each MS/MS spectrum was averaged over 2000 laser shots.
Protein database search
Peak lists for the database search were produced in the Mascot generic format (MGF) using TS2Mascot (Matrix Science, London, UK) from MS/MS spectra. Only MS/MS peaks with a mass from 20 Da to 60 Da below the precursor mass and an S/N ratio ≥ 10 were analyzed. The resulting MGF file was submitted for Mascot (version 2.3) search against rodent proteins (25,645 entries) from the SwissProt protein database (release date May 31, 2011). For the analysis of frozen spinal cord peptides, the following search parameters were used: iTRAQ 4plex (K), iTRAQ 4plex (N terminal) and methylthio (C) as fixed modifications; iTRAQ 4plex (Y) and oxidation (M) as variable modifications; trypsin as the digestive enzyme with a maximum of two missed cleavages allowed; monoisotopic peptide precursor ion tolerance of 50 ppm; and MS/MS mass tolerance of 0.3 Da. The database search parameters for the analysis of the FFPE spinal cord peptides were identical to those used for the frozen samples, but the methylthio (C) modification was omitted because MMTS alkylation was not part of the Liquid Tissue processing protocol. Scaffold (version Scaffold_3_01_08; Proteome Software, Inc., Portland, OR) was used to validate all MS/MS-based peptide and protein identifications. Peptide identifications were accepted if they could be established at a ≥ 95% probability, as specified by the Peptide Prophet algorithm, and with a <1% false discovery rate (FDR). Protein identifications were accepted if they could be established at a ≥ 99% probability, with a <1% FDR and contained at least one uniquely identified peptide. Protein probabilities were assigned by the Protein Prophet algorithm39. Proteins that contained similar peptides and could not be differentiated based on MS/MS analysis alone were grouped together to satisfy the principles of parsimony.
Relative peptide abundance in EAE and control tissues was quantified using centroided iTRAQ reporter ion peak intensity ratios and normalized based on the median ratio for each iTRAQ channel across all proteins. Quantitative protein ratios were calculated as the median of all uniquely assigned peptide ratios. Based on our prior knowledge of the analytical variability of this system20, proteins that exhibited a ≥20% increase or decrease in expression relative to the control were considered to be differentially expressed in EAE samples.
Western blotting
Lumbar spinal cord protein extracts obtained from control and EAE stage 3 rats (n=3 each) or control and EAE stage 1–3 mice (n = 3 each) were used for western blotting analyses. All tissues were homogenized on ice in 200 µl of a lysis buffer containing 10 mM HEPES (pH 8.0), 150 mM NaCl, 0.2% sodium azide, 0.1% SDS, 1% nonidet P-40, 0.5% deoxycholic acid, 0.2 mM phenylmethanesulfonyl fluoride, 2 µg/ml leupeptin, 2 µg/ml aprotinin, 2 µg/ml pepstatin and 50 mM NaF. After 20 min centrifugation at 14,000 × g at 4 °C, the supernatants were collected and 10 to 20 µg protein from each extract were resolved by 12% SDS-PAGE gels (Invitrogen, Carlsbad, CA) and electroblotted onto polyvinylidene difluoride membranes (PVDF, Invitrogen). The membranes were probed with antibodies against either proteasome, IP subunits or loading controls, specifically, proteasome activator complex subunit 1, (PMSE1, also known as PA28α, Cell Signaling, Danvers, MA, 1:1000 dilution), proteasome activator complex subunit 2 (PMSE2, also known as PA28β, Cell Signaling, 1:1000 dilution), proteasome activator complex subunit 3 (PSME3, also known as PA28γ, Cell Signaling, 1:1000 dilution), low molecular weight protein 2 (LMP-2, ENZO, Farmingdale, NY, 1:1000 dilution), low molecular weight protein 7 (LMP-7, ENZO, NY,1:1000 dilution), multicatalytic endopeptidase complex subunit (MECL-1, Santa Cruz Biotechnology, Santa Cruz, CA, 1:1000 dilution), 19S regulator, ATPase subunit Rpt1 (ENZO, NY, 1:2000 dilution), 19S regulator, non-ATPase subunit Rpn12 (ENZO, NY, 1:1000 dilution) and glyceraldehyde-3-phosphate dehydrogenase (GAPDH, Research Diagnostics, Inc., Concord, MA, 1:2000 dilution). Secondary antibody-coupled signals were detected using the ECL chemiluminescence method (Perkin-Elmer, Boston, MA). Band densities were quantified using Quantity One software (v. 4.3.1, Bio-Rad, Hercules, CA). All changes are expressed as fold-change relative to a control.
Proteasome activity assay
Proteasomal chymotrypsin-like activity in the mouse spinal cord extracts was measured by the hydrolysis of a fluorogenic substrate, Suc-LLVY-AMC40, 41. Briefly, spinal cords were disrupted by sonication, and the resulting lysates were centrifuged at 12,000 × g for 10 min. Equal amounts of protein lysate (10 µg in 20 µl) were mixed with either 250 ng of a proteasome inhibitor, epoxomicin (EPO, Boston Biochem, Cambridge, MA) in 50% DMSO or DMSO alone. A proteasome assay buffer (175 µl; 25 mM HEPES pH 7.5, 0.5 mM EDTA) containing 40 µM Suc-LLVY-AMC (Boston Biochem) was added to each reaction tube and the reaction was allowed to proceed for 60 min at 37 °C. The fluorescence of 7-amido-4-methylcoumarin (AMC), which is released upon the proteolysis of the substrate, was detected using a Tecan Infinite F200 detector. To distinguish non-specific chymotryptic activity from proteasome-derived activity, all assays were performed in the absence and presence of EPO. Proteasome-specific activity was calculated as activity without EPO treatment - activity with EPO treatment.
Statistics and Bioinformatics
P-values for each protein were derived via a two-tailed Student's t-test comparing the two EAE and two control values using Excel (Microsoft, Redmond, WA). The statistical significance of differential expression between EAE groups and controls was determined by Student’s t-test. A p-value ≤ 0.05 was considered statistically significant, while a P value ≤ 0.01 was considered highly significant. The functional classification of proteins altered in EAE spinal cords was determined by performing DAVID (http://david.abcc.ncifcrf.gov/) and KEGG (http://www.genome.jp/kegg/pathway.html) pathway analyses.
Results and discussion
Comparison of proteomics coverage in fixed and fresh frozen EAE spinal cords
Until recently, it was widely assumed that only proteins isolated from fresh or freshly frozen tissues can be effectively analyzed by proteomics approaches because many proteins are degraded in FFPE-preserved tissues. As such, proteomic investigations of neurodegenerative diseases have not been widely conducted on readily available and clinically relevant FFPE tissues. In order to determine the effectiveness of iTRAQ proteomics analyses of FFPE tissues, we compared the quantitative information obtained from a proteomics analysis of FFPE spinal cords with that obtained in our previous analysis of fresh frozen tissues17. We were able to quantify 262 unique proteins from 1155 unique peptides in FFPE samples (Table 1, Supplemental Table 1, Supplemental Scaffold file, “Fixed”), compared to 500 unique proteins and 2187 unique peptides quantified in the analysis of the frozen tissues (Table 1, Supplemental Table 2, Supplemental Scaffold file, “Fresh”). Among the identified proteins, 201 proteins were found in both samples (Fig. 2A). This difference is mainly due to the significantly lower amount of peptides (12 µg /animal) analyzed from the FFPE tissues relative to the amount of proteins processed from fresh frozen tissues (90 µg). This procedural difference was necessary because each Liquid Tissue extraction kit is optimized for the processing of only a small volume of FFPE tissue; this also approximates the situation in which only small amounts of precious clinical samples are available for analysis. Other plausible confounding factors that may reduce the proteome coverage of analyses of FFPE samples are the well known elements e.g. protein degradation13, protein modifications and cross-linking42 that occur during FFPE processing. Given these challenges, it is surprising that the difference in proteome coverage between these two approaches were not greater. It is likely that the difference in proteome coverage between the fresh frozen and FFPE spinal cords would be even smaller if similar amounts of proteins were analyzed. Overall, the likelihood of obtaining useful information from iTRAQ proteomics analysis of FFPE tissues is quite compelling. Given the ability of this approach to quantify a large number of proteins, proteomic changes can be directly correlated with the rich histological and pathological information that can be obtained from archived FFPE tissue slides.
Table 1.
Comparison of proteomics analyses of frozen and FFPE-fixed rat spinal cords
| Fresh Frozen | Formalin Fixed Paraffin Embedded |
|
|---|---|---|
| Protein amounts used | 90 µg | 12 µg |
| Instruments | ABI 4700 | ABI 4800 |
| No. of proteins identified | 500 | 262 |
| No. of unique peptides identified | 2187 | 1155 |
| Percentage of proteins up-regulated in EAE (≥ 1.2 fold%, p-value ≤ 0.05) | 11% | 11% |
| Percentage of proteins down-regulated in EAE (≤ 0.8 fold%, p-value ≤ 0.05) | 2% | 5% |
| Percentage of proteins un-changed | 87% | 84% |
Fig. 2. Comparison of proteins identified and quantified from FFPE and frozen spinal cords.

(A) A Venn diagram showing number of proteins uniquely identified in either FFPE (61) or fresh frozen samples (299). Shaded area (201) shows the number of proteins identified in both fixed and frozen spinal cords. (B) A scatter plot showing the iTRAQ expression ratios of proteins identified in both fixed (Supplemental Table 1) and fresh frozen samples (Supplemental Table 2). The iTRAQ ratios of most proteins were consistent between the two analyses. Most proteins were not changed between EAE and the control animals. Most changed proteins were up-regulated in EAE, presumably due to immune cell infiltration of the spinal cords.
Similar EAE-related proteomic changes in fixed and fresh frozen spinal cords
In addition to the qualitative effectiveness of iTRAQ analysis of FFPE spinal cords, this approach was also largely able to capture the same quantitative proteomic differences between EAE and controls that were found in the fresh frozen tissues. Although the number of proteins quantified in the fixed spinal cords was smaller than that in the frozen samples, the proportions of significantly up-regulated proteins in EAE spinal cords compared to the controls were the same (Fig. 2B): 11% in FFPE and 11% in frozen tissues, with 9 proteins found to be up-regulated are identified in both analyses (Table 2). Similarly, the proportions of EAE down-regulated proteins were also comparable in fixed (5%) and frozen samples (2%), with over 80% of proteins unaffected by EAE in either frozen or FFPE spinal cords (Fig. 2B). The higher number of elevated as opposed to decreased proteins in EAE spinal cords compared to control tissues is likely the result of immune cell infiltration at stage 3 of EAE pathology17. As seen in Fig. 2B, the iTRAQ ratios of most proteins were similar in both FFPE and frozen tissue analyses. For the evaluation of the proteome coverages in this study, we used rather stringent criteria for the comparison of proteins identified from the two independent proteomics studies. With a protein confidence interval cutoff of 99% and peptide C.I. (confidence interval) cutoff of 95%, the false discovery rates estimated from the forward-reverse database searches were less than 0.1% at both peptide and protein levels (see Supplemental Tables 1 and 2). Therefore, in order to achieve more in-depth comparison, we also compared proteins from the fixed tissues identified with less than 99% C.I. value, but containing a peptide with at least a 95% C.I. score, and was also identified from the fresh tissues with a protein identification C.I. values at or above 99% (Supplemental Table 2). Such extensive analysis reveals similar quantitative outcomes between the two methods at the peptide level (Fig. 3). For example, a peptide 37ISELDAFLK45 from PSME1/PA28α, a specific protein activator of IP, was identified as upregulated with EAE/control iTRAQ ratios of 1.9 in fixed spinal cords and 2.5 in fresh frozen samples (Fig. 3A–D). Another example is 126AWVAWQR132, a peptide derived from lysozyme C, with EAE/control iTRAQ ratios of 4.6 in fixed spinal cords and 4.9 in the fresh frozen samples (Fig. 3E–H). In addition to the similar quantitative outcomes of the FFPE and frozen tissue analyses, we observed that FFPE processing did not significantly affect the MS/MS spectral qualities of the peptide ions; comparable proportions of b- and y- ions were observed in the spectra of both analyses (Fig. 3B and D; F and H). These results indicate that quantitative information obtained from iTRAQ analysis of FFPE was not appreciably different from that of frozen tissues. The importance of this information is clear when we consider that only ~30,000 cells from FFPE spinal cord slides were analyzed, suggesting that FFPE tissue slides can be a good source of protein for quantitative iTRAQ quantification. Proteomics analysis of limited samples is common in clinical settings where only minute amounts of proteins are usually available, i.e., those retrieved from laser capture microdissection of cells from archived FFPE patient slides. Furthermore, with the continued development of more sensitive FFPE peptide recovery methods26, 28 and the availability of increasingly sensitive and accurate commercial mass spectrometers, e.g., LTQ Orbitrap and Triple TOF instruments, proteomics analyses of FFPE tissues will likely have significant and broad impacts in the future.
Table 2.
Proteins up-regulated in EAE spinal cords determined by iTRAQ analyses.
| Fresh Frozen | Formalin Fixed Paraffin Embedded |
||||
|---|---|---|---|---|---|
| Protein Name | Accession Numbera |
iTRAQ Ratio (E/C)b |
p-valuec | iTRAQ Ratio (E/C)b |
p-valuec |
| Actin, cytoplasmic 1 | ACTB_RAT | 1.5 | 0.05 | 1.3 | 0.03 |
| Alpha-1-macroglobulin | A1M_RAT | 2.9 | 0.04 | 1.7 | 0.01 |
| Apolipoprotein E | APOE_RAT | 2.3 | 0.00 | 3.3 | 0.01 |
| Ceruloplasmin | CERU_RAT | 2.6 | 0.04 | 2.2 | 0.01 |
| Heat shock protein beta-1 | HSPB1_RAT | 1.8 | 0.03 | 2.5 | 0.00 |
| Hemopexin | HEMO_RAT | 1.9 | 0.02 | 3.5 | 0.00 |
| Histone H2B type 1 | H2B1_RAT | 2.0 | 0.01 | 2.2 | 0.02 |
| Plastin-2 | Q5XI38_RAT | 3.2 | 0.02 | 2.6 | 0.03 |
| Vimentin | VIME_RAT | 1.7 | 0.01 | 1.8 | 0.01 |
SwissProt accession number.
iTRAQ Ratio E/C denotes iTRAQ ratio of EAE/Control
p-values were derived via the 2-tailed Student's t-test for each protein by comparing the two EAE with the two control values using Excel (Microsoft, Redmond, WA).
Fig 3. Sample MS/MS spectra from iTRAQ neuroproteomics analyses of FFPE and frozen spinal cords.

P28α peptide 37ISELDAFLK45 (FFPE, A–B; frozen, C–D) and Lysozyme C-1 peptide 126AWVAWQR132 (FFPE, E–F; frozen, G–H). Peptide sequences were deduced from MS/MS spectra based on the observation of a continuous series of either N-terminal (b-series) or C-terminal (y-series) ions (B, D, F and H). The peak areas (A, C, E and G) of iTRAQ quantification ions m/z 114–117 were used to measure the relative abundance of individual peptides. Red bars represents intensities in control samples (labeled with iTRAQ reagent 114 and 115) and green bar represents intensities in EAE samples (labeled with iTRAQ reagent 116 and 117). All the peptides shown here were more abundant in EAE samples; therefore, EAE peaks were elevated relative to the control peptide peaks (A, C, E and G). Quantitative information from iTRAQ was comparable between the analyses of fixed spinal cords and the frozen samples (A compared to C and E compare to G). Mass spectra (B compared to D and F compared to H) of the same peptide were comparable among fixed and fresh samples.
Accumulation of antigen processing and presentation proteins in EAE spinal cords
To gain novel insights into EAE pathology from these expression proteomics studies, we performed a Kyoto Encyclopedia of Genes and Genomes (KEGG) pathway analysis of all proteins that were found to be significantly dysregulated (at least 20% change from the controls, p≤0.05) in EAE animals from the current iTRAQ analysis of FFPE rat spinal cords and our previous analysis of frozen samples (Supplemental Table 2). Interestingly, we found that several upregulated proteins are significantly enriched in the MHC I and II antigen processing and presentation pathways (Fig. 4). This finding is not surprising, given that EAE is induced by immunization with auto-antigens and that multiple sclerosis is a disease with strong autoimmune components. Auto-reactive T cells are major mediators of multiple sclerosis pathology43–45. It has been reported that both CD4+ and CD8+ T cells contribute to MS disease initiation and progression46, 47. Auto antigen-reactive CD8+ T cells, typically clonally expanded and specific for myelin antigens, are found in patients early in the course of the disease48–50.
Fig. 4. Molecular pathway analysis of proteins upregulated in EAE.
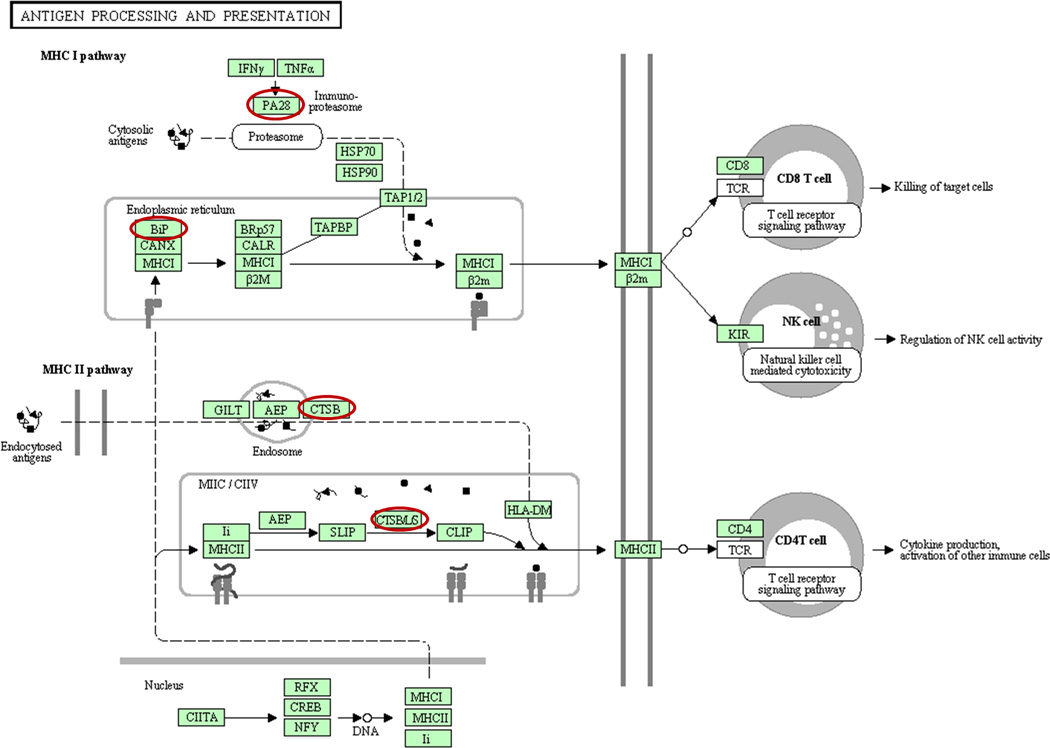
Using a DAVID (http://david.abcc.ncifcrf.gov) analysis protocol for KEGG database, proteins involved in antigen processing and presentation were found to be enriched in list of EAE-upregulated proteins compiled from the analyses of both FFPE and frozen spinal cords. EAE-upregulated proteins involved in antigen processing and presentation are highlighted. PA28 and BiP (heat shock 70 kDa protein) are involved in MHC I antigen processing, while CTSB (cathepsin B) and CTSB/L/S (cathepsin B, L and S) are involved in MHC II antigen processing and presentation.
The antigen bound on MHC-I and presented to the T cell receptors of CD8+ cells is normally produced by proteasomes or IPs (Immunoproteasomes), which do not have completely overlapping antigen proteolytic activities51–53. Among the proteins that were significantly upregulated (Supplemental Table 2) in both FFPE and fresh frozen rat EAE spinal cords was PA28α (Fig. 3A–D), an activator of IPs. Structurally, IPs differ from regular proteasomes in that the constitutive proteasomal subunits PSMB5, PSMB6, and PSMB7 are replaced with the inducible homologues PSMB8 (LMP7), PSMB9 (LMP2) and PSMB10 (MECL1). Two subunits in the cap are also replaced by subunits PA28α and PA28β, which are important for the activation of IP proteolytic and antigen processing activities53, 54. Both in vitro and in vivo studies have implicated PA28α and β in MHC class I antigen processing and thus in CD8+ T cell immune response55, 56. The detection of changes in PA28α expression in our proteomics analyses led us to evaluate the possibility that other IP-specific or proteasome components may also be affected by EAE but were not quantified due to low abundance. Therefore, we performed western blotting analyses to examine the expression of all IP-specific proteins in both control and EAE rat spinal cords. As shown in Fig. 5, the proinflammatory cytokine IFN-γ-inducible IP subunits LMP2, LMP7 and MECL1 and proteasome activator subunits PA28α and PA28β were significantly increased in EAE rats and were only marginally detectable in the control spinal cords. PA28γ appeared to be slightly elevated in EAE spinal cords, but this change was not statistically significant.
Fig 5. Western blot comparison of control and EAE immunoproteasome-specific proteins in rat spinal cords.

(A) Representative blots showing increased PA28α (~ 28 kDa), PA28β (~29 kDa), PA28γ (~30 kDa), LMP-2 (~22 kDa), LMP-7 (~25 kDa), and MECL-1 (~29 kDa) expression in EAE spinal cords. GAPDH (~40 kDa) was used as a loading control (n=3). (B) Western blot quantification using Quantity One software (Bio-Rad). *p< 0.05, ** p< 0.01.
Positive correlation of immunoproteasome protein accumulation in spinal cords and EAE pathology scores
The constitutive proteasome core complex, i.e., the 20S proteasome, is a cylindrical structure that consists of 28 subunits arranged in four stacked rings. The two outer rings, which are each composed of seven α subunits (α1– α7), frame the two inner rings, which are each made up of seven β subunits (β1– β7). During immune response activation, e.g., by IFN-γ and TNF-α, newly assembled proteasomes incorporate the induced subunits β1i (LMP2), β2i (MECL-1) and β5i (LMP7) in the place of the constitutive β-subunits (1, 2 and 5), thereby producing so-called IPs57. Constitutive proteasomes and IPs usually coexist in cells, but their ratios vary according to cell type, tissue and cellular environment58. The IP can cleave antigens with different cleavage preferences compared to constitutive proteasomes, thus altering antigen presentation by MHC class I molecules57.
In order to determine how general IP enrichment is in EAE animal models, we also analyzed IP-specific components in spinal cord extracts obtained from an independent mouse EAE model. Consistent with what we observed in the rat model, PA28α, PA28β, PA28γ, LMP2, LMP7 and MECL1 expression were all significantly enhanced during the course of the disease, beginning at E1 (tail weakness only) (Fig. 6A). In addition, a progressive increase in the abundance of IP-specific proteins was observed in the more advanced disability stages E2 (hindlimb weakness) and E3 (hindlimb paralysis), with ~5–12 fold increases compared to control tissue levels (Fig. 6A). Overall, the increase in IP-specific proteins in mouse EAE spinal cords appeared to be disease severity-dependent. This observation is consistent with gene expression profiling of CNS tissues in murine EAE models, which showed that LMP2, LMP7, MECL1 and PA28α are increased from disease onset to peak disability59. Furthermore, Fissolo et al. reported enhanced activities of proteasome subunits β1i (LMP2), β2, β2i (MECL1) and β5 in the CNS of EAE mice and that the symptoms of EAE mice were ameliorated by dual inhibition of proteasomal and lysosomal activities60. We found no significant EAE-induced changes in the regular proteasome components evaluated, including Rpt1 and Rpn12 (Fig. 6B), indicating that the enrichment of IP proteins is specific in the EAE models we examined (Fig. 6C–D). In addition, the chymotrypsin-like activities of constitutive proteasomes, as measured using the fluorogenic substrate Suc-LLVY-AMC, were comparable among EAE at E1 and E2 stages and the control mouse spinal cord extracts (Fig. 7). Overall, the increase in IP versus constitutive proteasome components suggests that MHC class I antigen presentation and CD8+ T cell activation may play a role in EAE development.
Fig. 6. Western blot comparison of immune- and constitutive proteasome proteins in mouse spinal cords during different phases of EAE.

(A) Representative blots showing EAE disability score-related increases in PA28α (~28 kDa), PA28β (~29 kDa), PA28γ (~30 kDa), LMP-2 (~22 kDa), LMP-7 (~25 kDa) and MECL-1 (~29 kDa). GAPDH (~40 kDa) is shown as a control. (n=3). E1: tail weakness; E2: hindlimb weakness; E3: hindlimb paralysis; C: controls. (B) Representative blots showing that the expression of the constitutive proteasome proteins Rpt1 (~48 kDa) and Rpn12 (~32 kDa) are unaffected in EAE. GAPDH was used as a loading control. (C and D) Western blot quantification using Quantity One software (Bio-Rad). Comparisons were made with the controls unless marked otherwise. *p< 0.05 and ** p< 0.01.
Fig. 7. Comparison of proteasomal chymotryptic activities in mouse spinal cords during different phases of EAE.

Enzyme activity was evaluated using the Suc-LLVY-AMC fluorogenic assay according to a standard method40. Non-proteasome-specific chymotrypsin activity was determined by adding epoxomicin to a separate reaction control; proteasome-specific activity was then determined by subtracting nonspecific activity from the total activity. *P<0.05 (n=2 for control, n=4 for EAE Stage 1, n=3 for EAE Stage 2 and n=3 for EAE Stage 3).
IPs regulate many physiological processes, including cytokine production and antigen processing, and IP dysfunction has been associated with several inflammatory pathologies, including multiple sclerosis and autoimmune disease61–63. Human IP proteins are not abundantly expressed in infants; however, they are readily detected in the brains of elderly individuals and patients affected by Alzheimer’s disease, Huntington’s disease, epilepsy and multiple sclerosis61, 64–67. For example, a 60HH variant of the IP-specific LMP2 gene has been correlated with altered MBP epitope generation and reduced risk of multiple sclerosis development in HLA-A*02+ Italian females61. However, in LMP2 knockout mice, MOG peptide-induced EAE symptoms were not significantly different compared to wild type animals68.
Immunoproteasomes as therapeutic targets for autoimmune disease
Given the changes in IP protein expression in EAE animals and the possible function of IP in autoantigen production in multiple sclerosis, drugs that modulate proteasome or IP function may be useful for the treatment of multiple sclerosis or EAE. Vanderlugt et al. reported that the proteasome inhibitor PS-519 can alleviate EAE symptoms, possibly via the downregulation of NF-κB69. Similarly, the HIV-1 protease inhibitor Ritonavir was shown to protect against EAE, presumably due to its ability to partially inhibit proteasome activity70. Further studies of whether these drugs can target both constitutive and immunoproteasomes will reveal whether these protective functions are constitutive or specific to the immunoproteasome.
In addition to multiple sclerosis, other autoimmune diseases also exhibit IP abnormalities. For example, circulating autoantibodies against MECL-1, LMP2 and LMP7 are increased in systemic lupus erythematosus (SLE) and Sjögren syndrome patients71–73. Interestingly, the efficacy of therapies targeting IP proteins have been demonstrated in different autoimmune disease models. PR-957, a selective inhibitor of IP LMP7, attenuated the progression of experimental arthritis in an animal model by blocking the presentation of MHC class I–restricted antigens and the production of cytokines IL-23, IFN-γ and IL-274. Furthermore, PR-957 also strongly reduced pathological inflammation and tissue destruction in dextran sulfate sodium-induced colitis75. It is unknown whether IP protein inhibitors are effective against EAE or multiple sclerosis. Future studies will be needed to explore the precise function of IP induction in EAE and the possible therapeutic uses of IP inhibitors for EAE or multiple sclerosis.
Future directions
Since a pioneer study by Hood et al.27, which showed that FFPE materials are accessible to proteomic analysis, much work has been done to enhance peptide recovery from FFPE tissues. By comparing buffers containing different concentrations of various detergents, Azimzadeh et al.29 concluded that a buffer containing 20 mM Tris-HCl, pH 8.8, 2% SDS, 1% β-octylglucoside, 200 mM DTT, 200 mM glycine and a mixture of protease inhibitors is optimal for achieving sensitive and reproducible peptide recovery from FFPE samples. Furthermore, Ostasiewicz et al.25 discovered that total proteomes, phosphoproteomes, and N-glycoproteomes can be effectively analyzed in FFPE samples using a filter-aided sample preparation method.
These developments will likely reduce the proteome coverage gap between analyses of FFPE and frozen tissues. Currently, neuronal tissue fixation protocols are not standardized and may vary from lab to lab; an optimized FFPE procedure that is reproducible and amenable to subsequent high peptide yield proteomics workflows will facilitate the achievement of the full potential for proteomics analysis of achieved FFPE patient samples. From our current study, it has been proven that iTRAQ-based quantitative analysis of proteins extracted from FFPE tissue is at par with that from fresh tissues. Since iTRAQ method allows comparing of up to eight samples in parallel, it would enable us to perform high throughput protein quantitative analysis from archived FFPE samples as compared to other quantitative techniques such as ICAT or SILAC, with less multiplexing capability. In an iTRAQ analysis, quantitative information is derived from tandem MS spectra which provide very accurate quantitative information for up to eight samples in a single experiment. Other quantitative labeling techniques such as ICAT rely on measuring the intensity of light/heavy parent ions in MS scans to derive the protein expression ratios and limited to compare only two samples in a single experiment. Further, classical SILAC approach is not appropriate for quantitative analysis of proteins in FFPE tissue samples, which are not easily amenable to in vivo labeled samples.
Conclusions
Our results have indicated that iTRAQ analysis of FFPE tissues is an effective method for the proteomic investigation of neurological disease animal models using archival clinical tissue slides. Among the many proteins induced in EAE, IP components may be used a biomarker for studying EAE pathology or as possible therapeutic targets for the clinical management of multiple sclerosis-related neurological disease. Similar retrospective proteomics studies can be conducted for other diseases for which patient tissues are preserved via FFPE and clinical data have been collected; these data may be directly correlated with proteomic changes. We envision that such studies can provide valuable insights into disease mechanisms and identify biomarkers for monitoring disease progression and evaluating therapeutic efficacies.
Supplementary Material
Acknowledgements
The project described was supported by a grant P30NS046593 from the National Institute of Neurological Disorders And Stroke. The content is solely the responsibility of the authors and does not necessarily represent the official views of the National Institute of Neurological Disorders And Stroke or the National Institutes of Health. The authors would also like to sincerely thank Dr. Marlene M. Darfler (Expression Pathology Inc.) for her technical assistance.
Abbreviations
- 2DE
2D-gel electrophoresis
- AMC
7-amido-4-methylcoumarin
- CFA
complete Freund's Adjuvant
- CNS
central nervous system
- EAE
experimental autoimmune encephalomyelitis
- EPO
epoxomicin
- FDR
false discovery rate
- FFPE
formalin-fixed and paraffin-embedded
- IP
immunoproteasome
- iTRAQ
isobaric tags for absolute and relative quantification
- LMP-2
low molecular weight protein 2
- LMP-7
low molecular weight protein 7
- MECL-1
multicatalytic endopeptidase complex subunit
- MHC
Major Histocompatibility Complex class I
- MS
multiple sclerosis
- PMSE1(PA28α)
proteasome activator complex subunit 1
- PMSE2(PA28β)
proteasome activator complex subunit 2
- PSME3(PA28γ)
proteasome activator complex subunit 3
- PTM
post translational modification
- TCEP
tris(2-carboxyethyl)-phosphine
- TCR
T cell receptor
- TEAB
triethylammonium bicarbonate
Footnotes
The authors report no conflict of interest.
References
- 1.Colucci-D'Amato L, Farina A, Vissers JP, Chambery A. Quantitative neuroproteomics: classical and novel tools for studying neural differentiation and function. Stem Cell Rev. 2011;7(1):77–93. doi: 10.1007/s12015-010-9136-3. [DOI] [PubMed] [Google Scholar]
- 2.Bayes A, Grant SG. Neuroproteomics: understanding the molecular organization and complexity of the brain. Nat Rev Neurosci. 2009;10(9):635–646. doi: 10.1038/nrn2701. [DOI] [PubMed] [Google Scholar]
- 3.Comabella M, Fernandez M, Martin R, Rivera-Vallve S, Borras E, Chiva C, Julia E, Rovira A, Canto E, Alvarez-Cermeno JC, Villar LM, Tintore M, Montalban X. Cerebrospinal fluid chitinase 3-like 1 levels are associated with conversion to multiple sclerosis. Brain. 2010;133(Pt 4):1082–1093. doi: 10.1093/brain/awq035. [DOI] [PubMed] [Google Scholar]
- 4.Di Domenico F, Owen JB, Sultana R, Sowell RA, Perluigi M, Cini C, Cai J, Pierce WM, Butterfield DA. The wheat germ agglutinin-fractionated proteome of subjects with Alzheimer's disease and mild cognitive impairment hippocampus and inferior parietal lobule: Implications for disease pathogenesis and progression. J Neurosci Res. 2010;88(16):3566–3577. doi: 10.1002/jnr.22528. [DOI] [PubMed] [Google Scholar]
- 5.Simon SL, Lamoureux L, Plews M, Stobart M, LeMaistre J, Ziegler U, Graham C, Czub S, Groschup M, Knox JD. The identification of disease-induced biomarkers in the urine of BSE infected cattle. Proteome Sci. 2008;6:23. doi: 10.1186/1477-5956-6-23. [DOI] [PMC free article] [PubMed] [Google Scholar]
- 6.Hsu PP, Kang SA, Rameseder J, Zhang Y, Ottina KA, Lim D, Peterson TR, Choi Y, Gray NS, Yaffe MB, Marto JA, Sabatini DM. The mTOR-regulated phosphoproteome reveals a mechanism of mTORC1-mediated inhibition of growth factor signaling. Science. 2011;332(6035):1317–1322. doi: 10.1126/science.1199498. [DOI] [PMC free article] [PubMed] [Google Scholar]
- 7.Egger M, Jurets A, Wallner M, Briza P, Ruzek S, Hainzl S, Pichler U, Kitzmuller C, Bohle B, Huber CG, Ferreira F. Assessing protein immunogenicity with a dendritic cell line-derived endolysosomal degradome. PLoS One. 2011;6(2):e17278. doi: 10.1371/journal.pone.0017278. [DOI] [PMC free article] [PubMed] [Google Scholar]
- 8.Li G, Lee LS, Li M, Tsao SW, Chiu JF. Molecular changes during arsenic-induced cell transformation. J Cell Physiol. 2011;226(12):3225–3232. doi: 10.1002/jcp.22683. [DOI] [PubMed] [Google Scholar]
- 9.Weist S, Brunkau C, Wittke J, Eravci M, Broedel O, Krause E, Stephanowitz H, Eravci S, Baumgartner A. Effects of thawing, refreezing and storage conditions of tissue samples and protein extracts on 2-DE spot intensity. Proteomics. 2010;10(7):1515–1521. doi: 10.1002/pmic.200900471. [DOI] [PubMed] [Google Scholar]
- 10.Skold K, Svensson M, Norrman M, Sjogren B, Svenningsson P, Andren PE. The significance of biochemical and molecular sample integrity in brain proteomics and peptidomics: stathmin 2–20 and peptides as sample quality indicators. Proteomics. 2007;7(24):4445–4456. doi: 10.1002/pmic.200700142. [DOI] [PubMed] [Google Scholar]
- 11.Fountoulakis M, Hardmeier R, Hoger H, Lubec G. Postmortem changes in the level of brain proteins. Exp Neurol. 2001;167(1):86–94. doi: 10.1006/exnr.2000.7529. [DOI] [PubMed] [Google Scholar]
- 12.Fergenbaum JH, Garcia-Closas M, Hewitt SM, Lissowska J, Sakoda LC, Sherman ME. Loss of antigenicity in stored sections of breast cancer tissue microarrays. Cancer Epidemiol Biomarkers Prev. 2004;13(4):667–672. [PubMed] [Google Scholar]
- 13.Xie R, Chung JY, Ylaya K, Williams RL, Guerrero N, Nakatsuka N, Badie C, Hewitt SM. Factors influencing the degradation of archival formalin-fixed paraffin-embedded tissue sections. J Histochem Cytochem. 2011;59(4):356–365. doi: 10.1369/0022155411398488. [DOI] [PMC free article] [PubMed] [Google Scholar]
- 14.Ahram M, Flaig MJ, Gillespie JW, Duray PH, Linehan WM, Ornstein DK, Niu S, Zhao Y, Petricoin EF, 3rd, Emmert-Buck MR. Evaluation of ethanol-fixed, paraffin-embedded tissues for proteomic applications. Proteomics. 2003;3(4):413–421. doi: 10.1002/pmic.200390056. [DOI] [PubMed] [Google Scholar]
- 15.Zybailov B, Coleman MK, Florens L, Washburn MP. Correlation of relative abundance ratios derived from peptide ion chromatograms and spectrum counting for quantitative proteomic analysis using stable isotope labeling. Anal Chem. 2005;77(19):6218–6224. doi: 10.1021/ac050846r. [DOI] [PubMed] [Google Scholar]
- 16.Ross PL, Huang YN, Marchese JN, Williamson B, Parker K, Hattan S, Khainovski N, Pillai S, Dey S, Daniels S, Purkayastha S, Juhasz P, Martin S, Bartlet-Jones M, He F, Jacobson A, Pappin DJ. Multiplexed protein quantitation in Saccharomyces cerevisiae using amine-reactive isobaric tagging reagents. Mol Cell Proteomics. 2004;3(12):1154–1169. doi: 10.1074/mcp.M400129-MCP200. [DOI] [PubMed] [Google Scholar]
- 17.Liu T, Donahue KC, Hu J, Kurnellas MP, Grant JE, Li H, Elkabes S. Identification of differentially expressed proteins in experimental autoimmune encephalomyelitis (EAE) by proteomic analysis of the spinal cord. J Proteome Res. 2007;6(7):2565–2575. doi: 10.1021/pr070012k. [DOI] [PMC free article] [PubMed] [Google Scholar]
- 18.Grant JE, Hu J, Liu T, Jain MR, Elkabes S, Li H. Post-translational modifications in the rat lumbar spinal cord in experimental autoimmune encephalomyelitis. J Proteome Res. 2007;6(7):2786–2791. doi: 10.1021/pr070013c. [DOI] [PMC free article] [PubMed] [Google Scholar]
- 19.Jain MR, Bian S, Liu T, Hu J, Elkabes S, Li H. Altered proteolytic events in experimental autoimmune encephalomyelitis discovered by iTRAQ shotgun proteomics analysis of spinal cord. Proteome Sci. 2009;7:25. doi: 10.1186/1477-5956-7-25. [DOI] [PMC free article] [PubMed] [Google Scholar]
- 20.Hu J, Qian J, Borisov O, Pan S, Li Y, Liu T, Deng L, Wannemacher K, Kurnellas M, Patterson C, Elkabes S, Li H. Optimized proteomic analysis of a mouse model of cerebellar dysfunction using amine-specific isobaric tags. Proteomics. 2006;6(15):4321–4334. doi: 10.1002/pmic.200600026. [DOI] [PMC free article] [PubMed] [Google Scholar]
- 21.Liu T, D'Mello V, Deng L, Hu J, Ricardo M, Pan S, Lu X, Wadsworth S, Siekierka J, Birge R, Li H. A multiplexed proteomics approach to differentiate neurite outgrowth patterns. J Neurosci Methods. 2006;158(1):22–29. doi: 10.1016/j.jneumeth.2006.05.010. [DOI] [PMC free article] [PubMed] [Google Scholar]
- 22.Tyler WA, Jain MR, Cifelli SE, Li Q, Ku L, Feng Y, Li H, Wood TL. Proteomic identification of novel targets regulated by the mammalian target of rapamycin pathway during oligodendrocyte differentiation. Glia. 2011;59(11):1754–1169. doi: 10.1002/glia.21221. [DOI] [PMC free article] [PubMed] [Google Scholar]
- 23.Reissner KJ, Uys JD, Schwacke JH, Comte-Walters S, Rutherford-Bethard JL, Dunn TE, Blumer JB, Schey KL, Kalivas PW. AKAP signaling in reinstated cocaine seeking revealed by iTRAQ proteomic analysis. J Neurosci. 2011;31(15):5648–5658. doi: 10.1523/JNEUROSCI.3452-10.2011. [DOI] [PMC free article] [PubMed] [Google Scholar]
- 24.Jain MR, Liu T, Hu J, Darfler M, Fitzhugh V, Rinaggio J, Li H. Quantitative Proteomic Analysis of Formalin Fixed Paraffin Embedded Oral HPV Lesions from HIV Patients. Open Proteomics J. 2008;1:40–45. doi: 10.2174/1875039700801010040. [DOI] [PMC free article] [PubMed] [Google Scholar]
- 25.Ostasiewicz P, Zielinska DF, Mann M, Wisniewski JR. Proteome, phosphoproteome, and N-glycoproteome are quantitatively preserved in formalin-fixed paraffin-embedded tissue and analyzable by high-resolution mass spectrometry. J Proteome Res. 2010;9(7):3688–3700. doi: 10.1021/pr100234w. [DOI] [PubMed] [Google Scholar]
- 26.Kawamura T, Nomura M, Tojo H, Fujii K, Hamasaki H, Mikami S, Bando Y, Kato H, Nishimura T. Proteomic analysis of laser-microdissected paraffin-embedded tissues: (1) Stage-related protein candidates upon non-metastatic lung adenocarcinoma. J Proteomics. 2010;73(6):1089–1099. doi: 10.1016/j.jprot.2009.11.011. [DOI] [PubMed] [Google Scholar]
- 27.Hood BL, Darfler MM, Guiel TG, Furusato B, Lucas DA, Ringeisen BR, Sesterhenn IA, Conrads TP, Veenstra TD, Krizman DB. Proteomic analysis of formalin-fixed prostate cancer tissue. Mol Cell Proteomics. 2005;4(11):1741–1153. doi: 10.1074/mcp.M500102-MCP200. [DOI] [PubMed] [Google Scholar]
- 28.Guzel C, Ursem NT, Dekker LJ, Derkx P, Joore J, van Dijk E, Ligtvoet G, Steegers EA, Luider TM. Multiple Reaction Monitoring Assay for Pre-eclampsia Related Calcyclin Peptides in Formalin Fixed Paraffin Embedded Placenta. J Proteome Res. 2011;10(7):3274–3282. doi: 10.1021/pr1010795. [DOI] [PubMed] [Google Scholar]
- 29.Azimzadeh O, Barjaktarovic Z, Aubele M, Calzada-Wack J, Sarioglu H, Atkinson MJ, Tapio S. Formalin-fixed paraffin-embedded (FFPE) proteome analysis using gel-free and gel-based proteomics. J Proteome Res. 2010;9(9):4710–4720. doi: 10.1021/pr1004168. [DOI] [PubMed] [Google Scholar]
- 30.Raine CS. Biology of disease. Analysis of autoimmune demyelination: its impact upon multiple sclerosis. Lab Invest. 1984;50(6):608–635. [PubMed] [Google Scholar]
- 31.Martin R, McFarland HF. Immunological aspects of experimental allergic encephalomyelitis and multiple sclerosis. Crit Rev Clin Lab Sci. 1995;32(2):121–182. doi: 10.3109/10408369509084683. [DOI] [PubMed] [Google Scholar]
- 32.Hickey WF. The pathology of multiple sclerosis: a historical perspective. J Neuroimmunol. 1999;98(1):37–44. doi: 10.1016/s0165-5728(99)00079-x. [DOI] [PubMed] [Google Scholar]
- 33.Wekerle H, Kojima K, Lannes-Vieira J, Lassmann H, Linington C. Animal models. Ann Neurol. 1994;36 Suppl:S47–S53. doi: 10.1002/ana.410360714. [DOI] [PubMed] [Google Scholar]
- 34.Steinman L. Assessment of animal models for MS and demyelinating disease in the design of rational therapy. Neuron. 1999;24(3):511–514. doi: 10.1016/s0896-6273(00)81107-1. [DOI] [PubMed] [Google Scholar]
- 35.van der Goes A, Dijkstra CD. Models for demyelination. Prog Brain Res. 2001;132:149–163. doi: 10.1016/S0079-6123(01)32072-1. [DOI] [PubMed] [Google Scholar]
- 36.Swanborg RH. Experimental autoimmune encephalomyelitis in rodents as a model for human demyelinating disease. Clin Immunol Immunopathol. 1995;77(1):4–13. doi: 10.1016/0090-1229(95)90130-2. [DOI] [PubMed] [Google Scholar]
- 37.Gold R, Hartung HP, Toyka KV. Animal models for autoimmune demyelinating disorders of the nervous system. Mol Med Today. 2000;6(2):88–91. doi: 10.1016/s1357-4310(99)01639-1. [DOI] [PubMed] [Google Scholar]
- 38.Nicot A, Ratnakar PV, Ron Y, Chen CC, Elkabes S. Regulation of gene expression in experimental autoimmune encephalomyelitis indicates early neuronal dysfunction. Brain. 2003;126(Pt 2):398–412. doi: 10.1093/brain/awg041. [DOI] [PubMed] [Google Scholar]
- 39.Nesvizhskii AI, Aebersold R. Analysis, statistical validation and dissemination of large-scale proteomics datasets generated by tandem MS. Drug Discov Today. 2004;9(4):173–181. doi: 10.1016/S1359-6446(03)02978-7. [DOI] [PubMed] [Google Scholar]
- 40.Glickman MH, Rubin DM, Coux O, Wefes I, Pfeifer G, Cjeka Z, Baumeister W, Fried VA, Finley D. A subcomplex of the proteasome regulatory particle required for ubiquitin-conjugate degradation and related to the COP9-signalosome and eIF3. Cell. 1998;94(5):615–623. doi: 10.1016/s0092-8674(00)81603-7. [DOI] [PubMed] [Google Scholar]
- 41.Kisselev AF, Goldberg AL. Monitoring activity and inhibition of 26S proteasomes with fluorogenic peptide substrates. Methods Enzymol. 2005;398:364–378. doi: 10.1016/S0076-6879(05)98030-0. [DOI] [PubMed] [Google Scholar]
- 42.Metz B, Kersten GF, Hoogerhout P, Brugghe HF, Timmermans HA, de Jong A, Meiring H, ten Hove J, Hennink WE, Crommelin DJ, Jiskoot W. Identification of formaldehyde-induced modifications in proteins: reactions with model peptides. J Biol Chem. 2004;279(8):6235–6243. doi: 10.1074/jbc.M310752200. [DOI] [PubMed] [Google Scholar]
- 43.Kerlero de Rosbo N, Milo R, Lees MB, Burger D, Bernard CC, Ben-Nun A. Reactivity to myelin antigens in multiple sclerosis. Peripheral blood lymphocytes respond predominantly to myelin oligodendrocyte glycoprotein. J Clin Invest. 1993;92(6):2602–2608. doi: 10.1172/JCI116875. [DOI] [PMC free article] [PubMed] [Google Scholar]
- 44.Zhang Y, Burger D, Saruhan G, Jeannet M, Steck AJ. The T-lymphocyte response against myelin-associated glycoprotein and myelin basic protein in patients with multiple sclerosis. Neurology. 1993;43(2):403–407. doi: 10.1212/wnl.43.2.403. [DOI] [PubMed] [Google Scholar]
- 45.Sun J, Link H, Olsson T, Xiao BG, Andersson G, Ekre HP, Linington C, Diener P. T and B cell responses to myelin-oligodendrocyte glycoprotein in multiple sclerosis. J Immunol. 1991;146(5):1490–1495. [PubMed] [Google Scholar]
- 46.Friese MA, Fugger L. Autoreactive CD8+ T cells in multiple sclerosis: a new target for therapy? Brain. 2005;128(Pt 8):1747–1763. doi: 10.1093/brain/awh578. [DOI] [PubMed] [Google Scholar]
- 47.Fugger L, Friese MA, Bell JI. From genes to function: the next challenge to understanding multiple sclerosis. Nat Rev Immunol. 2009;9(6):408–417. doi: 10.1038/nri2554. [DOI] [PubMed] [Google Scholar]
- 48.Jilek S, Schluep M, Rossetti AO, Guignard L, Le Goff G, Pantaleo G, Du Pasquier RA. CSF enrichment of highly differentiated CD8+ T cells in early multiple sclerosis. Clin Immunol. 2007;123(1):105–113. doi: 10.1016/j.clim.2006.11.004. [DOI] [PubMed] [Google Scholar]
- 49.Tsuchida T, Parker KC, Turner RV, McFarland HF, Coligan JE, Biddison WE. Autoreactive CD8+ T-cell responses to human myelin protein-derived peptides. Proc Natl Acad Sci U S A. 1994;91(23):10859–10863. doi: 10.1073/pnas.91.23.10859. [DOI] [PMC free article] [PubMed] [Google Scholar]
- 50.Dressel A, Chin JL, Sette A, Gausling R, Hollsberg P, Hafler DA. Autoantigen recognition by human CD8 T cell clones: enhanced agonist response induced by altered peptide ligands. J Immunol. 1997;159(10):4943–4951. [PubMed] [Google Scholar]
- 51.Sijts AJ, Ruppert T, Rehermann B, Schmidt M, Koszinowski U, Kloetzel PM. Efficient generation of a hepatitis B virus cytotoxic T lymphocyte epitope requires the structural features of immunoproteasomes. J Exp Med. 2000;191(3):503–514. doi: 10.1084/jem.191.3.503. [DOI] [PMC free article] [PubMed] [Google Scholar]
- 52.Gaczynska M, Rock KL, Goldberg AL. Gamma-interferon and expression of MHC genes regulate peptide hydrolysis by proteasomes. Nature. 1993;365(6443):264–267. doi: 10.1038/365264a0. [DOI] [PubMed] [Google Scholar]
- 53.Kloetzel PM, Ossendorp F. Proteasome and peptidase function in MHC-class-I-mediated antigen presentation. Curr Opin Immunol. 2004;16(1):76–81. doi: 10.1016/j.coi.2003.11.004. [DOI] [PubMed] [Google Scholar]
- 54.Rivett AJ, Hearn AR. Proteasome function in antigen presentation: immunoproteasome complexes, Peptide production, and interactions with viral proteins. Curr Protein Pept Sci. 2004;5(3):153–161. doi: 10.2174/1389203043379774. [DOI] [PubMed] [Google Scholar]
- 55.Rock KL, Goldberg AL. Degradation of cell proteins and the generation of MHC class I-presented peptides. Annu Rev Immunol. 1999;17:739–779. doi: 10.1146/annurev.immunol.17.1.739. [DOI] [PubMed] [Google Scholar]
- 56.Preckel T, Fung-Leung WP, Cai Z, Vitiello A, Salter-Cid L, Winqvist O, Wolfe TG, Von Herrath M, Angulo A, Ghazal P, Lee JD, Fourie AM, Wu Y, Pang J, Ngo K, Peterson PA, Fruh K, Yang Y. Impaired immunoproteasome assembly and immune responses in PA28−/− mice. Science. 1999;286(5447):2162–2165. doi: 10.1126/science.286.5447.2162. [DOI] [PubMed] [Google Scholar]
- 57.Van den Eynde BJ, Morel S. Differential processing of class-I-restricted epitopes by the standard proteasome and the immunoproteasome. Curr Opin Immunol. 2001;13(2):147–153. doi: 10.1016/s0952-7915(00)00197-7. [DOI] [PubMed] [Google Scholar]
- 58.Noda C, Tanahashi N, Shimbara N, Hendil KB, Tanaka K. Tissue distribution of constitutive proteasomes, immunoproteasomes, and PA28 in rats. Biochem Biophys Res Commun. 2000;277(2):348–354. doi: 10.1006/bbrc.2000.3676. [DOI] [PubMed] [Google Scholar]
- 59.Ibrahim SM, Mix E, Bottcher T, Koczan D, Gold R, Rolfs A, Thiesen HJ. Gene expression profiling of the nervous system in murine experimental autoimmune encephalomyelitis. Brain. 2001;124(Pt 10):1927–1938. doi: 10.1093/brain/124.10.1927. [DOI] [PubMed] [Google Scholar]
- 60.Fissolo N, Kraus M, Reich M, Ayturan M, Overkleeft H, Driessen C, Weissert R. Dual inhibition of proteasomal and lysosomal proteolysis ameliorates autoimmune central nervous system inflammation. Eur J Immunol. 2008;38(9):2401–2411. doi: 10.1002/eji.200838413. [DOI] [PubMed] [Google Scholar]
- 61.Mishto M, Bellavista E, Ligorio C, Textoris-Taube K, Santoro A, Giordano M, D'Alfonso S, Listi F, Nacmias B, Cellini E, Leone M, Grimaldi LM, Fenoglio C, Esposito F, Martinelli-Boneschi F, Galimberti D, Scarpini E, Seifert U, Amato MP, Caruso C, Foschini MP, Kloetzel PM, Franceschi C. Immunoproteasome LMP2 60HH variant alters MBP epitope generation and reduces the risk to develop multiple sclerosis in Italian female population. PLoS One. 2010;5(2):e9287. doi: 10.1371/journal.pone.0009287. [DOI] [PMC free article] [PubMed] [Google Scholar]
- 62.Zaiss DM, Bekker CP, Grone A, Lie BA, Sijts AJ. Proteasome Immunosubunits Protect against the Development of CD8 T Cell-Mediated Autoimmune Diseases. J Immunol. 2011;187(5):2302–2309. doi: 10.4049/jimmunol.1101003. [DOI] [PMC free article] [PubMed] [Google Scholar]
- 63.Tang SC, Lai KN. The ubiquitin-proteasome pathway and IgA nephropathy: a novel link? Kidney Int. 2009;75(5):457–459. doi: 10.1038/ki.2008.636. [DOI] [PubMed] [Google Scholar]
- 64.Mishto M, Ligorio C, Bellavista E, Martucci M, Santoro A, Giulioni M, Marucci G, Franceschi C. Immunoproteasome expression is induced in mesial temporal lobe epilepsy. Biochem Biophys Res Commun. 2011;408(1):65–70. doi: 10.1016/j.bbrc.2011.03.117. [DOI] [PubMed] [Google Scholar]
- 65.Mishto M, Bellavista E, Santoro A, Stolzing A, Ligorio C, Nacmias B, Spazzafumo L, Chiappelli M, Licastro F, Sorbi S, Pession A, Ohm T, Grune T, Franceschi C. Immunoproteasome and LMP2 polymorphism in aged and Alzheimer's disease brains. Neurobiol Aging. 2006;27(1):54–66. doi: 10.1016/j.neurobiolaging.2004.12.004. [DOI] [PubMed] [Google Scholar]
- 66.Diaz-Hernandez M, Martin-Aparicio E, Avila J, Hernandez F, Lucas JJ. Enhanced induction of the immunoproteasome by interferon gamma in neurons expressing mutant Huntingtin. Neurotox Res. 2004;6(6):463–468. doi: 10.1007/BF03033282. [DOI] [PubMed] [Google Scholar]
- 67.Diaz-Hernandez M, Hernandez F, Martin-Aparicio E, Gomez-Ramos P, Moran MA, Castano JG, Ferrer I, Avila J, Lucas JJ. Neuronal induction of the immunoproteasome in Huntington's disease. J Neurosci. 2003;23(37):11653–11661. doi: 10.1523/JNEUROSCI.23-37-11653.2003. [DOI] [PMC free article] [PubMed] [Google Scholar]
- 68.Frausto RF, Crocker SJ, Eam B, Whitmire JK, Whitton JL. Myelin oligodendrocyte glycoprotein peptide-induced experimental allergic encephalomyelitis and T cell responses are unaffected by immunoproteasome deficiency. J Neuroimmunol. 2007;192(1–2):124–133. doi: 10.1016/j.jneuroim.2007.09.024. [DOI] [PMC free article] [PubMed] [Google Scholar]
- 69.Vanderlugt CL, Rahbe SM, Elliott PJ, Dal Canto MC, Miller SD. Treatment of established relapsing experimental autoimmune encephalomyelitis with the proteasome inhibitor PS-519. J Autoimmun. 2000;14(3):205–211. doi: 10.1006/jaut.2000.0370. [DOI] [PubMed] [Google Scholar]
- 70.Hosseini H, Andre P, Lefevre N, Viala L, Walzer T, Peschanski M, Lotteau V. Protection against experimental autoimmune encephalomyelitis by a proteasome modulator. J Neuroimmunol. 2001;118(2):233–244. doi: 10.1016/s0165-5728(01)00352-6. [DOI] [PubMed] [Google Scholar]
- 71.Scheffler S, Kuckelkorn U, Egerer K, Dorner T, Reiter K, Soza A, Burmester GR, Feist E. Autoimmune reactivity against the 20S-proteasome includes immunosubunits LMP2 (beta1i), MECL1 (beta2i) and LMP7 (beta5i) Rheumatology (Oxford) 2008;47(5):622–626. doi: 10.1093/rheumatology/ken042. [DOI] [PubMed] [Google Scholar]
- 72.Egerer T, Martinez-Gamboa L, Dankof A, Stuhlmuller B, Dorner T, Krenn V, Egerer K, Rudolph PE, Burmester GR, Feist E. Tissue-specific up-regulation of the proteasome subunit beta5i (LMP7) in Sjogren's syndrome. Arthritis Rheum. 2006;54(5):1501–1508. doi: 10.1002/art.21782. [DOI] [PubMed] [Google Scholar]
- 73.Krause S, Kuckelkorn U, Dorner T, Burmester GR, Feist E, Kloetzel PM. Immunoproteasome subunit LMP2 expression is deregulated in Sjogren's syndrome but not in other autoimmune disorders. Ann Rheum Dis. 2006;65(8):1021–1027. doi: 10.1136/ard.2005.045930. [DOI] [PMC free article] [PubMed] [Google Scholar]
- 74.Muchamuel T, Basler M, Aujay MA, Suzuki E, Kalim KW, Lauer C, Sylvain C, Ring ER, Shields J, Jiang J, Shwonek P, Parlati F, Demo SD, Bennett MK, Kirk CJ, Groettrup M. A selective inhibitor of the immunoproteasome subunit LMP7 blocks cytokine production and attenuates progression of experimental arthritis. Nat Med. 2009;15(7):781–787. doi: 10.1038/nm.1978. [DOI] [PubMed] [Google Scholar]
- 75.Basler M, Dajee M, Moll C, Groettrup M, Kirk CJ. Prevention of experimental colitis by a selective inhibitor of the immunoproteasome. J Immunol. 2010;185(1):634–641. doi: 10.4049/jimmunol.0903182. [DOI] [PubMed] [Google Scholar]
Associated Data
This section collects any data citations, data availability statements, or supplementary materials included in this article.