Abstract
we introduce and compare three different modalities to study seismocardiogram (SCG) and its correlation with cardiac events. We used an accelerometer attached to the subject sternum to get a reference measure. Cardiac events were then approximately identified using echocardiography. As an alternative approximation, we used consecutive Cine-MRI images of the heart to capture cardiac movements and compared them with the experimental SCG. We also employed an anatomically accurate, finite element base electromechanical model with geometry built completely from DT-MRI to simulate a portion of the cardiac cycle as observed in the SCG signal. The preliminary results demonstrate the usability of these newly proposed methods to investigate the mechanism of SCG waves and also demonstrate the usability of echocardiograph in interpretation of these results in terms of correlating them to underlying cardiac cycle events.
Keywords: Cardiac Mechanics, Seismocardiography (SCG), Cine-MRI, DT-MRI, Image Processing, Deformable Mesh Generation, Echocardiography, Finite Element Method
I. INTRODUCTION
Seismocardiography is a technique used for analyzing the vibrations generated by the heart; it is recorded from the surface of the body using accelerometers [1]. During the past century, extensive research has been conducted on vibration signals that reflect the displacement, velocity, or acceleration of the body in response to the heart beating viz.: ballistocardiogram (BCG), seismocardiogram, and mechanocardiogram [2, 3 and 4]. These signals are normally recorded together with ECG and from these signals an understanding of the electromechanical performance of the heart can be achieved.
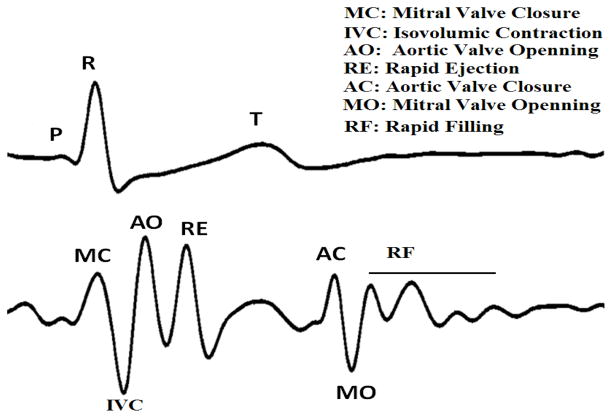
The seismocardiography was first introduced to clinical medicine by J. Zanetti (earthquake seismologist) and D. Salerno (cardiologist) in 1987. They borrowed the technology used in seismology to record the cardiac induced vibration from the surface of the body [1]. This signal was given the name Sternal Ballistocardiography as it was recorded from the sternum and had similarities to the ballistocardiogram [5]. New sensor technologies have provided new possibilities for portable and wireless sensors that can be worn under clothing to record the SCG signal during daily activities. A new line of research has emerged aiming to re-introduce SCG as a clinical instrument that can be used to noninvasively and inexpensively diagnose cardiac abnormalities [6 and 7]. A cycle of synchronous SCG and ECG is shown in Figure 1.
Figure 1.
A cycle of ECG (top) and SCG (bottom) signals and the sequence of cardiac events.
One of the main challenges for the SCG signal is to understand the meaning of its waves and their relations to underlying cardiac events. Considering the importance of Echocardiography for clinical cardiology, Salerno and his group used echocardiogram to relate these waves, to events in the cardiac cycle [8]. Based on their findings they claimed to be able to relate aortic and mitral valve opening and closure to specific peaks in the SCG signal. We could not confirm some of the findings as in Salerno’s work, nor could it be confirmed by another group recently setting up a similar research in France [9]. In particular, we found that using M-mode, the location of mitral valve opening was closer to the peak after the point assigned by Salerno. The group in France also could not assess the mitral valve opening time from their recorded signal. We assumed that this difference might be due to the fact that echocardiographs existing in early 1990’s, when the Salerno’s research was conducted, were not as good as the ones we have access to now.
In this research we have again chosen to use echocardiogram measurements as the gold standard, but we have also used two additional modalities to assist in further investigation of the origin of waves observed in SCG signal as explained below. There are two reasons to investigate for alternative solutions besides echocardiography. Firstly, echocardiography has limitations: being operator dependant, being dependant on the position of the transducer, and being limited to a few numbers of beats. Secondly, by using the Echo images alone we still do not clearly know how the underlying cardiac events create the waves observed on SCG as these cardiac events superimpose on each other and sometimes amplify or decrease each other’s effects as observed in the final signal recorded from the chest.
It should be noticed that the waves observed in SCG originate either from the heart or from the blood circulation in the main arteries. Our motivation in this research is to identify and investigate the waves originating from the heart ventricles by the approaches proposed in this paper. We focused on the ventricles in this research for two reasons, Firstly, the literature on SCG and BCG, stresses on the dominant effect of ventricles on the morphology of the signal and secondly, our current limitations in terms of model. Thus, the effects of arterial circulation and atria have not been studied in this research and will be investigated in future projects.
The research reported in this paper is a collaborative work with a goal of introducing three different modalities that can be used to study Seismocardiogram and to characterize its morphology. What we mean by characterization here is to relate each individual wave on the SCG signal to particular cardiac events. In the first method, image processing techniques have been applied to consecutive Cine-MRI images to extract SCG. In the second method, an anatomically accurate canine model of the heart ventricles has been used to simulate a portion of the cardiac cycle and overall cardiac movement, (a portion of SCG). In the third method, also used previously, echocardiograph images have been used to identify the waves observed in the simultaneous SCG signal and to further interpret the results obtained by the first two methods mentioned above.
II. Methods
In this section, the three modalities used in this study for the investigation of the SCG signal are briefly introduced.
A. Echocardiograph
It has been hypothesized in previous research that peaks and valleys observed in the SCG signal correspond to certain cardiac events such as aortic valve and mitral valve opening and closure. The idea behind our measurements was to further investigate these hypotheses by synchronous acquisition of Echocardiogram and SCG using GE Vivid-7. For aortic and mitral valve opening and closure we used M-mode, while for point of rapid ejection and rapid filling we used continuous Doppler. Figure 2 shows a synchronous Doppler and SCG that were used to assign the rapid ejection wave. The SCG signal was measured using a high sensitivity (1000 milivolts/g) accelerometer which was positioned on the sternum. The accelerometer sensor was factory calibrated, weighed 54 grams, and was connected to a charge amplifier [5]. The ECG signal was measured in two leads and the R-wave of the second lead of the ECG signal was used to identify SCG cycles.
Figure 2.
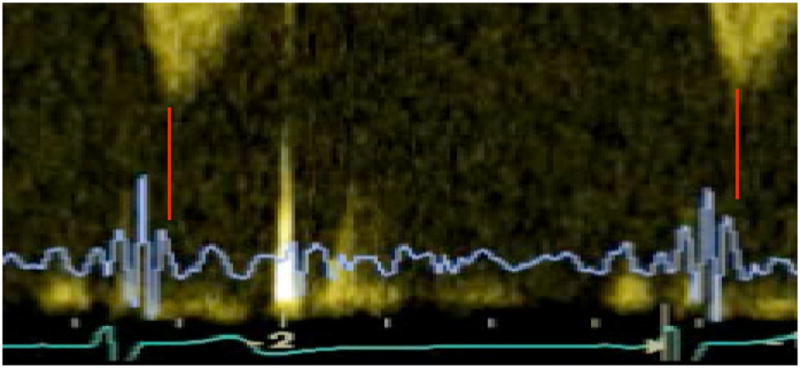
the simultaneous continuous Doppler, SCG (blue) and ECG (green) signals of a healthy heart.
B. Cine-MRI
In this study, we used Cine-MRI data base, which are publically available [10]. These de-noised images are in short axes and include 7 slices with thickness of 10 mm for each time acquisition and 30 frames [11 and 12]. To obtain heart geometry, we first applied snakes, or active contours, which have been widely used to locate boundaries of image segmentation. In this study, a fast minimization of snake model was used for segmenting 30 frames of Cine-MRI images [12]. This method provided a satisfactory result in extracting endocardium contours. In addition, epicardium contours were manually obtained. Figure 3a shows the results of segmentation in different views for a typical image stack. Using endo-epi contours, we stacked image slices for each time frame and obtained 30 volumes representing heart geometries and contraction for a cardiac cycle. By computing derivatives of this displacement we got velocity and acceleration. In addition, the high intensity contrast between myocardium and ventricular blood pool allows a rough segmentation of the blood pools based on the thresholding. Figure 3b shows the estimation left and right ventricular volumes in end-diastole state. By computing left and right ventricles volumes for all 30 frames we could get the left and right ventricular volume curves for a cardiac cycle.
Figure 3.
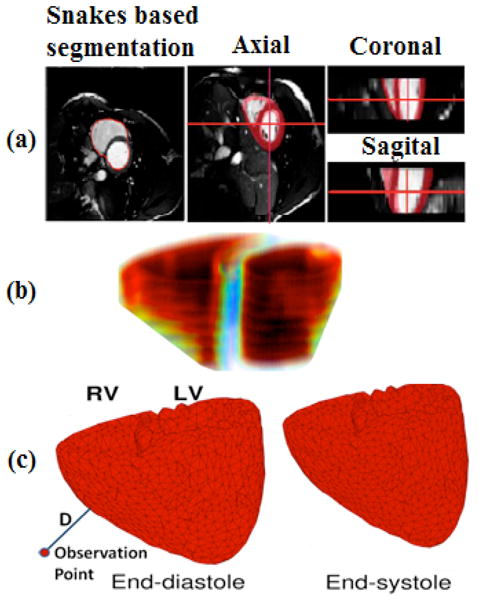
Cine-MRI based 3D model: a) Different views of Snakes based segmentation; b) Rough Estimation of left/right ventricle volumes in end-diastole; c) End-diastolic and end-systolic states of the ventricles obtained from cine MRI. Line labeled with D shows how we could use these deformable meshes to capture acceleration of cardiac vibrations by computing second derivative of D’s displacement changes over mesh deforms.
We then used the standard power crust algorithm to reconstruct a 3D surface of the first frame volume. The algorithm is based on the three-dimensional Voronoi diagram and Delaunay triangulation [13]. Then, for each of the 30 volumes, this surface mesh was deformed to fit with each of those volumes. We used mean square error to measure the degree of fitness. Figure 3c shows the generated triangle meshes for end-diastole and end-systole.
Using these deformable meshes we could observe cardiac vibration by monitoring the distance of observation point from the nearest mesh vertex, see Figure 3c. This displacement is an estimation of SCG-displacement at the observation point.
C. 3D Finite Element Electromechanical Model
We used a methodology for obtaining the electromechanical model from structural MRI and DT-MRI images of a canine heart. The heart geometry, which was obtained from MRI and DTMRI are described in detail in [14]. The ventricles were then separated from the atria using a semi-automated method. Trabeculae and papillary muscles were excluded from the ventricles for better mesh fitting purposes. Finite element meshes were generated by hiring 172 hexahedral finite elements with Hermite basis functions and 356 nodes. After a rough fitting of the mesh by manually adjusting the nodes, we used the least squares method for final fitting, see figure 4a. Finally fiber and laminar sheet directions were approximated from the diffusion tensors using least square method.
Figure 4.
Cardiac mechanics model: a) generated finite element mesh (anterior view). Arrow shows axis in which projection of acceleration for the center of mass was calculated; b) Cross-sectional snapshots during contraction with fiber strain (FS). Red shows stretching, while blue shows contraction. c) The anterior wall of the ventricles at end-diastole (ED) and end-systole (ES). Thick, black lines were included to make the twisting effect more obvious.
The 3D electromechanical model of the canine ventricles used in this study is composed of two parts, a cardiac mechanics component, and a bidomain electrical component, weakly coupled via a biophysical model of myofilament dynamics [15]. The mathematical description of the cardiac tissue in the electrical component of the model is based on the bidomain representation [16]. The mechanics component is based on continuous models of passive cardiac mechanics [17]. The circulatory model was incorporated to simulate all phases of the cardiac cycle [18].
Mechanical boundary conditions were defined by identifying tissue with restricted movement from animation frames created by cine MRI. It was found that tissue near the entrance of the pulmonary artery to the right ventricle and at the posterior wall was stationary. Therefore, we completely fixed the nodes in these locations for the model. In addition, we restricted the entire ventricular base to movement within a fixed plane. Figure 4b and 4c show contraction of the resulting cardiac mechanics model. Using this finite element based cardiac mechanics model, we could observe cardiac vibration by monitoring the acceleration of center of mass of the ventricles which is projected on the axis as shown in Figure 4a that is the direction from ventricles to accelerometer on the chest. The density of myocardium and blood were considered identical for simplicity sake. In this case, center of mass could be calculated by mean of divergence theorem using ventricular surface plus splines which cover orifices of the ventricles.
III. Results
A. Experimental SCG
After measuring SCG using an accelerometer attached to the sternum, we applied a band pass filter of [1–30] Hz to eliminate noise, motion artifact, and higher frequency signals including phonocardiogram. The resulting cleared signal was an ultra low frequency SCG as shown in Fig. 1. A simultaneous M-mode echocardiogram of the subjects was acquired from the parasternal long (or short) axis for detection of aortic and mitral valve opening and closure. Continuous wave Doppler was used in an apical five chamber view for detection of the peak of rapid systolic ejection; see Figure 2 for an example.
B. Cine- MRI driven SCG
We first roughly estimated left ventricle/right ventricle volumes by calculating blood pool using Cine-MRI frames. Figure 5 shows the results of these calculations. Based on an approach explained in the previous section, we then observed the acceleration of cardiac movement in an observation point (Figure 3c) by computing second derivative changes of distance D. We then smoothed the resulted signal to eliminate high frequency noises. In comparison to the experimental SCG, the derived signal was identical to the SCG signal shown in figure 1 in all parts except for rapid systolic ejection (RE) and rapid diastolic filling (RF) waves.
Figure 5.
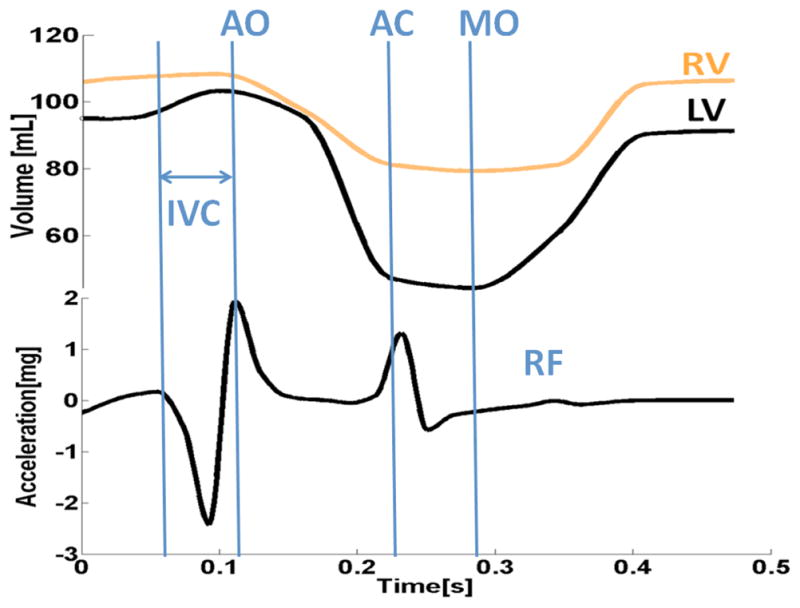
Cine-MRI results: Rough Estimation of left/right ventricular volumes and driven SCG in an observation point shown in Figure 3c.
C. Simulation of SCG waves using cardiac mechanics model
We finally simulated a canine heart contraction using the model explained in the previous section. Figure 4b shows cross-sectional snapshots during contraction with fiber strain. Red shows stretching, while blue shows contraction. Corresponding left ventricle and right ventricular volumes are shown in Figure 6. We then estimated cardiac vibration over a cardiac cycle by computing the center of mass acceleration in the direction shown in Figure 4a. This is different from the Cine-MRI method, which uses the Euclidian distance from the point of observation. The resulting signal is shown in Figure 6. This signal indicates some of the main waves in the SCG signal similar to the Cine-MRI findings. It should be mentioned that canine and human SCG are similar in terms of pattern. In particular iso-volumic contraction time can be observed as a valley between mitral valve closure and aortic valve opening.
Figure 6.
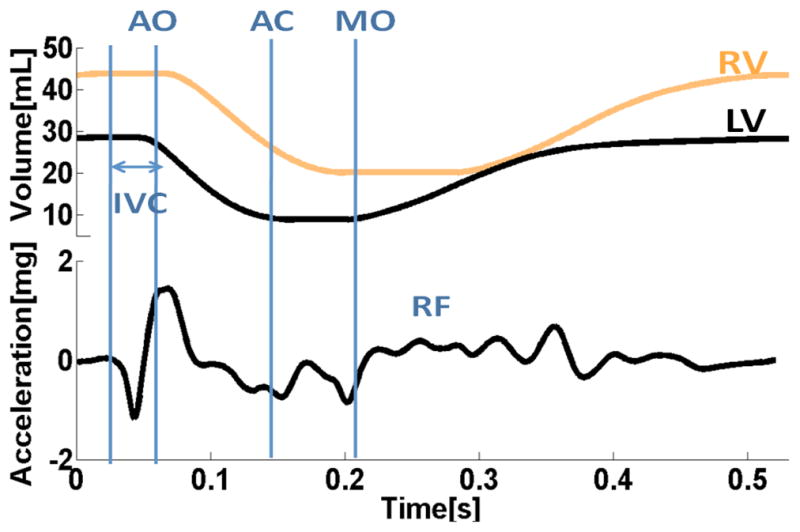
Cardiac mechanics model results: a) applied left and right ventricular volumes; b) Center of mass acceleration in the direction shown in Figure 4a.
IV. Discussion and Conclusion
In this study, novel approaches for characterization of SCG waves were proposed and the obtained preliminary results from the Cine-MRI and 3D finite element methods demonstrate the possibility of using these modalities for a thorough investigation of SCG signals.
Cine-MRI driven images provide an alternative method to extract cardiac vibrations from consecutive images and provide us with a new window to look into analysis of the dynamics of the heart. The similarity of the preliminary results obtained from this methodology to the signals acquired from subjects gives us hope that the proposed methodology is a useful tool for such an analysis. The current approach to drive SCG from Cine-MRI using Euclidean distance does not capture rapid systolic ejection and rapid diastolic waves properly. In Cine-MRI we can roughly estimate left and right ventricles volume using blood pools, which might help us in the near future to design an approach that captures these peaks with higher intensity.
In this study the electromechanical model indicated the cardiac events of iso-volumic contraction, relaxation periods and rapid filling. The same findings were agreed by Cine-MRI results, except for rapid filling. The model of SCG is the first model which is based on a 3D cardiac mechanics model with a realistic anatomy and tension generated by cardiac myofiliments.
The findings of Cine-MRI and cardiac mechanics model can be studied and confirmed with the results acquired from Echocardiograph images as has been proposed in this study. Compared to experimental measurements using an accelerometer, the Cine-MRI and cardiac mechanics model enables us to easily compute 3D cardiac vibrations in different observation points. It is expensive and time consuming to obtain similar information using multiple accelerometers and echocardiogram. Using image and model based modalities to reconstruct SCG would enable us to study the effect of arrhythmia and also respiration on the SCG signal’s morphology. For instance, disabling a sub-volume of deformable mesh in these modalities allows us to simulate ischemic cases. Other pathological cases could be simulated with these modalities as well, which is not possible with experimental measurement using accelerometers.
In close future, we will aim to assess segmental myocardial deformation and relative circumferential shortening strain from the Cine-MRI dataset using techniques explained in [19 and 20], which is vital in order to study pathological cases. In the near future we will be starting another study to apply our algorithms, as used in Cine-MRI to 3D+time Echocardiograph images, which allow us to record ECG/SCG simultaneously and tag cardiac events on the SCG signal. In parallel, we will extend our electromechanical model from canine to human.
Acknowledgments
This study was supported by both US (NIH grants R01-HL063195, R01-HL082729 and R01-HL067322, and NSF grant CBET-0601935) and Canadian grants. The study regarding the 3D cardiac mechanics model of the heart was supported in part by AHA post-doctoral fellowship #0725392U to V.G. We would like to thank Burnaby General Hospital, and in particular, Dr. Wilson Lee, Dr. Ali Vaseghi, Lisa Fear and Brandon Ngai for collaborating in data acquisition.
Footnotes
31st Annual International Conference of the IEEE EMBS
Minneapolis, Minnesota, USA, September 26, 2009
Contributor Information
Alireza Akhbardeh, Email: akhbardeh@jhu.edu, Computational and Electrophysiology lab, Department of Biomedical Engineering and Institute for Computational Medicine, Johns Hopkins University, 3400 N. Charles Street, CSEB Room 216, Baltimore, MD 21218 USA.
Kouhyar Tavakolian, Email: kouhyart@sfu.ca, Simon Fraser University, Burnaby, B.C., Canada.
Viatcheslav Gurev, Email: vgurev@jhu.edu, Computational and Electrophysiology lab, Department of Biomedical Engineering and Institute for Computational Medicine, Johns Hopkins University, 3400 N. Charles Street, CSEB Room 216, Baltimore, MD 21218 USA.
Ted Lee, Email: teduyu@jhu.edu, Computational and Electrophysiology lab, Department of Biomedical Engineering and Institute for Computational Medicine, Johns Hopkins University, 3400 N. Charles Street, CSEB Room 216, Baltimore, MD 21218 USA.
William New, Email: new.william@gmail.com, Simon Fraser University, Burnaby, B.C., Canada.
Bozena Kaminska, Email: kaminska@sfu.ca, Simon Fraser University, Burnaby, B.C., Canada.
Natalia Trayanova, Email: ntrayanova@jhu.edu, Computational and Electrophysiology lab, Department of Biomedical Engineering and Institute for Computational Medicine, Johns Hopkins University, 3400 N. Charles Street, CSEB Room 216, Baltimore, MD 21218 USA.
References
- 1.Salerno D, Zanetti J. Seismocardiography: A new technique for recording cardiac vibration. Concept, method and initial observation. J Cardiovasc Technol. 1990;9:111–117. [Google Scholar]
- 2.Starr I, Wood EC. Twenty Years Studies with the Ballistocardiograph, the Relation Between the Amplitude of the First Record of ‘Health’ Adults and Eventual Mortality and Morbidity form Heart Disease. Circulation. 1961;23:714–732. [Google Scholar]
- 3.Akhbardeh A, Junnila S, Koivuluoma M, Koivistoinen T, Turjanmaa V, Kööbi T, Värri A. Towards a Heart Disease Diagnosing System based on Force Sensitive chair’s measurement, Biorthogonal Wavelets and Neural Network classifiers. Engineering Applications on Artificial Intelligence. 2007;20(4):493–502. [Google Scholar]
- 4.Jansen BH, Larson BH, Shankar K. Monitoring of the ballistocardiogram with the static charge sensitive bed. IEEE Trans on Biomedical Eng. 1991;38(8):748–751. doi: 10.1109/10.83586. [DOI] [PubMed] [Google Scholar]
- 5.McKay WPS, Peter H, Gregon H, McKay B, Militzer J. Sternal acceleration ballistocardiography and arterial pressure wave analysis to determine stroke volume. Clin Invest Med. 1999;22(1):4–14. [PubMed] [Google Scholar]
- 6.Akhbardeh A, Kaminska B, Tavakolian K. BSeg++: A modified Blind Segmentation Method for Ballistocardiogram Cycle Extraction. 29th Annual International Conference IEEE Engineering in Medicine and Biology Society; Lyon, France. 2007. pp. 23–26. [DOI] [PubMed] [Google Scholar]
- 7.Tavakolian Kouhyar, Vaseghi Ali, Kaminska Bozena. Improvement of ballistocardiogram processing by inclusion of respiration information. Journal of Physiological Measurement, Institute of Physics. 2008;29:771–781. doi: 10.1088/0967-3334/29/7/006. [DOI] [PubMed] [Google Scholar]
- 8.Crow Richard S, Hannan Peter, Jacobs David, Hadquist Lowell, Salerno David M. Relationship between Seismocardiogram and Echocardiogram for Events in Cardiac Cycle. American Journal of Noninvasive Cardiology. 1994;8:39–46. [Google Scholar]
- 9.Giorgis L, Hernandez AI, Amblard A, Senhadji L, Cazeau S, Jauvert G, Donal E. Analysis of cardiac micro-acceleration signals for the estimation of systolic and diastolic time intervals in cardiac resynchronization therapy. Computers in Cardiology, 2008. 2008;35:393–396. [Google Scholar]
- 10.INRIA. Asclepios Research Project. https://gforge.inria.fr/frs/?group_id=726.
- 11.Toussaint N, Sermesant M, Fillard P. vtkINRIA3D: A VTK Extension for Spatiotemporal Data Synchronization, Visualization and Management. Proc. of Workshop on Open Source and Open Data for MICCAI; October 2007; Brisbane, Australia. [Google Scholar]
- 12.Toussaint N, Mansi T, Delingette H, Ayache N, Sermesant M. An Integrated Platform for Dynamic Cardiac Simulation and Image Processing: Application to Personalised Tetralogy of Fallot Simulation. Proc. Eurographics Workshop on Visual Computing for Biomedicine (VCBM); 2008; Delft, The Netherlands. [Google Scholar]
- 13.Zhang J, Liu J. Image Segmentation with Multi-Scale GVF Snake Model Based on B-Spline Wavelet. Eighth ACIS International Conference on Software Engineering, Artificial Intelligence, Networking, and Parallel/Distributed Computing; 2007. pp. 259–263. [Google Scholar]
- 14.Vadakkumpadan F, Rantner LJ, Tice B, Prassl A, Vigmond E, Plank G, Trayanova NA. Image-based models of cardiac structure with applications in arrhythmia and defibrillation studies. Journal of Electrocardiology. 2009;42:157.e1–157.e10. doi: 10.1016/j.jelectrocard.2008.12.003. [DOI] [PMC free article] [PubMed] [Google Scholar]
- 15.Rice JJ, Wang F, Bers DM, de Tombe PP. Approximate model of cooperative activation and crossbridge cycling in cardiac muscle using ordinary differential equations. Biophys J. 2008 doi: 10.1529/biophysj.107.119487. [DOI] [PMC free article] [PubMed] [Google Scholar]
- 16.Henriquez CS. Simulating the electrical behavior of cardiac tissue using the bidomain model. Crit Rev Biomed Eng. 1993;21:1–77. [PubMed] [Google Scholar]
- 17.Usyk T, Legrice I, McCulloch A. Computational model of three-dimensional cardiac electromechanics. Computing and Visualization in Science. 2002;4:249–257. [Google Scholar]
- 18.Kerckhoffs R, Neal M, Gu Q, Bassingthwaighte J, Omens J, McCulloch A. Coupling of a 3D Finite Element Model of Cardiac Ventricular Mechanics to Lumped Systems Models of the Sytemic and Pulmonic Circulation. Annals of Biomedical Engineering. 2007;35:1–18. doi: 10.1007/s10439-006-9212-7. [DOI] [PMC free article] [PubMed] [Google Scholar]
- 19.Phatak NS, Maas SA, Veress AI, Pack NA, Di Bella EVR, Weiss JA. Strain measurement in the left ventricle during systole with deformable image registration. Computerized Medical Imaging and Graphics. 2005;29:607–616. doi: 10.1016/j.media.2008.07.004. [DOI] [PMC free article] [PubMed] [Google Scholar]
- 20.Chenounea Y, Deléchellea E, Petita E, Goissenb T, Garotb J, Rahmouni A. Segmentation of cardiac cine-MR images and myocardial deformation assessment using level set methods. Medical Image Analysis. 2009;13:354–361. doi: 10.1016/j.compmedimag.2005.09.002. [DOI] [PubMed] [Google Scholar]


