Abstract
Objective
The purpose of this study was to develop a phantom-based experimental calibration method to minimize the reconstruction artifacts for the geometric misalignments of the digital tomosynthesis prototype.
Methods
A calibration phantom with ten fiducial markers was designed. Using this calibration phantom, the projection matrices of an experimental digital tomosynthesis prototype were acquired from each projection view under a series of misalignment conditions. The American College of Radiology mammography phantom was imaged and reconstructed with and without using the correction of the corresponding calibration projection matrices. The effectiveness of the calibration technique was then quantitatively analyzed through comparison of the calibrated and uncalibrated images.
Results
As the isocenter horizontal-shift increases, the reconstruction artifacts become clearly distinguishable. Using the calibration technique, the reconstruction artifacts resulting from the isocenter horizontal-shift were effectively minimized for the prototype.
Conclusions
For the specific experimental conditions utilized in this study, the phantom-based calibration method effectively reduced reconstruction artifacts for the prototype investigated in this study. The calibration method holds potential to benefit other tomosynthesis applications.
Keywords: Digital tomosynthesis, calibration, projection matrix, calibration phantom
1. Introduction
Digital x-ray tomosynthesis (DTS) has been thoroughly investigated for clinical applications and it holds a significant clinical role in medical diagnosis field [1–5]. In digital tomosynthesis imaging, the object projection images from multiple projection views are acquired over a limited angular range. The image quality of digital tomosynthesis crucially depends on the precise geometry of the imaging system. Experimental studies demonstrate that reconstruction artifacts may arise from the geometric misalignments of the digital tomosynthesis system such as the isocenter off-center, the tilt of the rotation axis and so on. Therefore, the calibration methods are needed to handle these potential misalignments of the tomosynthesis imaging system [6–8].
Many methods have been proposed to eliminate the geometric misalignment impacts on the tomosynthesis and tomography imaging. One of them introduced a calibration method based on the low spatial-frequency Fourier analysis of the projection data without requiring any knowledge of marker location [9]. In another method, the system geometric parameters were explicitly extracted using the specific calibration phantom and then applied in the tomosynthesis reconstruction [10]. Recently, several methods employed calibration phantoms to estimate a series of system geometric errors to reduce the geometric misalignment effect [11,12]. However, these methods were aimed at the whole system geometric configuration.
In this paper, a phantom-based calibration method was developed to calibrate the geometric misalignment of each projection view, respectively. Using the calibration phantom, a set of the projection matrices from all projection views were separately extracted, and then employed in subsequent tomosynthesis reconstruction to minimize reconstruction artifacts resulting from the geometric misalignments. Besides, the calibration reproducibility of the projection matrices ensures effective for the same system configuration. To validate the calibration effectiveness, tomosynthesis experiments were conducted with an ACR (American College of Radiology) phantom and the reconstructed images with and without calibration were compared.
2. Methods and materials
2.1. Phantom-based calibration experimental method
2.1.1. Projection matrix extraction
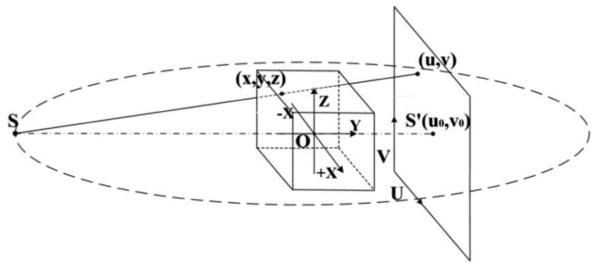
In the geometric coordinate system of tomosynthesis imaging, the coordinate (x, y, z) in the object space is projected onto the coordinate (u, v) in the detector plane. The schematic diagram of the system geometric relationship is shown in Fig. 1.
Fig. 1.
Schematic diagram illustrates the geometric relationship between the object space and the detector plane. The x-ray focal spot S, its projection S’ in the detector plane, and the system isocenter O are given, respectively.
Given an arbitrary object coordinate (x, y, z), its vector form in homogeneous coordinates is described as (x, y, z, 1)T , and its corresponding image coordinate (u, v) is expressed as (u, v, 1)T in homogeneous coordinates. Based on the space geometry theory, the mapping between the object coordinate and the corresponding projection can be expressed in the matrix form as follows [13,14]:
| (1) |
where w is a distance weighting factor and M3×4 represents the 3 × 4 projection matrix. Therefore, once the projection matrix M3×4 is extracted, it can be directly employed to calibrate the mis-mappings between the object coordinates and the corresponding projections. %2
| (2) |
Each pair of the object coordinate (xi,yi,zi) and its projection (ui,vi) must satisfy Eq. (1) and provides a set of two mapping equations in Eq. (2) [14]. Therefore, an exact solution of the projection matrix M requires at least twelve equations from more than six reference calibration points. Using the singular value decomposition (SVD) algorithm, the projection matrix M can be determined precisely. The source code of a program calculating the projection matrix is provided in the paper of Li et al. [14].
2.1.2. Reconstruction calibration based on projection matrix
For the digital tomosynthesis prototype, any geometric misalignment can lead to the mis-mappings from the object coordinates to the image coordinates. In the filtered backprojection (FBP) algorithm, the mis-mappings will inevitably involve the backprojection accuracy and cause the reconstruction artifacts. To perform the geometric calibration, a set of projection matrices from all projection views need to be collected before acquiring the object projection images. Subsequently the extracted projection matrices can be stored and applied in the tomosynthesis reconstruction as the whole procedure is repeatable. The detailed calibration process is explained as follows.
For an object coordinate (x, y, z) with the homogeneous coordinate vector A =(x, y, z, 1)T , the corresponding image homogeneous coordinate A’ =(u, v, 1)T can be calculated using the projection matrix M and expressed as [13,14,16]:
| (3) |
where ∞ represents that (u, v, 1)T is in the direct proportion to w · (u, v, 1)T . To acquire the normalized homogeneous vector A’, the distance weighting factor w in the vector w (u, v, 1)T is eliminated by the homogeneous coordinate normalization [13,14]. Hence the coordinate (u, · v) of the vector A’ represents the calibrated coordinate in the detector plane relevant to the object coordinate (x, y, z) [18].
Additionally, the insufficient projection dataset acquired from the tomosynthesis circular arc scanning trajectory can cause the intensity fall-off along the rotation axis in the tomosynthesis images. A reciprocal-cosine weighted compensation method was proposed to effectively correct the axial intensity fall-off in cone-beam tomography reconstruction [19]. Therefore, in this paper the weighted compensation method was introduced to correct the axial intensity fall-off in tomosynthesis reconstructed images as well.
With the calibration of the backprojection coordinates and the compensation of the axial intensity fall-off, the tomosynthesis image f (x, y0,z) at given thickness y0 can be reconstructed using the modified FDK algorithm below [15,18,19]:
| (4) |
where f (x, y0,z) represents the reconstructed image at the given thickness y0, β refers to the projection acquisition view angle, D is the source-to-isocenter distance, s = −x sin β + y cos β and t = x cos β + y sin β are the projection coordinates, P (u, v, β) represents the projection value of the calibrated projection coordinate (u, v) from projection view β [17,18], and C(x, y0,z) is the compensation weighted factor. Experimentally, C(x, y0,z) is assigned an optimal value of [17]. The simulation experiment proved the performance of the compensation method in digital tomosynthesis reconstruction.
In summary, the calibration method is divided into several steps: the calibration phantom imaging and the projection matrix extraction from each projection view, the backprojection coordinate calibration with the projection matrices for every projection view, the compensation of the axial intensity fall-off, and digital tomosynthesis reconstruction. The flow chart of the phantom-based calibration method is illustrated in Fig. 2.
Fig. 2.
Flow chart of the phantom-based calibration method.
2.1.3. Design of the calibration phantom
For the design of the calibration phantom, several factors must be considered. In terms of the calibration theory, the extraction of the projection matrices needs at least six calibration fiducial markers. Furthermore the distribution of the markers must cover the imaging field as much as possible, and any six of them are ensured to be non-coplanar. Therefore, a calibration phantom was designed and fabricated with the synthetic glass for this study. The schematic diagram of the calibration phantom is given in Fig. 3.
Fig. 3.
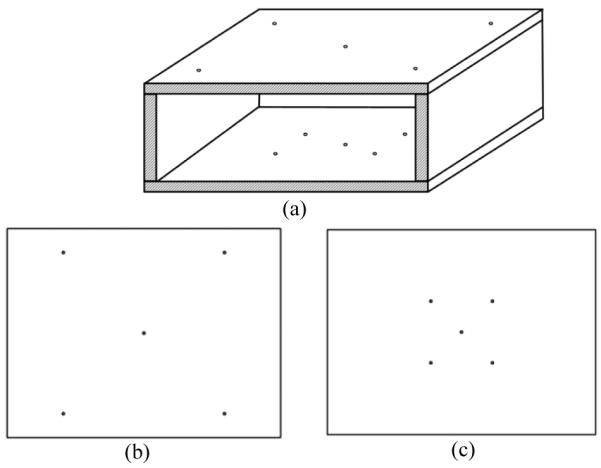
Schematic diagram of the calibration phantom (a) Calibration phantom with size of 150 mm × 100 mm × 50 mm contains two parallel panels with ten circular fiducial markers placed on it. (b) Top panel has five circular markers with one in the center and the other four on the vertices of an 80 mm × 80 mm square. (c) Bottom panel also has five circular markers with one in the center and the other four on the vertices of a 40 mm × 40 mm square.
The calibration phantom consists of two parallel panels, with one facing detector (top panel) and the other facing the x-ray exposure (bottom panel). Each panel measures 150 mm × 100 mm. The top panel has five circular apertures serving as fiducial markers with one in the panel center and the other four on the vertices of an 80 mm × 80 mm square. Similarly, the bottom panel also has five circular apertures with one in the panel center and the other four on the vertices of a 40 mm × 40 mm square. The diameter of the circular apertures is 1.5 mm. The overall dimensions of the phantom are 150 mm × 100 mm 50 mm.
2.2. Digital x-ray tomosynthesis prototype
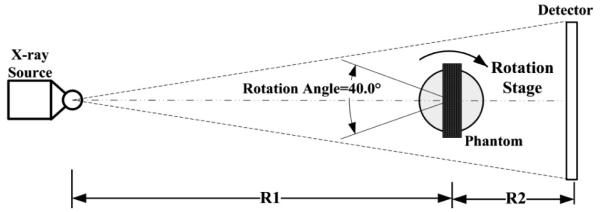
In this study, a digital x-ray tomosynthesis prototype was assembled with a high energy micro-focus x-ray source (Model: L8121-01, Hamamatsu Photonics, Japan), a high resolution computed radiography (CR) system (Model: REGIUS-190, Konica Minolta Medical Imaging, New Jersey), and a precision rotation stage (Model: UTR-80, Newport Corporation, USA) [20]. The CR system provides a pixel pitch of 43.75 μm, and the imaging size of plate was 240 mm by 300 mm. The rotation stage can provide angular position with 0.0167 degree accuracy, which can fully meet the requirements of the angular repeatability for the system rotating scan. All these components are mounted on an optical rail to facilitate the precise geometrical adjustments for various experiment conditions [20]. The schematic diagram of the digital tomosynthesis prototype system from the top view is shown in Fig. 4.
Fig. 4.
Schematic diagram of digital tomosynthesis prototype system.
In the experimental studies, phantoms were mounted on top of the rotation stage. Using the laser geometric alignment method, the x-ray focal spot, the system isocenter, and the center of the flat-panel detector are precisely aligned and kept collinear [20]. For the configurations of the digital tomosynthesis prototype, the source-to-detector distance R1 + R2 is 838.2 mm and the source-to-isocenter distance R1 is 685.8 mm. During the projection acquisition process, both the x-ray focal spot and the flat-panel detector remain stationary, and the rotation stage rotates phantoms through an angular range of 40° from 21 projection views [4,5].
ACR Phantom (Mammographic Accreditation Phantom, CIRS, USA) was designed to test the performance of an imaging system by the evaluation of the system’s ability to image small structures. Thus, the experiment selected ACR phantom to quantify the calibration effectiveness in minimizing reconstruction artifacts caused by geometric misalignments. The ACR phantom contains nylon fibers, Al2O3 specks, and round masses of different sizes and spatial locations and has its own 34 mm thick base and 3 mm thick cover simulating the compressed breast tissues.
2.3. Experimental method of digital x-ray tomosynthesis prototype
2.3.1. Experiment of isocenter shift impact on digital tomosynthesis imaging
For the experiment of isocenter shift impact, the ACR phantom was mounted on top of the rotation stage and scanned at 40 kVp and 168 mAs for the entire scan process. The precision of the rotation stageensures the angular position of each projection view. During image acquisitions, the ACR phantom was positioned with its base facing the tube.
To analyze the isocenter horizontal-shift impact, a translation stage was installed through which the system isocenter horizontally deviated from the central x-ray. In the experimental study, the isocenter offsets from the central x-ray were set at the positions of no shift, 0.35 mm shift, 0.7 mm shift, 1.05 mm shift, 1.4 mm shift and 1.75 mm shift along the negative X axis, respectively. The direction of negative X axis is shown in Fig. 1. For each of the isocenter horizontal-shifts, the projection images of the ACR phantom were collected from all 21 projection views. Finally the tomosynthesis images of each isocenter offset were reconstructed with the corresponding projection images, respectively.
2.3.2. Experiment of phantom-based calibration
In this experiment, the calibration phantom images were collected from all 21 projection views, respectively. For each projection view, all marker coordinates in detector plane were measured, and the projection matrix was calculated through the 3D-2D mappings of the markers using the SVD algorithm [14]. To acquire each set of projection matrices for different isocenter shifts, the isocenter offsets were also set at the same positions of no shift, 0.35 mm shift, 0.7 mm shift, 1.05 mm shift, 1.4 mm shift, and 1.75 mm shift, respectively. Next the corresponding set of the projection matrices for each isocenter shift were extracted and stored for the following calibration procedure.
The projection images of the ACR phantom were collected from all projection views under six different isocenter horizontal-shifts from 0 to 1.75 mm. For every isocenter horizontal-shift, the matching set of the projection matrices extracted above were employed to calibrate the mis-mapping projection coordinatesfor the tomosynthesis reconstruction. For the evaluation of the calibration method, the tomosynthesis images were separately reconstructed with and without calibration.
3. Results
3.1. Results of isocenter shift impact on digital tomosynthesis imaging
To improve the signal-to-noise ratio (SNR), the detector pixels were merged into 4 × 4 pixel binning mode with the binning pixel size of 0.175 mm. The digital tomosynthesis images of the ACR phantom were reconstructed with FDK algorithm.
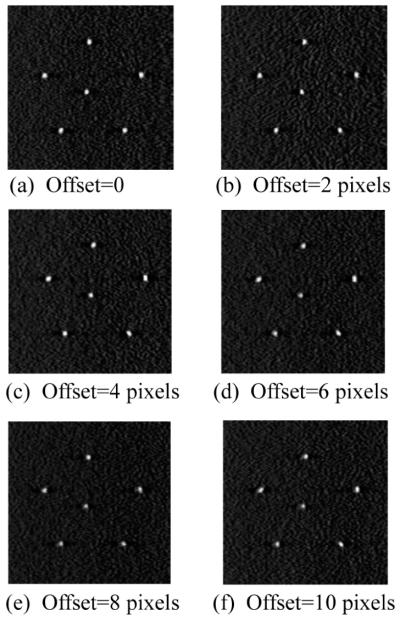
To analyze the impact of the isocenter shift, the tomosynthesis images of the ACR phantom were reconstructed for every isocenter horizontal-shift. For ease of comparison, the 0.54 mm speck group was cropped from the reconstructed in-plane images. The image comparisons of the 0.54 mm speck group with the isocenter no shift, 2 pixel (0.35 mm) shift, 4 pixel (0.7 mm) shift, 6 pixel (1.05 mm) shift, 8 pixel (1.4 mm) shift, and 10 pixel (1.75 mm) shift are shown in Fig. 5. All images of the 0.54 mm speck group were cropped with the mid speck as the center.
Fig. 5.
Reconstructed images of the 0.54 mm speck group with the isocenter (a) no shift, (b) 2 pixel shift, (c) 4 pixel shift, (d) 6 pixel shift, (e) 8 pixel shift, and (f) 10 pixel shift are given. The ACR phantom was imaged at 40 kVp and 168 mAs under 21 views ranging from −20°to 20°.
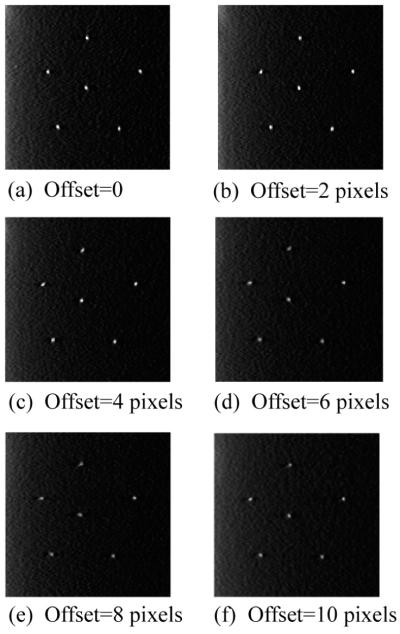
Likewise, the 0.40 mm speck group was also cropped from the reconstructed in-plane images for the point-by-point comparisons. Figure 6 shows the images of the 0.40 mm speck group with the isocenter no shift, 2 pixel shift, 4 pixel shift, 6 pixel shift, 8 pixel shift, and 10 pixel shift.
Fig. 6.
Reconstructed images of the 0.40 mm speck group with the isocenter (a) no shift, (b) 2 pixel shift, (c) 4 pixel shift, (d) 6 pixel shift, (e) 8 pixel shift, and (f) 10 pixel shift are given. The ACR phantom was imaged at 40 kVp and 168 mAs under 21 views ranging from −20° to 20°.
The image comparison between no shift and 10 pixel shift indicated that the isocenter off-center introduced by 10 pixel shift can cause the conspicuous tailing distortions and blurs of the specks. Upon observation of the reconstructed images, the tailing distortions and blurs becomes more apparent with the isocenter shift increase. The reconstruction artifacts of the 0.40 mm specks can’t be distinguished through unaided eye observation unless the isocenter horizontal-shift exceeds 1.05 mm. As a result, the evaluation of the isocenter shift impact on tomosynthesis reconstruction can provide a guideline to optimize system development of all digital x-ray tomosynthesis prototypes.
3.2. Results of phantom-based calibration
For each of the isocenter horizontal-shifts, the corresponding set of projection matrices were extracted using the 3D-2D mappings of the markers, and then employed to reconstruct the tomosynthesis images.
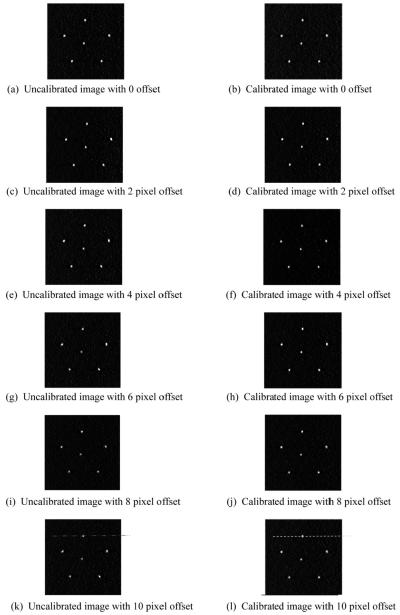
Like the previous experiment, the image pixels are also merged into 4 × 4 binning mode for the signal-to-noise ratio improvement. To assess the calibration effectiveness, the reconstructed in-plane images of 0.54 mm speck group were reconstructed with and without using the projection matrix calibration, respectively. For the comparisons of different isocenter horizontal-shifts, the uncalibrated and calibrated images of 0.54 mm speck group with the isocenter no shift, 2 pixel (0.35 mm) shift, 4 pixel (0.7 mm) shift, 6 pixel (1.05 mm) shift, 8 pixel (1.4 mm) shift, and 10 pixel (1.75 mm) shift are shown in Fig. 7.
Fig. 7.
Uncalibrated and calibrated image comparisons of 0.54 mm speck group with the isocenter no shift, 2 pixel shift, 4 pixel shift, 6 pixel shift, 8 pixel shift, and 10 pixel shift. The ACR phantom was scanned at 40 kVp and 168 mAs under 21 views ranging from −20° to 20°.
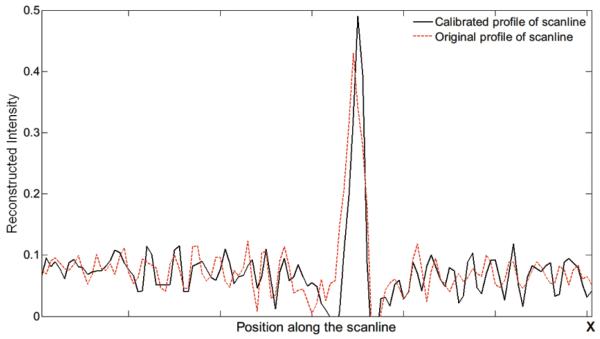
Generally the speck distortions and blurs can be respectively reflected from the speck reconstructed width and the voxel intensity value. In this study, the width of the speck intensity profile and the maximal voxel intensity are defined as the reconstructed width and voxel intensity of the speck. Therefore, the top speck of the 0.54 mm speck group was investigated to quantify the effect of the calibration method. Two horizontal dotted lines across the top speck in Fig. 7 (k) and (l) were marked for tracing the voxel intensities, respectively. The voxel intensities along the two lines were both plotted in Fig. 8.
Fig. 8.
The profiles of the horizontal scanlines across the top speck in Fig. 7 (k) and (l).
For all six isocenter horizontal-shifts, the speck width and the voxel intensity of the 0.54 mm top speck were respectively presented in Table 1.
Table 1.
The speck width and the voxel intensity of 0.54 mm top speck for six isocenter horizontal-shifts
| Isocenter shift | 0 shift | 2 pixel shift | 4 pixel shift | 6 pixel shift | 8 pixel shift | 10 pixel shift |
|---|---|---|---|---|---|---|
| Uncalibrated width | 3 pixels | 3 pixels | 3 pixels | 3 pixels | 4 pixels | 4 pixels |
| Calibrated width | 3 pixels | 3 pixels | 3 pixels | 3 pixels | 3 pixels | 3 pixels |
| Uncalibrated intensity | 0.54 | 0.52 | 0.48 | 0.47 | 0.45 | 0.42 |
| Calibrated intensity | 0.55 | 0.54 | 0.52 | 0.52 | 0.51 | 0.49 |
Upon observation of Table 1, with the calibration method the speck distortions were minimized by one pixel and the reconstructed intensity was calibrated from 0.42 to 0.49 for the 0.54 mm speck group under 10 pixel isocenter shift.
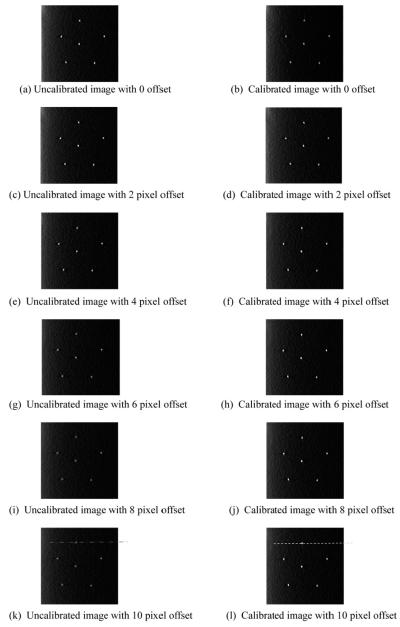
Similarly, Fig. 9 gave the uncalibrated and calibrated image comparisons of 0.40 mm speck group with the isocenter no shift, 2 pixel (0.35 mm) shift, 4 pixel (0.7 mm) shift, 6 pixel (1.05 mm) shift, 8 pixel (1.4 mm) shift, and 10 pixel (1.75 mm) shift.
Fig. 9.
Uncalibrated and calibrated image comparisons of 0.40 mm speck group with the isocenter no shift, 2 pixel shift, 4 pixel shift, 6 pixel shift, 8 pixel shift, and 10 pixel shift. The ACR phantom was scanned at 40 kVp and 168 mAs under 21 views ranging from −20° to 20°.
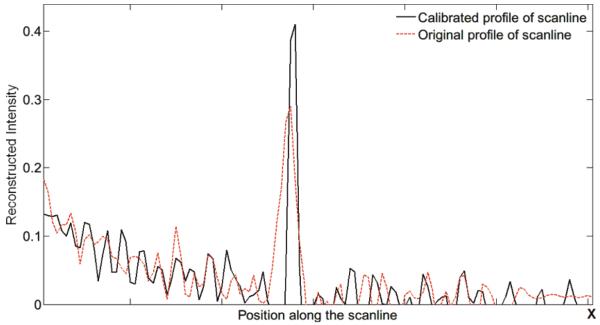
Likewise, the voxel intensities of the horizontal scanlines across the top 0.40 mm speck in Fig. 9 (k) and (l) were both plotted in Fig. 10.
Fig. 10.
The profiles of the horizontal scanlines across the top speck in Fig. 9 (k) and (l).
Table 2 showed the speck reconstructed width and voxel intensity of the 0.40 mm top speck under different isocenter horizontal-shifts, respectively.
Table 2.
The speck width and the voxel intensity of 0.40 mm top speck for six isocenter horizontal-shifts
| Isocenter shift | 0 shift | 2pixel shift | 4pixel shift | 6pixel shift | 8pixel shift | 10pixel shift |
|---|---|---|---|---|---|---|
| Uncalibrated width | 2 pixels | 2 pixels | 2 pixels | 3 pixels | 3 pixels | 4 pixels |
| Calibrated width | 2 pixels | 2 pixels | 2 pixels | 2 pixels | 2 pixels | 2 pixels |
| Uncalibrated intensity | 0.49 | 0.42 | 0.37 | 0.35 | 0.31 | 0.27 |
| Calibrated intensity | 0.51 | 0.49 | 0.47 | 0.45 | 0.43 | 0.41 |
Evidently the calibration method minimized the speck distortion by 2 pixels and calibrated the reconstructed intensity from 0.27 to 0.41 for the 0.40 mm speck group under 10 pixel isocenter shift.
The quantitative analysis demonstrated that the calibration method can effectively minimize the reconstructed distortions and blurs of the specks even under big isocenter horizontal-shifts. Thus the calibration method can produce favorable results for the reconstruction artifact reduction caused by the system geometric misalignments.
4. Discussion and conclusion
In recent literature, some calibration methods were investigated to reduce the geometric misalignments for the tomosynthesis or tomography systems. However, these methods can hardly reduce the geometric deviations of each single projection view such as single acquisition view angle error.
Compared with the current methods, the phantom-based calibration method proposed in this paper was directed at the geometric deviations of each single projection view. With the calibration phantom, the projection matrix of each projection view is respectively extracted. Then this set of the projection matrices can be stored for the subsequent calibration of the tomosynthesis reconstruction. The calibration reproducibility of the projection matrices ensures the whole calibration process repeatable for the same prototype system.
To quantify the calibration result, the comparative experiment was implemented and tomosynthesis images with and without calibration were compared point by point. For the limitation of our prototype detection system, the calibration method performed better under big isocenter horizontal-shifts. Based on the quantitative analysis, the phantom-based calibration technique can effectively minimize the reconstruction artifacts caused by the geometric misalignment.
In summary, the phantom-based calibration technique can be applied to other tomography imaging systems for eliminating the geometric misalignment. Besides, it also holds potential to benefitother medical 3D imaging applications.
Acknowledgement
The research is supported in part by a NIH grant, RO1 CA 142587. The authors would like to acknowledge the support of Charles and Jean Smith endowment fund at the University of Oklahoma too.
References
- [1].Dobbins JT, III, Godfrey DJ. Digital x-ray tomosynthesis: current state of the art clinical potential. Phys Med Biol. 2003;48:65–106. doi: 10.1088/0031-9155/48/19/r01. [DOI] [PubMed] [Google Scholar]
- [2].Dobbins JT., III. Tomosynthesis imaging: At a translational crossroads. Med Phys. 2009;36(6):1956–1967. doi: 10.1118/1.3120285. [DOI] [PMC free article] [PubMed] [Google Scholar]
- [3].Niklason LT, Christian BT, Niklason LE, et al. Digital tomosynthesis in breast imaging. Radiology. 2007;205:399–406. doi: 10.1148/radiology.205.2.9356620. [DOI] [PubMed] [Google Scholar]
- [4].Park JM, Franken EA, Jr., Garg M, Fajardo LL, Niklason LT. Breast tomosynthesis: Present considerations and future applications. Radiographics. 2007;27:231–240. doi: 10.1148/rg.27si075511. [DOI] [PubMed] [Google Scholar]
- [5].Mertelmeier Th., Ludwig J, Zhao B, Zhao W. Optimization of Tomosynthesis Acquisition Parameters: Angular Range and Number of Projections. Lecture Notes in Computer Science. 2008;5116:220–227. [Google Scholar]
- [6].Karolczak M, Wiesent, Engelke K, Lutz A. Implementation of a cone-beam reconstruction algorithm for the single-circle source orbit with embedded misalignment correction using homogeneous coordinates. Med Phys. 2001;28(10):2050–2069. doi: 10.1118/1.1406514. [DOI] [PubMed] [Google Scholar]
- [7].Bakic PR, Ringer P, Kuo J, Ng S, Maidment ADA. Analysis of Geometric Accuracy in Digital Breast Tomosynthesis Reconstruction. Proceeding of International Workshop Digital Mammography. 2010;6136:62–69. [Google Scholar]
- [8].Jiang H. Three-dimensional artifact induced by projection weighting and misalignment. Trans Med Imag. 1999;18(4):1375–1384. doi: 10.1109/42.768846. [DOI] [PubMed] [Google Scholar]
- [9].Smekal LV, Kachelrie M, Stepina E, Kalender WA. Geometric misalignment and calibration in cone-beam tomography. Med Phys. 2004;31(12):3242–3266. doi: 10.1118/1.1803792. [DOI] [PubMed] [Google Scholar]
- [10].Nett BE, Zambelli J, Riddell C, Belanger B, Chen G. Circular tomosynthesis implemented with a clinical interventional flat-panel based C-Arm: initial performance study. Proc SPIE. 2007;6510:65101N. [Google Scholar]
- [11].Wang XY, Mainprize JG, Kempstone, Kempston MP. Digital Breast Tomosynthesis Geometry Calibration. Proc SPIE. 2007;6510:65103B. [Google Scholar]
- [12].Sun Y, Hou Y, Zhao F, Hu J. A calibration method for misaligned scanner geometry in cone-beam computed tomography. NDT and E Int. 2006;39(6):499–513. [Google Scholar]
- [13].Hartley R, Zisserman A. Multiple View Geometry in Computer Vision. 2nd ed Cambridge University Press; 2003. [Google Scholar]
- [14].Li XH, Zhang D, Liu B. A generic geometric calibration method for tomographic imaging systems with flat-panel detectors-A detailed implementation guide. Med Phys. 2010;37(7):1695–1706. doi: 10.1118/1.3431996. [DOI] [PubMed] [Google Scholar]
- [15].Rougee A, Picard C, Trousset Y. Geometrical calibration for 3D X-ray imaging. Proc SPIE. 1993;1897:161–169. doi: 10.1016/0895-6111(93)90020-n. [DOI] [PubMed] [Google Scholar]
- [16].Wiesent K, Barth K, Navab N. Enhanced 3D-Reconstruction Algorithm for C-Arm Systems Suitable for Interventional Procedures. IEEE Trans Med Imaging. 2000;19(5):391–403. doi: 10.1109/42.870250. [DOI] [PubMed] [Google Scholar]
- [17].Feldkamp LA, Davis LC, Kress JW. Practical cone-beam reconstruction. J Opt Soc Am. 1984;16:612–619. [Google Scholar]
- [18].Godfrey DJ, Yin FF, Oldham M. Digital tomosynthesis with an on-board kilovoltage imaging device. Int J Radiation Oncology Biol Phys. 2006;65(1):8–15. doi: 10.1016/j.ijrobp.2006.01.025. [DOI] [PubMed] [Google Scholar]
- [19].Chen ZK, Calhoun VD, Chang SJ. Compensating the intensity fall-off effect in cone-beam tomography by an empirical weight formula. Appl Opt. 2008;47(32):6033–6039. doi: 10.1364/ao.47.006033. [DOI] [PMC free article] [PubMed] [Google Scholar]
- [20].Zhang D, Donovan M, Liu H. A convenient alignment approach for x-ray imaging experiments based on laser positioning devices. Med Phys. 2008;35(11):4907–4910. doi: 10.1118/1.2989059. [DOI] [PMC free article] [PubMed] [Google Scholar]


