

Abstract
The well-stirred tank (WST) has been the predominant flow-limited tissue compartment model in physiologically-based pharmacokinetic (PBPK) modeling. Recently, we developed a two-region asymptotically reduced (TAR) PBPK tissue compartment model through an asymptotic approximation to a two-region vascular-extravascular system to incorporate more biophysical detail than the WST model. To determine the relevance of the novel flow-limited approach (F-TAR), 75 structurally diverse drugs are evaluated herein using a priori predicted tissue:plasma partition coefficients along with hybrid and whole-body PBPK of eight rat tissues to determine the impact of model selection on simulation and optimization. Simulations show the F-TAR model significantly improves the ability to predict drug exposure, with hybrid and whole-body WST model error approaching 50% for tissues with larger vascular volumes. When optimization is used to fit F-TAR and WST models to pseudo data, WST-optimized drug partition coefficients more appropriately represent curve-fitting parameters rather than biophysically meaningful partition coefficients. Median F-TAR-optimized error ranged from -0.4 to 0.3%, while WST-optimized median error ranged from -22.2 to 1.8%. These studies demonstrate the use of F-TAR represents a more accurate, biophysically realistic PBPK tissue model for predicting tissue exposure to drug and should be considered for use in drug development and regulatory review.
Keywords: Pharmacokinetics, Physiological model, Well stirred model, Tissue partition, In silico modeling, Physicochemical, Singular perturbation, Asymptotic matching, Flow-limited, Compartmental modeling
INTRODUCTION
In contrast to classic compartmental pharmacokinetics, physiologically-based pharmacokinetic (PBPK) model structure is rooted in anatomic (e.g. volumes and tissue compartment connectivity) and physiologic (e.g. flows and clearance) attributes of the species with consideration of the physicochemical nature of drug partitioning and binding, composition of bodily tissues (e.g. lipids and water), and rates associated with metabolism of drug by tissues1. Through this detailed, mechanism-based approach, simulations of drug absorption, distribution, metabolism, and excretion (ADME) are constrained by the biophysical characteristics of the system, allowing an understanding of pharmacodynamic and/or adverse effects through evaluation of tissue exposure to a drug or toxin. For these reasons, PBPK has found use in drug development and regulatory review, where large numbers of new chemical entities/investigational new drugs must be evaluated, relying on integration of many types of data2, such as from physicochemical (e.g. a priori predicted tissue:plasma partition coefficients, Pt:p), in vitro (e.g. rates of metabolism by hepatocytes), and preclinical animal models, to assess dosing and risk in large, heterogeneous populations. In addition to improving the ability to predict drug disposition and evaluate findings from preclinical and clinical studies3, the development of physiological models to study drug kinetics allows the translation of findings across species4, between normal and altered physiologic and pathophysiologic states5, and between child and adult populations6. These examples highlight the critical need to continue to develop and improve existing PBPK models to better predict the disposition of drugs in human subjects.
A recently published7 two-region asymptotically reduced (TAR) PBPK tissue compartment model was shown to theoretically improve upon the standard flow-limited tissue compartment model. Herein, the potential influence and role of the TAR model in drug development and risk assessment is evaluated with both hybrid and whole-body PBPK modeling approaches in eight rat tissues using a group of 75 structurally-unrelated compounds, thereby providing a feasible range of Pt:p and tissue vascular spaces over which to assess tissue compartment models through simulation and optimization.
THEORY
The building block of modeling drug distribution with PBPK is the tissue compartment model. PBPK tissue compartment models are primarily described as being either flow-limited or diffusion-limited. Application of a flow-limited tissue compartment model as a general approach to PBPK modeling for drug discovery and development was presented by Poulin, et al.3, and in the field of toxicology, the same flow-limited model is extensively employed to study toxicokinetics8. The standard flow-limited (or perfusion-limited) approach models the tissue as a single-compartment, well-stirred tank (WST), defined by the mass balance differential equation
| (1) |
where c is the concentration of drug in the well-stirred compartment, cin is the input concentration of drug, F is tissue blood flow, and V is the total volume of the tissue. The tissue:plasma partition coefficient is abbreviated as Pt:p and defined in the literature as the ratio of the tissue concentration of drug to the arterial concentration of drug at equilibrium9. Equation 1 is equivalently referred to as the WST model and the venous equilibrium model, in which the venous outflow concentration, cv, is the concentration in the outflowing blood:
| (2) |
For the rest of the presentation, the flow-limited model of Eq.(1) will be referred to as the WST model.
The other PBPK tissue compartment model, though less commonly employed, is important for use in tissues where mass transfer out of the vascular space (V1) and into the extravascular space (V2) is limited by a permeability barrier and is therefore permeation or diffusion-limited. Tissues possessing a permeability barrier, such as in the brain, may require the tissue compartment to be modeled with two subcompartments, a vascular space and extravascular space, dependent on drug lipophilicity10. Two ordinary differential equations, with permeation between the vascular and extravascular spaces, define the standard diffusion-limited model
| (3a) |
| (3b) |
where c1 is the concentration of drug in the vascular space, c2 is the concentration of drug in the extravascular space, V1 is the vascular volume, V2 is the extravascular volume, and PS is the permeability-surface area product. Equation (3a,b) can be thought of as an extension of the WST model, Eq.(1), with addition of permeation between two well-stirred subcompartments. This model will be referred to as the permeability-limited two-subcompartment model (PLT). Together, Eqs.(1) and (3a,b) represent the vast majority of PBPK tissue compartment models used in the literature1 because they provide a framework for analyzing physiologically-rich experimental data sets and predicting in vivo kinetics, especially exposure of target tissue to drug.
Motivation for development of TAR model equations
In the WST model, a single compartment is assumed to instantaneously mix, and therefore, drug concentration is homogeneous throughout the entire tissue compartment. Though the WST model has been implemented in evaluating a range of drugs and toxins, it does not account for potential regional variation in vascular-extravascular concentration as a result of drug-specific physicochemical and tissue-specific properties. As a result, selection of the most appropriate model may not simply depend on successful fitting of drug time courses but rather on the basis of the model parameters possessing more biophysical, mechanistic meaning. Analysis of the WST and TAR models reveals that the TAR formulation more closely approximates the behavior of the PLT model in the flow-limited regime of PS / F → ∞ and is therefore a first order improvement over the WST model7.
TAR model equations
Since the permeability-limited (P-TAR) and flow-limited TAR (F-TAR) PBPK models agree with the PLT model over a wider range of physiological and physicochemical parameter values than the WST model, TAR-based PBPK modeling has the potential to enhance accuracy and interpretation compared to the WST model7. The set of equations presented here are for non-eliminating tissues and are developed in detail in Thompson and Beard7.
Permeability-limited TAR Model (P-TAR)
The TAR approach involves solving only one ordinary differential equation for each tissue compartment model yet includes both vascular and extravascular regions. The number of state variables present in the PLT model is reduced from two to one using singular perturbation theory. F-TAR and P-TAR models use the same number or fewer adjustable parameters than their flow-limited (WST) and permeability-limited (PLT) counterparts, respectively. Basic equations for the P-TAR case are
| (4a) |
and
| (4b) |
For these expressions to be valid, the change in c1 must be slow (dc1/ dt ≅ 0) compared to the transit time of the drug. While the formulation of the permeability-limited equations, Eq.(4a,b), is slightly more complex than the PLT model equations, Eq.(3a,b), it does not introduce additional adjustable parameters. Since the P-TAR model invokes only one state variable versus the two for the PLT model, while capturing the same permeability-limited behavior, the P-TAR model will have a lower computational cost. Though this may not be a meaningful increase in computational speed for typical PBPK settings, increases in efficiency may be important in simultaneous evaluation of many drugs and/or metabolites in whole-body PBPK based on high-throughput data.
Flow-limited TAR Model (F-TAR)
Approximating the P-TAR model as flow-limited, where PS is arbitrarily high and therefore permeability is not limiting (PS / F → ∞), the governing equations reduce to
| (5a) |
and
| (5b) |
The PLT, WST, F-TAR, and P-TAR models are diagrammatically represented in Figure 1. PLT, P-TAR, and F-TAR models all have two subcompartments/regions but the F-TAR model does not depend on the value of the permeability-surface area product.
Figure 1. PBPK tissue compartment model diagrams.
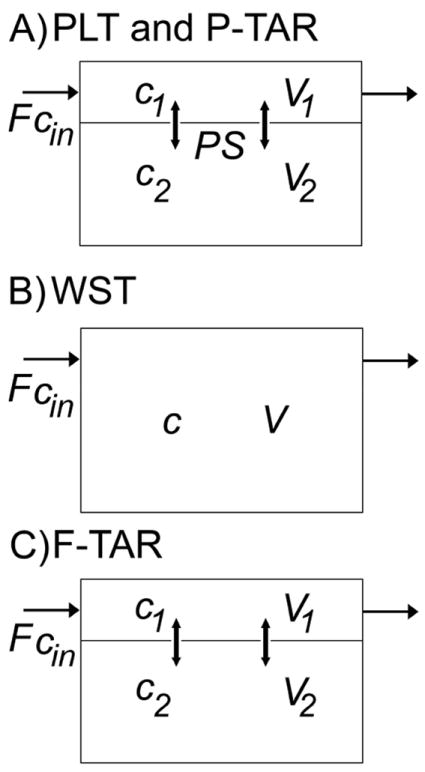
A) Permeability-limited two-subcompartment (PLT) model, Eq.(3a,b), and permeability-limited two-region asymptotically reduced (P-TAR) model, Eq.(4a,b), both have vascular (V1) and extravascular (V2) spaces and have the same adjustable parameters, but the P-TAR model requires one less state variable to solve; B) The well-stirred tank (WST) model, Eq.(1), is represented by a single well-mixed tissue compartment; C) The flow-limited two-region asymptotically reduced (F-TAR) model, Eq.(5a,b) has two regions but does not require the PS term for permeation under the flow-limited regime. See text for further definitions of model variables.
Tissue outflow concentration in the TAR model
In whole-body PBPK, flow-weighted sums of tissue outflow concentrations provide the input concentrations into the venous pool. The dynamic mass balance for an individual organ is given by
| (6) |
where cout (t) is the tissue outflow concentration. The expressions for P-TAR and F-TAR outflow concentrations are more fully developed in Thompson and Beard7. For F-TAR, cout is computed
| (7) |
| (8) |
where
| (9) |
For P-TAR, cout is computed
| (10) |
| (11) |
where
| (12) |
METHODS
Evaluation of drugs
Because both WST and F-TAR models may be used to analyze many kinds of pharmacokinetic data, model selection is a process of determining which model yields more insight into a particular drug’s pharmacokinetics. In contrast to the WST model, the F-TAR model distinguishes between the vascular and extravascular spaces, with this increased biophysical realism becoming potentially important when using a priori predicted tissue:plasma partition coefficients and flow-limited PBPK to study and predict in vivo pharmacokinetics 3,11. To explore how the F-TAR model compares with the widely utilized WST model, 75 well-characterized, structurally-unrelated drugs are evaluated, providing a representative range of values of Pt:p to evaluate differences in model outputs. All simulations and analyses are carried out in Matlab v.R2010a, (Mathworks, Natick, MA).
A priori prediction of tissue:plasma partition coefficients (Pt:p)
Well-established methods11 for a priori prediction of Pt:p are based on physicochemical and biological data, e.g. logPo:w (octanol:water), protein binding, and tissue composition. Tissue composition data are obtained from Poulin et al.9 The values for logPo:w are obtained from two primary sources: 1) experimentally determined values in the EPI Suite database12; and 2) the published work of Poulin and Theil11. The published work of Blakey, et al.13, for a homologous series of barbiturates, was a secondary source. For several drugs, estimated logPo:w values from EPI Suite were used. Utilizing the previously developed method of Poulin and Theil, the unbound fraction of drug in plasma, fu p, is used to compute the unbound fraction of drug in the tissue, fu t 11, where
| (13) |
The fraction of unbound drug in plasma is obtained from the literature13-23. For each drug, Pt:p is computed as detailed by Poulin and Theil11
| (14) |
where Po:w is the octanol:water partition coefficient and tissue composition is described by fractional volume, V, and where w is water, nl is neutral lipid, ph is phospholipid, t is tissue, and p is plasma.
Determination of the physiological parameter space for rat tissues
PBPK physiological parameter values (Tab. 1) for eight rat tissues and organs (bone, brain, heart, intestine, lung, muscle, skin, and spleen) are computed from values in the literature based on a 250 g rat. Tissue volumes are based on tissue masses and densities24,25. Rat cardiac output is determined using an allometric scaling relationship between cardiac output (CO) in L/min and bodyweight (BW) in kg24
| (15) |
where α = 0.235. Tissue flow values are based on fractional cardiac output received by each given tissue3,24. Values for the vascular space (V1) are given as fractional blood volume (FBV)24,26, and the extravascular space (V2) is computed as the difference between total volume and vascular volume. Vascular transit time, given by V1/F, and tissue transit time, given by (V1+ V2)/F, are provided in Table 1 for each tissue.
Table 1.
Physiological parameters for a 250 g rat
| Tissued | ||||||||
|---|---|---|---|---|---|---|---|---|
| Bone | Brain | Heart | Intestine | Lung | Muscle | Skin | Spleen | |
| Relative Flow, (%COa) | 12.2j | 2.0j | 5.1j | 13.1l | 100 | 27.8j | 5.8j | 2.0l |
| Relative Mass, (%BWb) | 7.3j | 0.6j | 0.3j | 2.7j | 0.5j | 40.4j | 19j | 0.2j |
| Vascular Space, (FBVc) | 0.04j | 0.03j | 0.26j | 0.035k | 0.36j | 0.04j | 0.02j | 0.22j |
| Tissue Densitye, (g/ml) | 1.43j | 1.04j | 1.03j | 1.04j | 1.05j | 1.04j | 1.11j | 1.05j |
| Flow, (ml/min) | 10.14 | 1.66 | 4.24 | 10.88 | 83.09 | 23.10 | 4.82 | 1.66 |
| Mass, (g) | 18.25 | 1.50 | 0.75 | 6.75 | 1.25 | 101.00 | 47.50 | 0.5 |
| Total Volumef, (ml) | 12.76 | 1.44 | 0.73 | 6.49 | 1.19 | 97.12 | 42.79 | 0.48 |
| Vascular Volumeg, (ml) | 0.51 | 0.04 | 0.19 | 0.23 | 0.43 | 3.88 | 0.86 | 0.10 |
| Vascular Transit Timeh, (sec) | 3.0 | 1.4 | 2.7 | 1.3 | 0.3 | 10.1 | 10.7 | 3.8 |
| Tissue Transit Timei, (sec) | 75.5 | 52.0 | 10.3 | 35.8 | 0.9 | 252.3 | 532.7 | 17.2 |
Cardiac output (CO) is computed based on Eq.(15) (Brown, et al.24); for a 250g rat, cardiac output is estimated to be 83.09 ml/min
Bodyweight (BW)
Fractional blood volume (FBV) of tissue
Values from literature are the first 4 rows, the last 5 rows are computed values
Bone density is computed as the average of Brown, et al. where cortical (1.99), trabecular (1.92), red marrow (1.03), yellow marrow (0.78) densities are weighted equally. Intestine density is computed as the average of Brown, et al. where stomach (1.05), small intestine (1.04), and large intestine (1.04) densities are weighted equally. Skin density is computed as the average of Brown, et al. where stratum corneum (1.50), epidermis (1.15), dermis (1.12), hypodermis (0.97) densities are weighted by relative tissue volumes given by Scheuplein, et al.25.
Total volume is V1+V2
Vascular volume is V1
Vascular transit time is computed as V1/F
Tissue transit time is computed as (V1+V2)/F
Brown, et al.24
Everett, et al.26
Poulin, et al. 20023
Simulation of peak tissue concentration using hybrid PBPK models
The 75 drugs are evaluated using hybrid PBPK to simulate the impact of model selection on peak drug concentration (Cmax) in rat tissues and organs (bone, brain, heart, intestine, lung, muscle, skin, and spleen). Hybrid PBPK modeling27 incorporates physiologically-based compartment volumes and flows but relies on a forcing function to simulate model input concentration (cin). Though the hybrid approach makes comparisons among a large number of drugs tractable, it does not permit evaluation of the effects of downstream tissue outflow concentrations on model inflow concentrations (cin) in the closed circulation. Herein, the forcing function is obtained by solving an ordinary differential equation that simulates arterial concentration (cin) of an orally administered drug:
| (16) |
where ka and kel are set to 0.001 sec-1 and 0.0005 sec-1, respectively. The dose, cdose, set equal to 2, is in arbitrary units of concentration, a.u., and the selected rate constants yield a concentration curve that spans a time domain of ~4 hours and reaches a peak arterial concentration of ~1 a.u. at Pt:p=1 to allow for easy visualization of the impact of Pt:p and FBV on model solutions (Fig. 2). A specific unit of concentration is avoided in analyzing the 75 drugs because each drug has specific pharmacokinetic parameters, formulation, and dosing. As such, in employing the same forcing function for all drugs and respective tissues, WST and F-TAR model outputs can be directly compared. Peak tissue drug concentration, Cmax, is used as a metric for comparing model solutions because peak tissue drug concentrations are most sensitive to Pt:p. Additionally, Cmax is an important indicator of overall tissue drug exposure and therefore is linked to concentration-dependent pharmacodynamic effects and treatment efficacy28.
Figure 2. Simulated concentration profiles in rat muscle and lung.
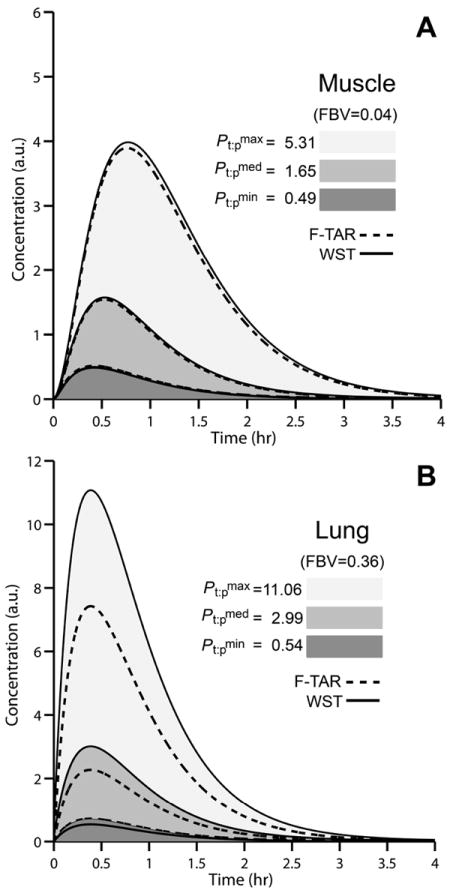
Concentration profiles (shown overlapping) for rat muscle (A) and lung (B) at the minimum (dark gray shaded), median (medium gray shaded), and maximum (light gray shaded) a priori predicted Pt:p for 75 structurally-unrelated drugs. A hybrid PBPK model is used as a forcing function, Eq.(16), to generate inflow concentration in arbitrary units (a.u.). Tissue concentrations are simulated using WST (solid black lines) and F-TAR models (dashed black lines).
To fairly compare WST and F-TAR models, F-TAR model solutions are expressed as the overall tissue concentration. This is sensible considering experimental measurements of drug tissue concentration are obtained through homogenization of the whole tissue, i.e. the vascular and extravascular spaces are mixed. For the F-TAR model, c1=c2 / Pt:p yielding
| (17) |
Analysis of hybrid PBPK F-TAR and WST model solutions
The WST model, Eq.(1), and the F-TAR model, Eq.(5a,b), are compared assuming that the F-TAR model more closely captures true system structure and behavior7. Therefore, the percentage error between and is defined as
| (18) |
Descriptive statistics (mean, median, minimum, and maximum values) are reported in summary form in Table 2 for the percentage error between and , along with descriptive statistics for a priori predicted Pt:p of the 75 drugs. All 75 drug-associated errors are shown by tissue in Figure 3 with descriptive statistics given in Table 2. To aid in selection of a flow-limited PBPK tissue compartment model for use in drug development and regulatory review, error estimates, in lieu of dynamic simulations of peak concentration using hybrid PBPK, can be explicitly defined in terms of a drug’s Pt:p and the respective tissue FBV:
| (19) |
From this equation, percentage error associated with prediction of is defined as a function of the vascular space of the tissue and the propensity of the drug to partition between it and the extravascular tissue space (Fig. 4).
Table 2.
Descriptive statistics for Pt:p and simulated percentage error between WST and F-TAR model Cmax for 75 drugs in hybrid PBPK rat tissues
| Tissue | FBV | Pt:p | Simulated % error (Cmax)a | ||||||
|---|---|---|---|---|---|---|---|---|---|
| min | max | median | mean | min | max | median | mean | ||
| Bone | 0.04 | 0.25 | 9.89 | 2.46 | 3.34 | -10.7 | 3.0 | 2.3 | 0.2 |
| Brain | 0.03 | 0.56 | 24.45 | 6.03 | 8.22 | -2.1 | 2.2 | 2.0 | 1.4 |
| Heart | 0.26 | 0.52 | 7.05 | 2.06 | 2.64 | -19.4 | 28.7 | 15.5 | 12.1 |
| Intestine | 0.035 | 0.50 | 16.15 | 4.10 | 5.52 | -3.4 | 3.0 | 2.7 | 1.7 |
| Lung | 0.36 | 0.54 | 11.06 | 2.99 | 3.93 | -23.5 | 49.0 | 31.7 | 24.7 |
| Muscle | 0.04 | 0.49 | 5.31 | 1.65 | 2.06 | -4.0 | 2.0 | 1.2 | 0.6 |
| Skin | 0.02 | 0.49 | 11.13 | 2.96 | 3.91 | -2.1 | 0.7 | 0.6 | 0.2 |
| Spleen | 0.22 | 0.51 | 5.22 | 1.65 | 2.05 | -16.7 | 20.1 | 8.9 | 7.1 |
Simulated percentage error between WST and F-TAR models is given by Eq.(18)
Figure 3. Simulated peak concentration error between WST and F-TAR hybrid PBPK models for 75 structurally-unrelated drugs.
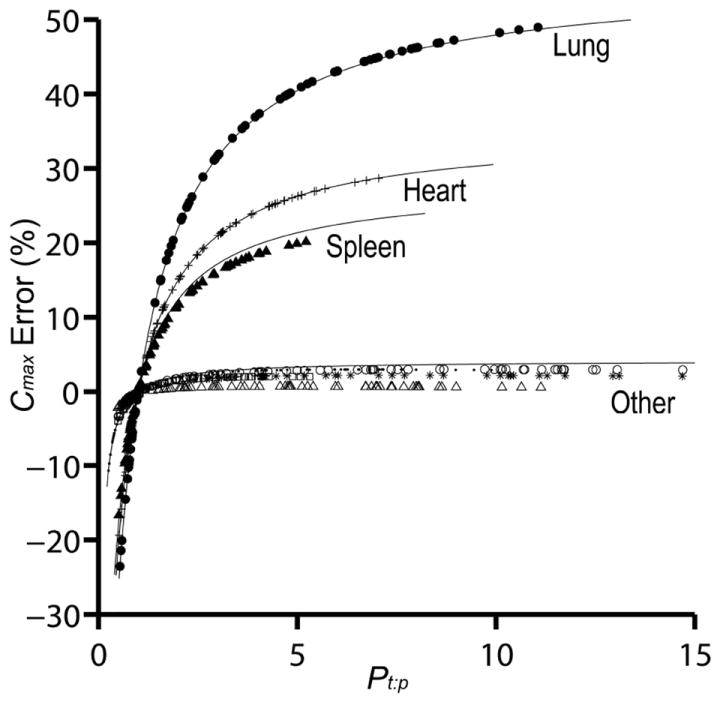
Predicted peak concentration (Cmax) error, Eq.(18), for tissue drug concentration between WST and F-TAR model simulations, shown for eight rat tissues (lung, heart, spleen, and other–bone, brain, intestine, muscle, skin). Only rat tissues with larger fractional blood volumes (FBV) show substantial Cmax % error for the 75 evaluated drugs possessing a range of a priori predicted tissue:plasma partition coefficients (each plotted point is a unique Pt:p and its associated error). Lung (filled circle), heart (plus sign), spleen (filled triangle), bone (point), brain (asterisk), intestine (empty circle), muscle (empty square), and skin (empty triangle). Solid lines indicate the estimates for peak concentration error based on Eq.(19) for FBV = 0.36, 0.26, 0.22, and 0.04.
Figure 4. Estimated peak concentration error between WST and F-TAR hybrid PBPK models.
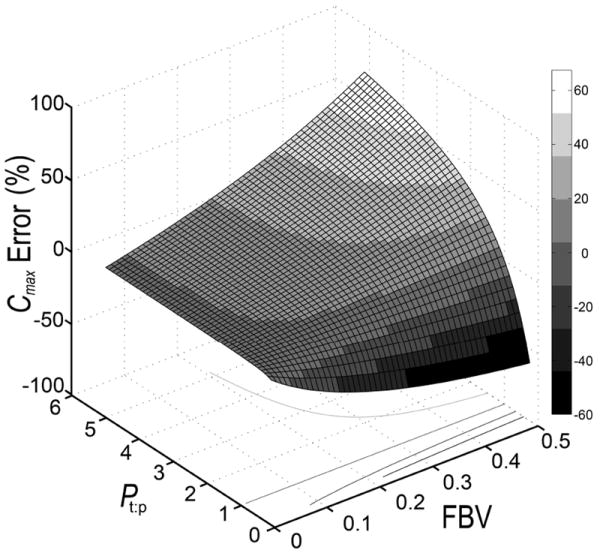
Peak concentration error (Cmax % error) for tissue drug concentration between WST and F-TAR models is estimated as a function of the drug partition coefficient and the respective fractional blood volume (FBV) of the tissue of interest, Eq.(19).
Simulation of drug disposition using whole-body PBPK models
In contrast to analyzing hybrid PBPK tissue compartment models in isolation from the system, whole-body PBPK allows evaluation of the impact of differences in tissue outflow concentrations. A whole-body PBPK model is constructed to simulate peak concentration error (Cmax % error) between WST and F-TAR. The WST and F-TAR whole-body models consist of the 8 rat tissues and a remainder compartment, with the remainder being defined as the volume and flow not accounted for by the other 8 tissues and constrained by total volume and cardiac output for a 250 g rat. Venous concentration is determined as the flow-weighted sums of tissue outflow concentrations from the 9 compartments. Arterial drug concentration is computed as the lung outflow concentration. Drug input is via a slow venous addition defined by
| (20) |
where kiv=0.001 sec-1, Dose=100 a.u. of mass, and tlag=5 sec. Loss of drug is modeled by a clearance term in the remainder compartment (0.05 ml sec-1). All simulations maintain the remainder compartment at a partition coefficient of 1 so that models do not differ in how drug is handled in this compartment. Simulations for each of 75 structurally-unrelated drugs are carried out using a priori predicted Pt:p in both WST and F-TAR models. Cmax error (%) in each tissue is shown as a column scatter plot in Figure 5 with descriptive statistics given in Table 3.
Figure 5. Simulated peak concentration error between WST and F-TAR in whole-body PBPK models evaluating 75 structurally-unrelated drugs.
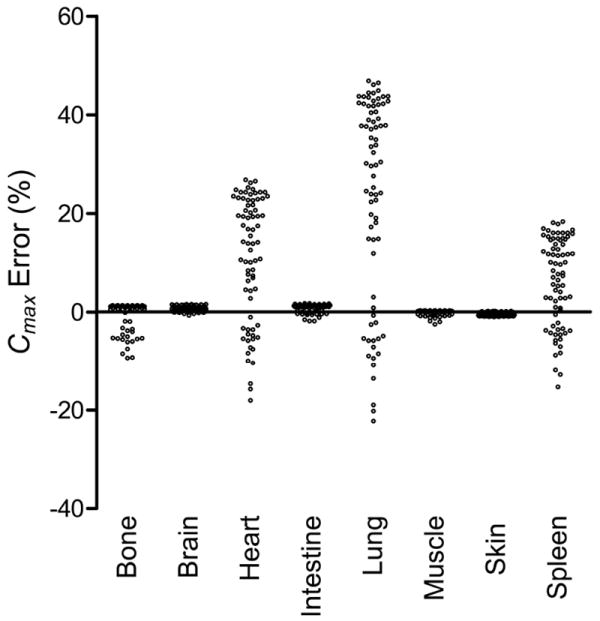
Simulated peak concentration error (Cmax % error) between WST and F-TAR in whole-body PBPK models comprised of 8 rat tissues and a remainder compartment. Each data point (empty circle) in the column scatter plot for a given tissue represents the percentage error, Eq.(18), associated with one of 75 structurally-unrelated drugs simulated in the whole-body model using a priori predicted Pt:p.
Table 3.
Simulated percentage error between WST and F-TAR model Cmax for 75 drugs in whole-body PBPK analysis of rat tissues
| Tissue | FBV | Simulated % error (Cmax)a | |||
|---|---|---|---|---|---|
| min | max | median | mean | ||
| Bone | 0.04 | -9.4 | 1.3 | 1.1 | -0.6 |
| Brain | 0.03 | -0.7 | 1.6 | 0.6 | 0.6 |
| Heart | 0.26 | -18.1 | 26.8 | 14.1 | 11.1 |
| Intestine | 0.035 | -1.9 | 1.7 | 1.2 | 0.9 |
| Lung | 0.36 | -22.3 | 46.8 | 30.2 | 23.5 |
| Muscle | 0.04 | -2.5 | 0.3 | 0.2 | -0.1 |
| Skin | 0.02 | -1.0 | 0.2 | -0.4 | -0.4 |
| Spleen | 0.22 | -15.3 | 18.4 | 7.7 | 6.2 |
Simulated percentage error between WST and F-TAR models is given by Eq.(18)
Parameter optimization using whole-body PBPK models
Previous simulations used a priori predicted Pt:p to compare the models. However, optimization is another approach to determine partition coefficients from pharmacokinetic time courses. To generate pseudo data, Gaussian noise (5%) is added to flow-limited (PS/F = 100) PLT model solutions simulated with each of the 75 sets of a priori predicted Pt:p (sampling at 0, 10, 15, 20, 30, 40, 50, and 60 minutes and 1.5, 2, 2.5, 3, 3.5 and 4 hours). Whole-body F-TAR and WST models are then fit to this noisy data and adjustable parameters are optimized using a Monte Carlo method to arrive at estimates of partition coefficients. Error between optimized Pt:p and the true value is given by
| (21) |
For each of the 75 structurally-unrelated drugs, a priori predicted Pt:p values for each tissue are compared with WST-optimized or F-TAR-optimized Pt:p values, with optimization-associated percentage error between optimized values and the true values (i.e. a priori predicted Pt:p) given in Figure 6. In Table 4, the median a priori predicted Pt:p values for each tissue (from Tab. 2) are compared to model optimized values.
Figure 6. Optimization-associated error in tissue:plasma partition coefficients for WST and F-TAR in a whole-body PBPK model evaluating 75 structurally-unrelated drugs.
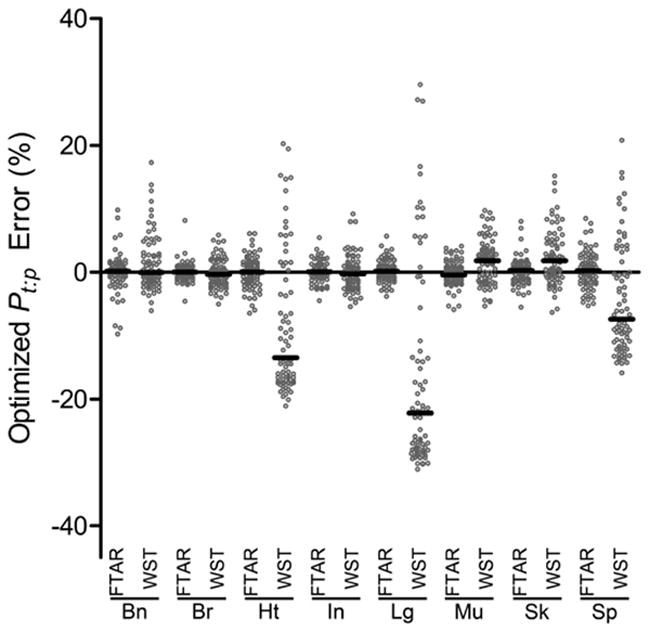
WST or F-TAR optimization-associated percentage error relative to a priori predicted tissue:plasma partition coefficients using a whole-body PBPK model comprised of 8 rat tissues and a remainder compartment. Each data point (empty circle) in the column scatter plot for a given tissue represents the mean percentage error (n=3 optimization runs) for one of the 75 structurally-unrelated drugs in the specified tissue (Bn- Bone, Br-Brain, Ht-Heart, In-Intestine, Lg-Lung, Mu-Muscle, Sk-Skin, Sp-Spleen) optimized with either the F-TAR or WST whole-body models to fit pseudo data generated by the standard permeability-limited two-subcompartment (PLT) model under a flow-limited regime. Median % error for the 75 drugs in each tissue is given by the black bar.
Table 4.
Optimized Pt:p values for WST and F-TAR models using whole-body PBPK analysis of rat tissues
| PLTa | F-TARb | %Errorc | WSTd | %Errore | |
|---|---|---|---|---|---|
| Bone | 2.46 | 2.52 | 2.3 | 2.47 | 0.4 |
| Brain | 6.03 | 6.07 | 0.6 | 5.97 | -1.1 |
| Heart | 2.06 | 2.10 | 2.0 | 1.83 | -10.9 |
| Intestine | 4.10 | 4.16 | 1.5 | 4.11 | 0.3 |
| Lung | 2.99 | 2.96 | -1.1 | 2.28 | -23.8 |
| Muscle | 1.65 | 1.64 | -0.5 | 1.65 | 0.0 |
| Skin | 2.96 | 2.86 | -3.2 | 2.86 | -3.3 |
| Spleen | 1.65 | 1.61 | -2.2 | 1.49 | -9.4 |
Median values of predicted tissue:plasma partition coefficients for each tissue. Values were used to generate pseudo data with a flow-limited PLT model for optimizing Pt:p using the WST and F-TAR models
F-TAR-optimized Pt:p values (mean, n=3 parameter sets)
Percentage error is calculated between F-TAR-optimized Pt:p values and PLT Pt:p values
WST-optimized Pt:p values (mean, n=3 parameter sets)
Percentage error is calculated between WST-optimized Pt:p values and PLT Pt:p values
RESULTS AND DISCUSSION
Perspective
Historically, the use of physiologically-based transport in biological systems is attributed to Teorell in 193729,30, but the field remained underdeveloped until the 1970’s and 80’s when Bischoff and Dedrick31 and Anderson32 began building physiologically-based models to investigate the kinetics of drugs and toxins. Since then, the mathematical expressions used in PBPK modeling have become well-established, as reviewed33 more than 20 years ago and recently34. In Thompson and Beard7, the appropriateness of these equations, especially the WST model, was investigated.
Though the WST model is the minimal PBPK tissue compartment model in the literature, theoretically, there is a limited set of parameter values where the WST model is appropriate (PS/F is large and Pt:p ≈ 1). Regardless, the flow-limited WST model has been the default PBPK tissue compartment model for decades and would not have been widely utilized unless it could fit experimental data sufficiently. However, the insight it provides may not be on par with competing models having more parameters (PLT, P-TAR) or the same number of parameters but with more biophysical detail (F-TAR).
Evaluation of the parameter spaces for drug partition coefficients (Pt:p) and rat tissues
A broad range of drugs are investigated to gauge the potential influence of a priori predicted tissue:plasma partition coefficients and tissue fractional blood volumes on physiologically-based pharmacokinetic model selection. The descriptive statistics for the 75 structurally-unrelated drugs are given in Table 2. The lowest partition coefficient is 0.25 (in bone) and the highest is 24.45 (in brain). Mean and median values for all tissues are above 1, with median less than mean in all cases indicating a right-skewed distribution for Pt:p. The eight rat tissues, all assumed to be non-eliminating for the analysis, possess values for flow and volume that result in a sampling of vascular and tissue transit times over 3 orders of magnitude (Tab.1).
Simulation and analysis of peak tissue concentration using hybrid PBPK models
The greatest difference between the WST and F-TAR tissue compartment models occurs when Pt:p of a drug is significantly larger or smaller than 1 and when the FBV is relatively high. FBV’s of lung, heart, and spleen are the highest among the tissues assessed and have larger percentage errors for each respective drug than tissues with lower FBV’s (bone, brain, intestine, muscle, and skin). Figure 2 plots overall tissue concentration versus time for muscle and lung (low and high FBV tissues, respectively) for the input function described by Eq.(16). For each tissue, the minimum, median, and maximum a priori predicted Pt:p from the representative set of 75 compounds is used to simulate the time course. The WST model underestimates F-TAR Cmax when a compound’s Pt:p is lower than 1 and overestimates F-TAR Cmax when a drug’s Pt:p is higher, with the error in both cases magnified by increases in FBV of the tissue.
The difference between WST and F-TAR model solutions is the result of outflow concentration being computed differently between WST, Eq.(2), and F-TAR models, Eqs.(7, 8, & 9). When V1 is small and Pt:p is close to 1, Eq.(9) approximates WST outflow concentration. However, when Pt:p is less than or greater than 1, the outflow concentrations differ. Given the same inflow concentration, the masses residing in the compartment predicted by the two models differs based on the mass conservation relation given by Eq.(6). The difference can be either reduced or enhanced depending on the value of FBV. Differences between WST and F-TAR model predictions for the 75 compounds are illustrated in Figure 3 and summarized in Table 2. Figure 3 plots the percentage error in Cmax as a function of Pt:p for eight tissue compartments. Results shown in Figure 3 and Table 2 have potential implications for selection of a PBPK tissue compartment model to accurately determine target tissue exposure to drug, as needed when carrying out pharmacokinetic/pharmacodynamic modeling.
Accounting for introduction of error due to residual tissue blood
In performing a pharmacokinetic study in an animal and making measurements of drug levels in isolated and homogenized tissues, residual blood volume can potentially result in significant introduction of error. This effect was first theoretically described by Khor and Mayersohn35, with the suggestion of applying a correction factor to experimentally determined partition coefficients. When Pt:p > 1, the drug is preferentially partitioned in the extravascular space and the blood acts to dilute the actual tissue concentration when the tissue is homogenized for measurement. When Pt:p < 1, the drug partitions more favorably into the vascular space and the situation is reversed. Though Khor and Mayersohn35 suggested a correction factor and Thompson and Beard7 account for partitioning in the vascular space with a dynamic model, both approaches highlight the need to consider models with increased biophysical detail–the vascular space. This effect is apparent in Figure 3, where at drug Pt:p > 1, the error due to ignoring the vascular volume of a tissue is magnified at relatively high tissue FBV, such as in the lung. The reverse is reflected by the negative percentage error in Cmax in Figure 3 for drugs with Pt:p < 1 and is again magnified by a larger FBV.
Since Khor and Mayersohn proposed the correction for residual tissue blood in 1991, a number of studies have furnished experimental data that is supportive of including more biophysical detail, such as accounting for the vascular space on a tissue-by-tissue basis36-39. In light of these findings, additional studies evaluating and comparing drug pharmacokinetics analyzed by WST and F-TAR models is warranted. Since meaningful error prediction will depend upon accurate determination of model inputs such as FBV, residual blood in sampled tissue may need to be measured26 and accounted for to confirm model error predictions. As a starting point, Eq.(19) can be used to predict the WST model error for a given tissue and drug. The use of Eq.(19) is demonstrated in Figure 4, with WST model error plotted as a function of FBV and Pt:p. Experiments can then be designed to specifically test these model predictions.
Simulation of drug disposition using whole-body PBPK models
Simulating whole-body kinetics using a PBPK model allows us to evaluate the influence of Pt:p values in the integrated system. Figure 5 plots the Cmax error (computed as error in the WST-based model compared to F-TAR) for each of the 75 compounds and eight tissues using a ten compartment PBPK model and venous input modeled by Eq.(20), with results summarized in Table 3. Figure 5 and Table 3 show that simulation with the whole-body PBPK model using the a priori predicted Pt:p values results in Cmax error similar to that predicted using hybrid modeling (Table 2), with hybrid and whole-body simulation minimum and maximum values differing by no more than 1.5 and 2.2 %, respectively. Hybrid and whole-body PBPK models, also referred to as open and closed loop, have been used previously40 as two distinct approaches to optimize partition coefficients. Herein, the hybrid and whole-body modeling results show that F-TAR outperforms WST over a range of drugs and tissues. Simulations show the F-TAR model significantly improves the ability to predict drug exposure, with hybrid and whole-body WST model error approaching 50% for tissues with larger vascular volumes. In summary, model solutions from F-TAR and WST agree when 1) tissue FBV is lower; or 2) when Pt:p values are very close to 1 and FBV is higher. When FBV is higher and Pt:p is not close to 1, the F-TAR model should be used to more accurately model drug transport.
Parameter optimization using whole-body PBPK models
As illustrated above, provided the same a priori predicted Pt:p value, the WST and F-TAR tissue compartment models can produce markedly different pharmacokinetic predictions. However, in addition to a priori prediction, there are two other generally employed methods for determination of Pt:p: 1) experimental measurement; and 2) parameter optimization. Various methods have been proposed to evaluate Pt:p from measured drug concentrations in plasma and tissue41. As discussed in detail by Khor and Mayersohn35, these measurements contain bias because of residual blood volume and a correction may be warranted. Experimental measurements also provide the raw data for carrying out large scale parameter optimization in whole-body PBPK modeling. Employing the F-TAR tissue compartment model during optimization would yield different parameter estimates compared to the use of the WST model.
To investigate parameter optimization as an approach to obtaining Pt:p, the whole-body model is used to analyze noisy pseudo pharmacokinetic data generated with the permeability-limited two-subcompartment (PLT) model (The PLT model is made flow-limited by setting PS/F to an arbitrarily high value). Figure 6 plots the percentage error between the WST or F-TAR model optimized partition coefficients and the actual coefficients used to generate the pseudo data for each of the 75 compounds and eight tissues evaluated. Table 4 contains optimized partition coefficients and percentage error for the median values of the partition coefficients that were evaluated. Following optimization, WST-derived partition coefficients possess more error in tissues with greater FBV. Median F-TAR-optimized error ranged from -0.4 to 0.3%, while WST-optimized median error ranged from -22.2 to 1.8%. This analysis predicts use of the F-TAR tissue compartment model in optimization will lead to more accurate estimation of simultaneously optimized Pt:p parameter values than WST, especially in higher FBV tissues. As such, WST-optimized Pt:p parameter values in some tissues may more appropriately represent curve-fitting parameters rather than biophysically meaningful partition coefficients. Carrying out optimization with the F-TAR model will lead to Pt:p parameter values that are more reflective of the actual biophysical partitioning of drug between tissue and plasma. Further evaluation of parameter optimization with the WST and F-TAR models will be important in determining what impact these different flow-limited PBPK tissue compartment models have on optimized parameter sets.
Conclusion
The application of a well-stirred, flow-limited PBPK tissue compartment model (WST) to predict tissue drug levels has been the predominant approach in PBPK modeling for decades. However, a recently developed7 flow-limited PBPK tissue compartment model (F-TAR), incorporating the biophysical detail of the vascular space, is a more appropriate model than the WST model, especially when considering potential drug-specific properties and tissues of interest. The studies presented herein suggest further evaluation of the TAR model would be prudent to address the current need for PBPK modeling in drug development and risk assessment.
Supplementary Material
Acknowledgments
This work was supported by NIH grant GM094503. MDT is supported by NIH training grant HL007852.
Abbreviations
- FBV
Fractional blood volume
- F-TAR
Flow-limited two-region asymptotically reduced
- PBPK
Physiologically-based pharmacokinetics
- Pt:p
Tissue plasma partition coefficient
- PLT
permeability-limited two-subcompartment
- P-TAR
Permeability-limited two-region asymptotically reduced
- TAR
Two-region asymptotically reduced
- WST
Well-stirred tank
Footnotes
Additional supporting information is available online. This supplementary material includes four supplementary tables. Table 1S lists logPo:w and unbound fraction in plasma and tissue for each drug in the rat. Table 2S provides the tissue composition data used for the calculation of drug partition coefficients in rat tissues. Table 3S contains a complete listing of the 75 a priori predicted partition coefficients in the 8 rat tissues evaluated. PBPK model structure and equations for whole-body analysis are also found in the supporting information.
References
- 1.Theil FP, Guentert TW, Haddad S, Poulin P. Utility of physiologically based pharmacokinetic models to drug development and rational drug discovery candidate selection. Toxicol Lett. 2003;138:29–49. doi: 10.1016/s0378-4274(02)00374-0. [DOI] [PubMed] [Google Scholar]
- 2.Zhao P, Zhang L, Grillo JA, Liu Q, Bullock JM, Moon YJ, Song P, Brar SS, Madabushi R, Wu TC, Booth BP, Rahman NA, Reynolds KS, Gil Berglund E, Lesko LJ, Huang SM. Applications of physiologically based pharmacokinetic (PBPK) modeling and simulation during regulatory review. Clin Pharmacol Ther. 2011;89:259–267. doi: 10.1038/clpt.2010.298. [DOI] [PubMed] [Google Scholar]
- 3.Poulin P, Theil FP. Prediction of pharmacokinetics prior to in vivo studies. II. Generic physiologically based pharmacokinetic models of drug disposition. J Pharm Sci. 2002;91:1358–1370. doi: 10.1002/jps.10128. [DOI] [PubMed] [Google Scholar]
- 4.Andersen ME, Clewell H, III, Krishnan K. Tissue dosimetry, pharmacokinetic modeling, and interspecies scaling factors. Risk Anal. 1995;15:533–537. doi: 10.1111/j.1539-6924.1995.tb00346.x. [DOI] [PubMed] [Google Scholar]
- 5.Thompson CM, Johns DO, Sonawane B, Barton HA, Hattis D, Tardif R, Krishnan K. Database for physiologically based pharmacokinetic (PBPK) modeling: physiological data for healthy and health-impaired elderly. J Toxicol Environ Health B Crit Rev. 2009;12:1–24. doi: 10.1080/10937400802545060. [DOI] [PubMed] [Google Scholar]
- 6.Yang F, Tong X, McCarver DG, Hines RN, Beard DA. Population-based analysis of methadone distribution and metabolism using an age-dependent physiologically based pharmacokinetic model. J Pharmacokinet Pharmacodyn. 2006;33:485–518. doi: 10.1007/s10928-006-9018-0. [DOI] [PubMed] [Google Scholar]
- 7.Thompson MD, Beard DA. Development of appropriate equations for physiologically-based pharmacokinetic modeling of permeability-limited and flow-limited transport. J Pharmacokinet Pharmacodyn. 2011;38:405–421. doi: 10.1007/s10928-011-9200-x. [DOI] [PMC free article] [PubMed] [Google Scholar]
- 8.Dixit R, Riviere J, Krishnan K, Andersen ME. Toxicokinetics and physiologically based toxicokinetics in toxicology and risk assessment. J Toxicol Environ Health B Crit Rev. 2003;6:1–40. doi: 10.1080/10937400306479. [DOI] [PubMed] [Google Scholar]
- 9.Poulin P, Theil FP. A Priori prediction of tissue : plasma partition coefficients of drugs to facilitate the use of physiologically-based pharmacokinetic models in drug discovery. J Pharm Sci. 2000;89:16–35. doi: 10.1002/(SICI)1520-6017(200001)89:1<16::AID-JPS3>3.0.CO;2-E. [DOI] [PubMed] [Google Scholar]
- 10.Jeffrey P, Summerfield SG. Challenges for blood-brain barrier (BBB) screening. Xenobiotica. 2007;37:1135–1151. doi: 10.1080/00498250701570285. [DOI] [PubMed] [Google Scholar]
- 11.Poulin P, Theil FP. Prediction of pharmacokinetics prior to in vivo studies. 1. Mechanism-based prediction of volume of distribution. J Pharm Sci. 2002;91:129–156. doi: 10.1002/jps.10005. [DOI] [PubMed] [Google Scholar]
- 12.EPI Suite. U.S. Environmental Protection Agency; 2008. [PubMed] [Google Scholar]
- 13.Blakey GE, Nestorov IA, Arundel PA, Aarons LJ, Rowland M. Quantitative structure-pharmacokinetics relationships: I. Development of a whole-body physiologically based model to characterize changes in pharmacokinetics across a homologous series of barbiturates in the rat. J Pharmacokinet Biopharm. 1997;25:277–312. doi: 10.1023/a:1025771608474. [DOI] [PubMed] [Google Scholar]
- 14.Kato Y, Hirate J, Sakaguchi K, Ueno M, Horikoshi I. Age-dependent changes in phenytoin tissue distribution in rats. J Pharmacobiodyn. 1987;10:166–172. doi: 10.1248/bpb1978.10.166. [DOI] [PubMed] [Google Scholar]
- 15.Singh P, Roberts MS. Dermal and underlying tissue pharmacokinetics of salicylic acid after topical application. J Pharmacokinet Biopharm. 1993;21:337–373. doi: 10.1007/BF01061687. [DOI] [PubMed] [Google Scholar]
- 16.Higuchi S, Urano C, Kawamura S. Determination of plasma protein binding of propafenone in rats, dogs and humans by highly sensitive gas chromatography-mass spectrometry. J Chromatogr. 1985;341:305–311. doi: 10.1016/s0378-4347(00)84044-x. [DOI] [PubMed] [Google Scholar]
- 17.Evans GH, Nies AS, Shand DG. Disposition of Propranolol .3. Decreased Half-Life and Volume of Distribution As A Result of Plasma Binding in Man, Monkey, Dog and Rat. J Pharmacol Exp Ther. 1973;186:114–122. [PubMed] [Google Scholar]
- 18.Dickinson RG, Harland RC, Ilias AM, Rodgers RM, Kaufman SN, Lynn RK, Gerber N. Disposition of Valproic Acid in the Rat - Dose-Dependent Metabolism, Distribution, Enterohepatic Recirculation and Choleretic Effect. J Pharmacol Exp Ther. 1979;211:583–595. [PubMed] [Google Scholar]
- 19.Montay G, Goueffon Y, Roquet F. Absorption, Distribution, Metabolic-Fate, and Elimination of Pefloxacin Mesylate in Mice, Rats, Dogs, Monkeys, and Humans. Antimicrob Agents Chemother. 1984;25:463–472. doi: 10.1128/aac.25.4.463. [DOI] [PMC free article] [PubMed] [Google Scholar]
- 20.Kawahara M, Nanbo T, Tsuji A. Physiologically based pharmacokinetic prediction of p-phenylbenzoic acid disposition in the pregnant rat. Biopharm Drug Dispos. 1998;19:445–453. doi: 10.1002/(sici)1099-081x(199810)19:7<445::aid-bdd123>3.0.co;2-p. [DOI] [PubMed] [Google Scholar]
- 21.Jusko WJ, Gretch M. Plasma and Tissue Protein-Binding of Drugs in Pharmacokinetics. Drug Metab Rev. 1976;5:43–140. doi: 10.3109/03602537608995839. [DOI] [PubMed] [Google Scholar]
- 22.Matsushima H, Kamimura H, Soeishi Y, Watanabe T, Higuchi S, Tsunoo M. Pharmacokinetics and plasma protein binding of tamsulosin hydrochloride in rats, dogs, and humans. Drug Metab Dispos. 1998;26:240–245. [PubMed] [Google Scholar]
- 23.Poulin P, Theil FP. Development of a novel method for predicting human volume of distribution at steady-state of basic drugs and comparative assessment with existing methods. J Pharm Sci. 2009;98:4941–4961. doi: 10.1002/jps.21759. [DOI] [PubMed] [Google Scholar]
- 24.Brown RP, Delp MD, Lindstedt SL, Rhomberg LR, Beliles RP. Physiological parameter values for physiologically based pharmacokinetic models. Toxicol Ind Health. 1997;13:407–484. doi: 10.1177/074823379701300401. [DOI] [PubMed] [Google Scholar]
- 25.Scheuplein RJ, Blank IH. Permeability of the skin. Physiol Rev. 1971;51:702–747. doi: 10.1152/physrev.1971.51.4.702. [DOI] [PubMed] [Google Scholar]
- 26.Evertt NB, Simmons B, Lasher EP. Distribution of blood (Fe 59) and plasma (I 131) volumes of rats determined by liquid nitrogen freezing. Circ Res. 1956;4:419–424. doi: 10.1161/01.res.4.4.419. [DOI] [PubMed] [Google Scholar]
- 27.Gallo JM, Amidon GL, Lee PI, Topp EM. Pharmacokinetics:Model Structure and Transport Systems. Transport Processes in Pharmaceutical Systems, ed.: Informa Healthcare. 2000:55. [Google Scholar]
- 28.Csajka C, Verotta D. Pharmacokinetic-pharmacodynamic modelling: history and perspectives. J Pharmacokinet Pharmacodyn. 2006;33:227–279. doi: 10.1007/s10928-005-9002-0. [DOI] [PubMed] [Google Scholar]
- 29.Teorell T. Kinetics of distribution of substances administered to the body I The extravascular modes of administration. Archives Internationales de Pharmacodynamie et de Therapie. 1937;57:205–225. [Google Scholar]
- 30.Teorell T. Kinetics of distribution of substances administered to the body II The intravascular modes of administration. Archives Internationales de Pharmacodynamie et de Therapie. 1937;57:226–240. [Google Scholar]
- 31.Bischoff KB, Dedrick RL, Zaharko DS, Longstre Ja. Methotrexate Pharmacokinetics. J Pharm Sci. 1971;60:1128. doi: 10.1002/jps.2600600803. [DOI] [PubMed] [Google Scholar]
- 32.Ramsey JC, Andersen ME. A physiologically based description of the inhalation pharmacokinetics of styrene in rats and humans. Toxicol Appl Pharmacol. 1984;73:159–175. doi: 10.1016/0041-008x(84)90064-4. [DOI] [PubMed] [Google Scholar]
- 33.Bischoff KB. Physiological Pharmacokinetics. Bull Math Biol. 1986;48:309–322. doi: 10.1007/BF02459684. [DOI] [PubMed] [Google Scholar]
- 34.Espie P, Tytgat D, Sargentini-Maier ML, Poggesi I, Watelet JB. Physiologically based pharmacokinetics (PBPK) Drug Metab Rev. 2009;41:391–407. doi: 10.1080/10837450902891360. [DOI] [PubMed] [Google Scholar]
- 35.Khor SP, Mayersohn M. Potential Error in the Measurement of Tissue to Blood Distribution Coefficients in Physiological Pharmacokinetic Modeling - Residual Tissue Blood .1. Theoretical Considerations. Drug Metab Dispos. 1991;19:478–485. [PubMed] [Google Scholar]
- 36.Khor SP, Bozigian H, Mayersohn M. Potential Error in the Measurement of Tissue to Blood Distribution Coefficients in Physiological Pharmacokinetic Modeling - Residual Tissue Blood .2. Distribution of Phencyclidine in the Rat. Drug Metab Dispos. 1991;19:486–490. [PubMed] [Google Scholar]
- 37.Friden M, Ljungqvist H, Middleton B, Bredberg U, Hammarlund-Udenaes M. Improved measurement of drug exposure in the brain using drug-specific correction for residual blood. J Cereb Blood Flow Metab. 2010;30:150–161. doi: 10.1038/jcbfm.2009.200. [DOI] [PMC free article] [PubMed] [Google Scholar]
- 38.Junot C, Nicolet L, Ezan E, Gonzales MF, Menard J, Azizi M. Effect of angiotensin-converting enzyme inhibition on plasma, urine, and tissue concentrations of hemoregulatory peptide acetyl-Ser-Asp-Lys-Pro in rats. J Pharmacol Exp Ther. 1999;291:982–987. [PubMed] [Google Scholar]
- 39.Giudicelli C, Dricot E, Moati F, Strolin-Benedetti M, Giudicelli JF. Is it important to correct apparent drug tissue concentrations for blood contamination in the dog? Fundam Clin Pharmacol. 2004;18:281–286. doi: 10.1111/j.1472-8206.2004.00246.x. [DOI] [PubMed] [Google Scholar]
- 40.Gueorguieva II, Nestorov IA, Rowland M. Fuzzy simulation of pharmacokinetic models: case study of whole body physiologically based model of diazepam. J Pharmacokinet Pharmacodyn. 2004;31:185–213. doi: 10.1023/b:jopa.0000039564.35602.78. [DOI] [PubMed] [Google Scholar]
- 41.Gallo JM, Lam FC, Perrier DG. Area Method for the Estimation of Partition-Coefficients for Physiological Pharmacokinetic Models. J Pharmacokinet Biopharm. 1987;15:271–280. doi: 10.1007/BF01066322. [DOI] [PubMed] [Google Scholar]
Associated Data
This section collects any data citations, data availability statements, or supplementary materials included in this article.