

Abstract
Objective
We sought to explain the recent increase in the death rate from falls among Americans aged 65 years and older.
Methods
Using the CDC WONDER online database, a longitudinal analysis of subgroups of fall mortality based on the International Classification of Diseases, 10th Revision (ICD-10) was conducted in older adults and in younger people. We used linear regression to examine the statistical significance of trends in mortality rates during 1999–2007.
Results
The overall mortality rate from falls increased by 55% among older Americans (≥65 years of age) during 1999–2007, from 29 per 100,000 population to 45 per 100,000 population. For those aged ≥65 years, the largest increase by far (698%) occurred in the subgroup “other falls on the same level,” followed by a moderate increase in falls involving wheelchairs or furniture (48%). The steepest increases at all ages occurred from 1999 to 2000, after ICD-10 took effect. State-level analysis confirmed the findings for the entire United States. From 1999 to 2007, total mortality from falls decreased by 5% in people younger than 45 years of age and increased by 44% for those aged 45–64 years; mortality from “other falls on the same level” increased by 202% and 431%, respectively, in these age groups.
Conclusions
Because the reported minor increases in emergency department and hospitalization rates for falls were insignificant, the almost sevenfold increase in death rates from “other falls on the same level” strongly suggests an effect of improved reporting quality.
Falls among older adults are a serious public health problem. Each year, one in three Americans aged 65 years and older falls.1,2 The annual direct and indirect cost of fall injuries is expected to reach $55 billion (in 2007 U.S. dollars) by 2020.3 A substantial increase in the death rate from unintentional falls has recently been reported among older Americans.4–9 This increase is perplexing because neither the nonfatal fall rate of 2001–2007 based on Web-based Injury Statistics Query and Reporting System data for patients treated in emergency departments (EDs), nor the fall hospitalization rate of 1997–2005 based on the National Hospital Discharge Survey increased significantly.9,10 In older people, the rate of ED visits for falls per 100,000 population rose from 4,631 in 2001 to 4,944 in 2007—a 6% increase—compared with a 55% increase in the death rate. This contrasting evidence has raised a critical question: Does the recent increase in fall-related mortality among older Americans reflect an actual increase in fatal falls?
There are several possible explanations for the recent increase in deaths coded with a fall as the underlying cause: (1) an increase in fatal injuries from falls; however, the lack of a corresponding increase in ED cases and in hospitalizations negates this possibility;9,10 (2) an increase in the case fatality rate, which also appears to be equally unlikely given the general improvement in trauma care and treatment of complications in the United States; and (3) a change in reporting the underlying cause of death,9 which could have led to the identification of more deaths as having been due to falls.
To provide an explanation of the recent increase in fall mortality, we analyzed changes in mortality during 1999–2007 in the many subgroups of falls. Subgroup analysis provided the opportunity to determine whether the increase was associated with certain types of falls. We studied the fall mortality rates of older Americans, as well as younger age groups, at the national and state level.
METHODS
Data source
We extracted U.S. mortality data from the Centers for Disease Control and Prevention (CDC) WONDER, the Compressed Mortality File produced by the Office of Analysis and Epidemiology in CDC's National Center for Health Statistics (NCHS). The Compressed Mortality File is a county-level national mortality and population database spanning the years 1968–2007; data are available on CDC WONDER for the years 1979–2007. Underlying cause of death is classified in accordance with the International Classification of Diseases (ICD). Deaths for 1979–1998 were classified using the ICD Ninth Revision (ICD-9), while deaths for 1999 and beyond were classified using the ICD 10th Revision (ICD-10).11
Statistical analysis
Analyses were specific to unintentional falls. Because these types of falls comprise 99.4% of fatal falls at age 65 years or older, we dropped the modifier “unintentional.”
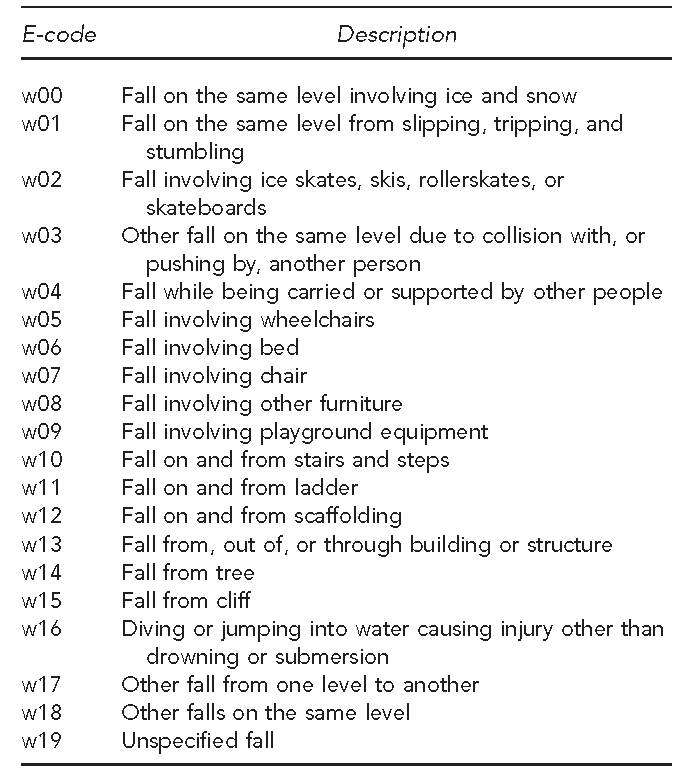
The ICD-10 includes 20 e-codes (sub-causes) for falls, from w00 to w19 (Figure 1). Because the preliminary analysis showed that most of the 20 categories of falls had few deaths and an unstable mortality rate (data not shown), we combined the sub-causes into seven groups based on the mechanism of falls: group 1—slipping/tripping (w00–w01), group 2— involving ice skates/skis/rollerskates/skateboards (w02) or involving another person (w03–w04), group 3—involving wheelchair/furniture (w05–w08), group 4—on/from stairs (w10), group 5—other specified fall (w09, w11–w17), group 6—other falls on the same level (w18), and group 7—unspecified fall (w19).
Figure 1.
20 subcategories of falls in ICD-10a
aSource: World Health Organization. International classification of diseases (ICD) [cited 2011 Mar 1]. Available from: URL: http://www.who.int/classifications/icd
ICD-10 = International Classification of Diseases, 10th Revision
We first examined the overall national trend in subgroup-specific mortality rates from 1999 to 2007 to determine the statistical significance of changes. Because groups 1, 2, and 5 did not show a significant increase among older adults, we combined them into a single group. The preliminary results did not vary substantially by gender, race/ethnicity, age, or urbanization, so results for these subgroups are not shown. We did not analyze nonfatal injuries from falls because morbidity data for e-code subgroups were not available.
CDC WONDER suggests that death rates based on counts of ≤20 are unreliable because of a relative standard error of ≥23%.11 Because few states have stable mortality rates for specific sub-causes and for all years (1999–2007), for state-level analysis, we combined the sub-causes of falls with specific causes (w00–w17) and unspecified falls (w19) into a single category, as they displayed obviously different time trends in mortality rate compared with other falls on the same level (w18).
To identify sub-causes that most contributed to the recent increase in fall mortality in older adults, we compared those aged ≥65 years with those aged 0–44 years and 45–64 years. We used linear regression to examine the statistical significance of trends in mortality rates during the study period. We used the percent change in rates to measure the linear trend, which was calculated as regression coefficient 3 100 3 8 divided by the rate in 1999. We considered an alpha of p<0.05 to be statistically significant. We used Stata® version 10.0 for data analysis.12
RESULTS
Sub-cause analysis of fall mortality among older adults
As shown in Table 1, the mortality rate from unintentional falls among older adults increased from 29.4 per 100,000 population in 1999 to 45.3 per 100,00 population in 2007, a 55% increase when calculated by the aforementioned formula. The largest subgroup increase in fall mortality between 1999 and 2007 was observed in other falls on the same level (w18) (698%), followed by a 48% increase in the relatively small group of falls involving wheelchairs/furniture (w05–w08).
Table 1.
Mortality rates per 100,000 population from unintentional falls among people ≥65 years of age: U.S., 1999–2007

aSource: World Health Organization. International classification of diseases (ICD) [cited 2011 Mar 1]. Available from: URL: http://www.who.int/classifications/icd
bThe percent change in rates was calculated as regression coefficient × 100 × 8 divided by the rate in 1999.
cStatistically significant at p<0.01
ICD-10 = International Classification of Diseases, 10th Revision
Changes by year, age group, and sub-cause
Fall death rates in younger age groups—those aged 0–44 years and 45–64 years—were much lower but generally followed the same pattern of increase (although less extreme) as that of adults aged ≥65 years during 1999–2007 (Figure 2). In 2007, the three age groups had 1,252, 3,043, and 18,334 deaths from falls, respectively. The predominant increase was in other falls on the same level (w18), with changes of 202% and 431% in those aged ≤44 years and 45–64 years, respectively, compared with 698% for those aged ≥65 years. In each age group, the most dramatic jump in rates for falls on the same level occurred between 1999 and 2000, during which the rate increased at least twofold. After 2000, the rise in mortality from other falls on the same level slowed but was still more striking than increases observed in all other falls.
Figure 2.

Mortality rate per 100,000 population from unintentional falls, by age, sub-cause, and year: U.S., 1999–2007
State-level analysis
Between 1999 and 2007, 37 states and the District of Columbia experienced a significant increase in death rate from falls in elderly people. Seven of the 37 states (Arizona, California, Illinois, New Mexico, Ohio, Oregon, and Washington) had stable death rates based on having more than 20 deaths from other falls on the same level each year during 1999–2007. All seven states displayed a far greater increase in other falls on the same level than in other categories of falls (Table 2). Due to unstable death rates with a numerator of ≤20, corresponding state-level analyses for the elderly in other states and for people younger than 65 years of age were omitted.
Table 2.
Percent change in fall death ratesa for people aged ≥65 years in seven states with more than 20 cases of fall-related deaths per year: U.S., 1999–2007

aThe percent change in fall death rate was calculated as regression coefficient 3 100 3 8 divided by the rate in 1999.
bSource: World Health Organization. International classification of diseases (ICD) [cited 2011 Mar 1]. Available from: URL: http://www.who.int/classifications/icd
cStatistically significant at p<0.01
ICD-10 = International Classification of Diseases, 10th Revision
DISCUSSION
The recent rise in the death rate from falls of older Americans during 1999–2007 was primarily due to the previously unreported dramatic nearly sevenfold increase in mortality from the subset other falls on the same level. The same phenomenon occurred in older people in all states having stable fall death rates and, to a lesser extent, among younger age groups.
Falls are more likely to result in delayed death following minor injury among the elderly than in other age groups.13 Typically, the interval from injury to death is longer for minor or moderate injury than for serious injury. As the interval between injury and death increases, the cause of death is more likely to be attributed to a terminal illness and less likely to be attributed to injury, causing variation in assigning the underlying cause of death.14
Other falls on the same level is a category of unspecified fatal fall that is most common in the elderly. A fall on the same level when a person is standing or walking generally does not result in injury that is immediately life-threatening. If death follows a minor injury, such as a rib fracture, it is likely to occur weeks or months later as the result of pneumonia or other complications.15 People who fill out the underlying cause of death on the death certificate may therefore ignore the fall, and may consider the underlying cause of death to be the terminal illness (e.g., pneumonia or other illness). Older adults have been shown to have significant mortality from minor injuries (Injury Severity Score <9) that have little potential for death in people who are younger than 50 years of age.13
The United Nations defines the underlying cause of death as “(a) the disease or injury which initiated the train of events leading directly to death, or (b) the circumstances of the accident or violence which produced the fatal injury.”16 A review of the literature by Cryer and colleagues14 describing discrepancies in the reporting of late deaths, especially those due to falls, underscores the need for improved training of nosologists, medical examiners, and coroners. For example, Betz et al.17 presented physicians and coroners with clinical scenarios of patients who died; however, only 35% correctly indicated that a fall was the underlying cause of death in a person who sustained intracranial bleeding following a fall.
Underscoring the likelihood that the underlying cause of late deaths following falls is often misreported, Goldacre18 found that only 40% of the death certificates of people who were admitted to a hospital in the Oxford Regional Health Authority with a main diagnosis of injury or poisoning, and then died within a year, specified an injury as the underlying cause of death. Most tellingly, Langlois and colleagues19 reported that the death rate from falls in the elderly was nearly three times as high in New Zealand as in the U.S., while hospitalization rates for both falls and hip fractures were similar for the two countries. They attributed the difference to coding practices, with a fall-related death in the U.S. being more likely than in New Zealand to be coded with a terminal illness as the underlying cause.
In the U.S., ICD-10 first went into effect in 1999. Although there were moderate increases in reported fall mortality rates from 2000 to 2007, the biggest jump occurred from 1999 to 2000, when rates of deaths coded as other falls on the same level at least doubled in all age groups (Figure 2). The jump strongly suggests a major change in death certification practices after implementation of ICD-10, followed by a gradual improvement in the quality of certification of belated deaths following falls. A similar but less pronounced increase in fall mortality of older adults occurred between 1993 and 1998 (during the period when falls were recorded using ICD-9 e-codes),11 probably reflecting the beginning of greater attention to correct coding (Figures 3 and 4). To improve the completeness of e-code reporting and to narrow the variation in completeness of e-code reporting across states,20 many efforts have been implemented by the U.S. government in recent years, such as the development of strategies to improve external cause-of-injury coding in state-based hospital discharge and ED data systems.21 Better reporting may also be due to increasing awareness in the past decade of the significance of falls and their contribution to mortality, especially in older age groups.
Figure 3.
Mortality per 100,000 population from unintentional falls among adults aged ≥65 years: U.S., 1979–1998a
aSource: Centers for Disease Control and Prevention. CDC WONDER: compressed mortality file, underlying cause of death [cited 2011 Mar 1]. Available from: URL: http://wonder.cdc.gov/mortSQL.html

Figure 4.
Nine subcategories of falls in ICD-9a
aSource: Centers for Disease Control and Prevention. CDC WONDER: compressed mortality file, underlying cause of death [cited 2011 Mar 1]. Available from: URL: http://wonder.cdc.gov/mortSQL.html
ICD-9 = International Classification of Diseases, Ninth Revision

Because neither the ED visit rate nor the hospitalization rate for falls showed a significant increase during 2001–20079 (ED visits) or during 1997–2005 (hospital discharges),10 the dramatic increase in other falls on the same level was likely the result of improved coding; namely, coding the underlying cause of death as a fall (rather than as pneumonia or some other complication) when delayed death followed a minor injury. In the future, data linkage between different data sources may be a better way to detect deaths related to falls.
In addition to the almost sevenfold increase in deaths from other falls on the same level among those aged ≥65 years, a moderate increase for all ages was identified in the small group of fatal falls involving wheelchairs/furniture and stairs. As with the increase in falls on the same level, this increase probably reflects improvements in specification of the underlying cause of death, but it also reminds us of the possibility of a real increase in exposure to risk factors for falls.
The authenticity of the recent increase in fall mortality is especially important for the development of fall-prevention strategies for older adults. The indirect evidence of this study offers an explanation for understanding the recent increase in fatal falls in older adults and emphasizes the value of examining the quality of reporting of the underlying cause of death in injuries and of improvement in injury data recording.
CONCLUSION
The recent dramatic increase in the fall death rate in older Americans is most likely the effect of improved reporting quality. However, more rigorous testing of the hypothesis may be warranted.
Acknowledgments
The authors thank Dr. Li-hui Chen and Dr. Margaret Warner at the National Center for Health Statistics (NCHS), CDC, for their thoughtful suggestions for interpreting findings.
Footnotes
This study was supported by the Faculty Development Award from the China Medical Board of New York, the 2009 New Century Scholar Support Program of the Ministry of Education of China (NCET-10-0782), and the National Center for Injury Research and Prevention, Centers for Disease Control and Prevention (CDC) grant #CCR302486.
The study was based on publicly available data, and the online agreement for data use restrictions has been signed, ensuring that the data collected by NCHS may be used only for the purposes for which they were obtained; any effort to determine the identity of any reported cases, or to use the information for any purpose other than for health statistical reporting and analysis, is against the law. The study was exempted from review by the Johns Hopkins Bloomberg School of Public Health Institutional Review Board. The findings and conclusions in this article are those of the authors and do not necessarily reflect the views of CDC.
REFERENCES
- 1.Hornbrook MC, Stevens VJ, Wingfield DJ, Hollis JF, Greenlick MR, Ory MG. Preventing falls among community-dwelling older persons: results from a randomized trial. The Gerontologist. 1994;34:16–23. doi: 10.1093/geront/34.1.16. [DOI] [PubMed] [Google Scholar]
- 2.Hausdorff JM, Rios DA, Edelber HK. Gait variability and fall risk in community-living older adults: a 1-year prospective study. Arch Phys Med Rehabil. 2001;82:1050–6. doi: 10.1053/apmr.2001.24893. [DOI] [PubMed] [Google Scholar]
- 3.Englander F, Hodson TJ, Terregrossa RA. Economic dimensions of slip and fall injuries. J Forensic Sci. 1996;41:733–46. [PubMed] [Google Scholar]
- 4.Paulozzi LJ, Ballesteros MF, Stevens JA. Recent trends in mortality from unintentional injury in the United States. J Safety Res. 2006;37:277–83. doi: 10.1016/j.jsr.2006.02.004. [DOI] [PubMed] [Google Scholar]
- 5.Hosseini H, Hosseini N. Epidemiology and prevention of fall injuries among the elderly. Hosp Top. 2008;86:15–20. doi: 10.3200/HTPS.86.3.15-20. [DOI] [PubMed] [Google Scholar]
- 6.Orces CH. Trends in fall-related mortality among older adults in Texas. Tex Med. 2008;104:55–9. [PubMed] [Google Scholar]
- 7.Dessypris N, Dikalioti SK, Skalkidis I, Sergentanis TN, Terzidis A, Petridou ET. Combating unintentional injury in the United States: lessons learned from the ICD-10 classification period. J Trauma. 2009;66:519–25. doi: 10.1097/TA.0b013e31817dac79. [DOI] [PubMed] [Google Scholar]
- 8.Fatalities and injuries from falls among older adults—United States, 1993–2003 and 2001–2005 [published erratum appears in MMWR Morb Mortal Wkly Rep 2006;55(48):1303] MMWR Morb Mortal Wkly Rep. 2006;55(45):1221–4. [PubMed] [Google Scholar]
- 9.Hu G, Baker SP. Recent increases in fatal and nonfatal injury among people aged 65 years and over in the USA. Inj Prev. 2010;16:26–30. doi: 10.1136/ip.2009.023481. [DOI] [PubMed] [Google Scholar]
- 10.Orces CH. Trends in hospitalization for fall-related injury among older adults in the United States, 1988–2005. Ageing Res. 2010;1:e1. [Google Scholar]
- 11.Centers for Disease Control and Prevention (US), National Center for Health Statistics. CDC WONDER: compressed mortality file, underlying cause of death [cited 2011 Mar 1] Available from: URL: http://wonder.cdc.gov/mortSQL.html.
- 12.StataCorp . Stata®: Version 10.0. College Station (TX): StataCorp.; 2007. [Google Scholar]
- 13.Baker SP, O’Neill B, Haddon W, Jr, Long WB. The injury severity score: a method for describing patients with multiple injuries and evaluating emergency care. J Trauma. 1974;14:187–96. [PubMed] [Google Scholar]
- 14.Cryer C, Gulliver P, Samaranayaka A, Davie G, Langley J, Fowler C. Wellington (New Zealand): University of Otago, Injury Prevention Research Unit; [cited 2011 Nov 17]. New Zealand Injury Prevention Strategy indicators of injury death: are we counting all the cases? March 2010. Also available from: URL: http://ipru3.otago.ac.nz/ipru/ReportsPDFs/OR085.pdf. [Google Scholar]
- 15.Conner J, Langley J, Cryer C. Wellington (New Zealand): University of Otago, Injury Prevention Research Unit; 2006. [cited 2011 Mar 1]. International comparison of injury deaths: falls—a report to the New Zealand Injury Prevention Strategy Secretariat. Also available from: URL: http://www.nzips.govt.nz/documents/international-falls-sept-06.pdf. [Google Scholar]
- 16.United Nations. Handbook of vital statistics systems and methods, vol. 1: legal, organization, and technical aspects. New York: United Nations; 1991. [Google Scholar]
- 17.Betz ME, Kelly SP, Fisher J. Death certificate inaccuracy and underreporting of injury in elderly people. J Am Geriatr Soc. 2008;56:2267–72. doi: 10.1111/j.1532-5415.2008.02001.x. [DOI] [PubMed] [Google Scholar]
- 18.Goldacre MJ. Cause-specific mortality: understanding uncertain tips of the disease iceberg. J Epidemiol Community Health. 1993;47:491–6. doi: 10.1136/jech.47.6.491. [DOI] [PMC free article] [PubMed] [Google Scholar]
- 19.Langlois JA, Smith GS, Baker SP, Langley JD. International comparisons of injury mortality in the elderly: issues and differences between New Zealand and the United States. Int J Epidemiol. 1995;24:136–43. doi: 10.1093/ije/24.1.136. [DOI] [PubMed] [Google Scholar]
- 20.Coben JH, Steiner CA, Barrett M, Merrill CT, Adamson D. Completeness of cause of injury coding in healthcare administrative databases in the United States, 2001. Inj Prev. 2006;12:199–201. doi: 10.1136/ip.2005.010512. [DOI] [PMC free article] [PubMed] [Google Scholar]
- 21.Annest JL, Fingerhut LA, Gallagher SS, Grossman DC, Hedegaard H, Johnson RL, et al. Strategies to improve external cause-of-injury coding in state-based hospital discharge and emergency department data systems: recommendations of the CDC Workgroup for Improvement of External Cause-of-Injury Coding. MMWR Recomm Rep. 2008;57(RR-1):1–15. [PubMed] [Google Scholar]