

Abstract
Herein we demonstrate that nano-graphene can be specifically directed to the tumor neovasculature in vivo through targeting of CD105 (i.e. endoglin), a vascular marker for tumor angiogenesis. The covalently functionalized nano-graphene oxide (GO) exhibited excellent stability and target specificity. Pharmacokinetics and tumor targeting efficacy of the GO conjugates were investigated with serial non-invasive positron emission tomography (PET) imaging and biodistribution studies, which were validated by in vitro, in vivo, and ex vivo experiments. The incorporation of an active targeting ligand (TRC105, a monoclonal antibody that binds to CD105) led to significantly improved tumor uptake of functionalized GO, which was specific for the neovasculature with little extravasation, warranting future investigation of these GO conjugates for cancer-targeted drug delivery and/or photothermal therapy to enhance therapeutic efficacy. Since poor extravasation is a major hurdle for nanomaterial-based tumor targeting in vivo, this study also establishes CD105 as a promising vascular target for future cancer nanomedicine.
Keywords: Nano-graphene, tumor angiogenesis, positron emission tomography (PET), CD105 (endoglin), molecular imaging, 64Cu, cancer
Graphene, a two-dimensional sp2-bonded carbon sheet with intriguing electrical, mechanical, optical, and chemical properties, has attracted tremendous interests in a wide range of research fields such as biomedicine.1–7 Starting from 2008, many research groups have developed graphene-based biosensors using a variety of mechanisms for sensitive detection of biological species.8–13 We and others have also utilized functionalized nano-graphene with ultra-high surface area as a novel nano-carrier for loading and delivery of drugs and genes.2, 14–19 In vivo applications of nano-graphene for cancer treatment such as photothermal therapy have also been explored, showing encouraging therapeutic effects in animal models.20, 21 Meanwhile, the potential toxicity of graphene has also been investigated in vitro and in vivo.2, 22–27 Although still under debate, most reports have agreed that the toxicity of graphene is closely associated with its surface chemistry. Recently, our own study suggested that polyethylene glycol (PEG) functionalized nano-graphene could be gradually excreted from mice after intravenous injection, without rendering noticeable toxicity to the treated animals.23
To the best of our knowledge, active tumor targeting of graphene in living subjects through the incorporation of specific ligands has not been achieved to date. In this study, we explored the use of nano-graphene for in vivo tumor targeting and quantitatively evaluated the pharmacokinetics and tumor targeting efficacy through serial non-invasive positron emission tomography (PET) imaging. To ensure in vivo stability of the nano-graphene conjugates, we used 10–50 nm graphene oxide (GO) sheets with covalently conjugated six-arm branched PEG (10 kDa) chains,16, 20 which have ample amino groups on the surface for further covalent conjugation of various functional entities (image label, targeting ligand, etc.).
We chose CD105 (endoglin) as the target in this study. Almost exclusively expressed on proliferating endothelial cells, CD105 is an ideal marker for tumor angiogenesis (i.e. new blood vessel formation).28–30 Since the expression level of CD105 correlates with poor prognosis in more than 10 solid tumor types,31 it holds tremendous clinical potential as a prognostic, diagnostic, and therapeutic vascular target in cancer. Furthermore, CD105 is not readily detectable in resting endothelial cells or normal organs, which makes it an attractive target for molecular imaging and therapy of cancer. One of the key challenges for nanomaterial-based tumor targeting and imaging is efficient extravasation.32, 33 In this regard, CD105 is highly desirable for tumor targeting with nanomaterials, since extravasation is not required to observe the tumor signal. TRC105, a human/murine chimeric IgG1 monoclonal antibody (mAb) which binds to both human and murine CD105, was used for CD105 targeting in this study.28 A multicenter Phase 1 first-in-human dose-escalation trial of TRC105 was recently completed and multiple Phase 2 therapy trials are underway in patients with various solid tumor types.34 Promising clinical data from these studies warrant the development of TRC105-based imaging/therapeutic agents, which can play important roles in multiple facets of future cancer patient management.
The goal of this proof-of-principle study was to investigate whether TRC105 can be used as the ligand for CD105 targeting of covalently functionalized GO in animal tumor models, which can open up new avenues for future image-guided drug delivery and cancer therapy, as well as establish GO as a promising nanoplatform for cancer theranostics. To evaluate the biodistribution, pharmacokinetics, and tumor targeting efficacy of functionalized GO in tumor-bearing mice, serial PET imaging was carried out, where the GO conjugates was labeled with 64Cu (a PET isotope with a physical half-life of 12.7 h) through 1, 4, 7-triazacyclononane-1, 4, 7-triacetic acid (NOTA, one of the best chelators for 64Cu-labeling35, 36). The rationale for using PET is that PET is non-invasive, sensitive, quantitative, and clinically relevant with superb tissue penetration.37–40 To validate the in vivo data, various in vitro, in vivo, and ex vivo studies and control experiments were also carried out to confirm CD105 specificity of the GO conjugates.
RESULTS AND DISCUSSION
Syntheses and characterization of GO conjugates
The synthesis of PEGylated GO (herein termed “GO-PEG-NH2”), starting from graphite oxide, has been reported previously. 16, 20 Four conjugates of GO-PEG-NH2 were prepared and investigated in this study: NOTA-GO, NOTA-GO-TRC105, FITC-GO (FITC denotes fluorescein isothiocyanate), and FITC-GO-TRC105. A schematic structure of these conjugates is shown in Figure 1a. Since all conjugates contain the same six-arm branched PEG chains (10 kDa) covalently linked to GO, “PEG” was omitted from the acronyms of the final conjugates for clarity considerations. The two conjugates with NOTA (i.e. NOTA-GO and NOTA-GO-TRC105) were subsequently labeled with 64Cu for in vivo PET imaging and biodistribution studies, while the two conjugates with FITC (i.e. FITC-GO and FITC-GO-TRC105) were employed for in vitro evaluation of CD105 binding affinity and specificity using fluorescence techniques.
Figure 1.
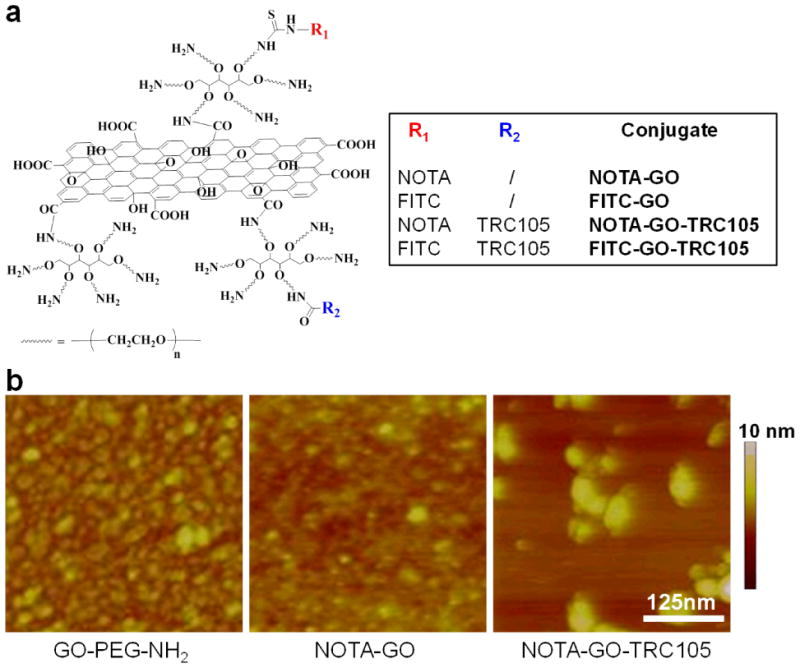
A schematic representation (a) and representative atomic force microscopy images (b) of the nano-graphene conjugates used in this study.
Based on atomic force microscopy (AFM) measurements, GO-PEG-NH2, NOTA-GO, and NOTA-GO-TRC105 are all small sheets with comparable size range of 10 – 50 nm (Figure 1b). In addition to AFM, dynamic light scattering (DLS) and zeta-potential measurements were also carried out. Based on DLS, the average diameter of GO-PEG-NH2, NOTA-GO, and NOTA-GO-TRC105 was 21.7 ± 0.7 nm, 21.9 ± 0.6 nm, and 27.0 ± 0.9 nm, respectively (Supporting Information Figure S1). Since NOTA is quite small in size while TRC105 is a macromolecule of 150 kDa molecular weight (5–10 nm in size), the size difference is reflected in the overall diameter of the GO conjugates. The zeta-potential values of GO-PEG-NH2, NOTA-GO, and NOTA-GO-TRC105 were measured to be −4.85 ± 4.99 mV, −9.46 ± 4.74 mV, and −0.08 ± 5.35 mV, respectively. Comparing these values, NOTA conjugation significantly changed the zeta-potential of GO-PEG-NH2, and TRC105 conjugation also led to a pronounced difference. Together, the results from AFM, DLS, and zeta-potential measurements strongly suggested successful conjugation of NOTA and TRC105 onto GO.
In vitro studies of GO conjugates
To evaluate the CD105-targeting characteristics of the GO conjugates, human umbilical vein endothelial cells (HUVECs, high CD105 expression41, 42) and MCF-7 human breast cancer cells (CD105 negative41, 42) were used for flow cytometry analysis and microscopy studies of FITC-GO and FITC-GO-TRC105. As can be seen in Figure 2a, treatment with FITC-GO-TRC105 greatly enhanced the mean fluorescence intensity of HUVECs (~570 fold higher than the unstained cells), whereas treatment with FITC-GO and the “blocking” group both gave little fluorescence enhancement (~6 fold higher than the unstained cells and ~100 fold lower than FITC-GO-TRC105). Fluorescence signal on MCF-7 cells was minimal for all groups, indicating low non-specific binding of the surface functionalized GO conjugates in cell culture. Taken together the results of flow cytometry analysis (Figure 2a) and microscopy studies (Figure 2b), FITC-GO-TRC105 exhibited strong and specific binding to CD105 at the cellular level with minimal non-specific binding, which warranted further in vivo investigation of NOTA-GO-TRC105.
Figure 2.

In vitro characterization of the GO conjugates. (a) Flow cytometry analysis of the GO conjugates in HUVECs (CD105 positive) and MCF-7 breast cancer cells (CD105 negative). (b) Representative fluorescence images of HUVEC and MCF-7 cells stained with FITC-GO or FITC-GO-TRC105. (c) Serum stability test showing that the vast majority of 64Cu remains intact on the GO after incubation in complete mouse serum for 48 h.
NOTA-GO-TRC105 and NOTA-GO were labeled with 64Cu. The decay-corrected radiochemical yield was 76 ± 8 %, based on 30 μg of NOTA-GO-TRC105 or NOTA-GO per 37 MBq of 64Cu, with radiochemical purity of > 95%. The specific activity of both 64Cu-NOTA-GO-TRC105 and 64Cu-NOTA-GO was ~0.9 GBq/mg, assuming complete recovery of 64Cu-NOTA-GO-TRC105 and 64Cu-NOTA-GO after size exclusion chromatography. To ensure that the 64Cu-NOTA-GO-TRC105 and 64Cu-NOTA-GO are sufficiently stable for in vivo applications, serum stability studies were carried out. More than 90% of 64Cu remained on the GO conjugates over a 48 h incubation period (Figure 2c), indicating excellent stability of the 64Cu-NOTA complex, which was covalently conjugated to the GO surface through PEG chains. The slight reduction in percentage of intact 64Cu during the early two time points was likely due to the removal of trace amount of unconjugated 64Cu in the mixture by filtration, which was not completely separated from the GO conjugates by size exclusion chromatography. Since PET imaging detects the radiolabel (i.e. 64Cu) instead of the GO conjugates themselves, excellent stability of the radiolabel on the GO conjugates can ensure that the signal observed in PET truly reflects the distribution of the GO conjugates.
In vivo PET imaging and biodistribution studies
Based on our previous experience of in vivo tumor targeting and imaging with radiolabeled nanomaterials,43–47 the time points of 0.5, 3, 16, 24, and 48 h post-injection (p.i.) were chosen for serial PET scans. The coronal slices that contain the 4T1 tumor are shown in Figure 3a and representative PET/CT fused images of a mouse at 16 h p.i. of 64Cu-NOTA-GO-TRC105 are shown in Figure 3b. Quantitative data obtained from region-of-interest (ROI) analysis of the PET results are shown in Figure 4.
Figure 3.
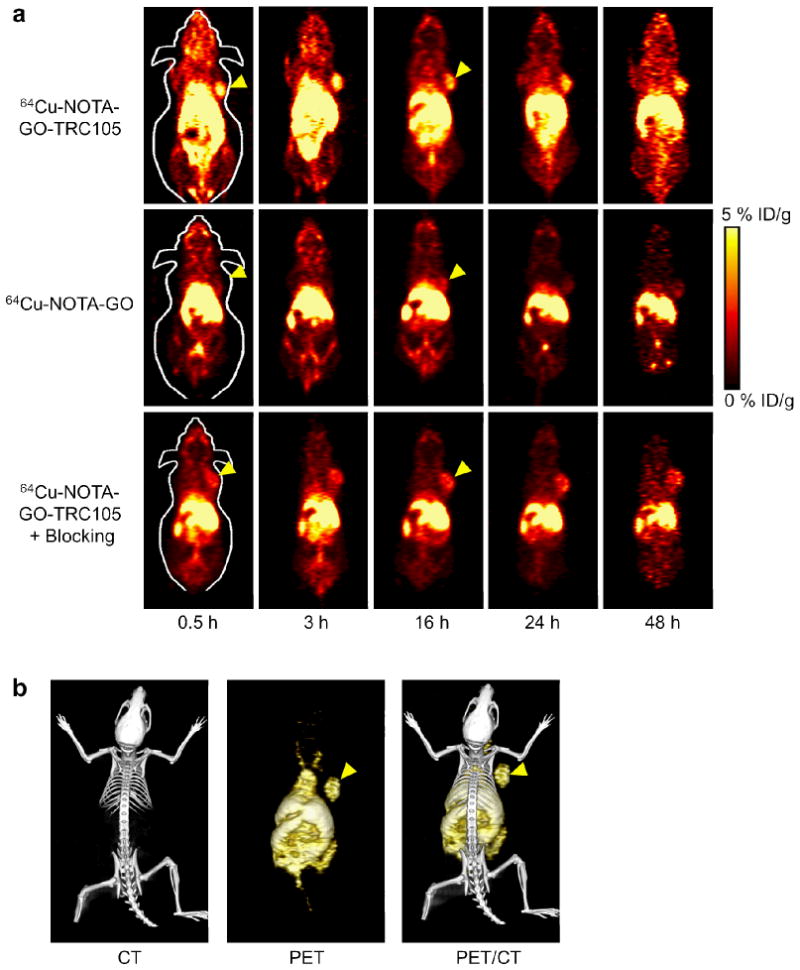
In vivo PET/CT imaging of 64Cu-labeled GO conjugates in 4T1 murine breast tumor-bearing mice. (a) Serial coronal PET images of 4T1 tumor-bearing mice at different time points post-injection of 64Cu-NOTA-GO-TRC105, 64Cu-NOTA-GO, or 64Cu-NOTA-GO-TRC105 after a pre-injected blocking dose of TRC105. Tumors are indicated by arrowheads. (b) Representative PET/CT images of 64Cu-NOTA-GO-TRC105 in 4T1 tumor-bearing mice at 16 h post-injection.
Figure 4.

Quantitative analysis of the PET data. (a) Time-activity curves of the liver, 4T1 tumor, blood, and muscle upon intravenous injection of 64Cu-NOTA-GO-TRC105. (b) Time-activity curves of the liver, 4T1 tumor, blood, and muscle upon intravenous injection of 64Cu-NOTA-GO-TRC105, after a blocking dose of TRC105. (c) Time-activity curves of the liver, 4T1 tumor, blood, and muscle upon intravenous injection of 64Cu-NOTA-GO. (d) Comparison of the 4T1 tumor uptake in the three groups. The differences between 4T1 tumor uptake of 64Cu-NOTA-GO-TRC105 and the two control groups were statistically significant (P < 0.05) at all time points examined, except that between 64Cu-NOTA-GO-TRC105 and the “blocking” group at 48 h post-injection. All data represent 4 mice per group.
All nanomaterials, when intravenously injected, are cleared from the animal body primarily through the hepatobiliary and/or renal pathway. The GO conjugates investigated in this study are cleared mostly through the hepatobiliary pathway since their hydrodynamic diameter is significantly larger than the cutoff for renal filtration (~5 nm).48 The liver uptake of 64Cu-NOTA-GO-TRC105 was 18.6 ± 1.3, 14.1 ± 2.1, 12.4 ± 1.9, 13.2 ± 1.2, and 13.7 ± 1.3 %ID/g at 0.5, 3, 16, 24, and 48 h p.i respectively, while the radioactivity in the blood was 9.7 ± 1.3, 6.6 ± 0.5, 4.4 ± 0.5, 4.3 ± 0.2, and 3.9 ± 0.1 %ID/g at 0.5, 3, 16, 24, and 48 h p.i., respectively (n = 4; Figure 4a). The slight increase of liver uptake at late time points (24 h and 48 h p.i.) may be due to the degradation of 64Cu-NOTA-GO-TRC105 in the tumor over time, which was eventually cleared through the hepatobiliary pathway. Importantly, tumor uptake of 64Cu-NOTA-GO-TRC105 accumulated very quickly and was clearly visible at 0.5 h p.i. and remained stable over time (5.8 ± 0.6, 5.3 ± 0.6, 4.5 ± 0.6, 4.0 ± 0.4, and 3.4 ± 0.1 %ID/g at 0.5, 3, 16, 24, and 48 h p.i. respectively; n = 4; Figure 4a&d). Due to the fast growing nature of the 4T1 tumor model used in this study, although the total tumor uptake of 64Cu-NOTA-GO-TRC105 is quite steady over a period of 48 h, the %ID/g values did drop appreciably since the tumor volume at 48 h was significantly larger (135 ± 7 %; n = 4) than the initial tumor volume before 64Cu-NOTA-GO-TRC105 injection.
Administering a blocking dose of TRC105 at 2 h before 64Cu-NOTA-GO-TRC105 injection significantly reduced the tumor uptake to 2.0 ± 0.5, 2.1 ± 0.3, 2.6 ± 0.4, 2.7 ± 0.3, and 2.8 ± 0.2 %ID/g at 0.5, 3, 16, 24, and 48 h p.i., respectively (n = 4; P < 0.05 before 48 h p.i.; Figure 3a, 4b&d), which demonstrated CD105 specificity of 64Cu-NOTA-GO-TRC105 in vivo. Liver uptake of 64Cu-NOTA-GO-TRC105 in the “blocking” group was similar to mice injected with 64Cu-NOTA-GO-TRC105 alone, at 15.3 ± 2.0, 14.6 ± 2.1, 12.5 ± 1.7, 11.9 ± 1.3, and 11.4 ± 1.3 %ID/g at 0.5, 3, 16, 24, and 48 h p.i. respectively (n = 4). Radioactivity in the blood (10.2 ± 1.3, 6.9 ± 0.9, 5.3 ± 0.5, 4.8 ± 0.2, and 2.9 ± 0.1 %ID/g at 0.5, 3, 16, 24, and 48 h p.i. respectively; n = 4) was not significantly affected by the blocking dose of TRC105 either (Figure 4b).
When compared with 64Cu-NOTA-GO-TRC105, liver uptake of 64Cu-NOTA-GO was similar, at 19.3 ± 1.9, 15.5 ± 2.3, 13.9 ± 1.3, 12.1 ± 1.4, and 10.8 ± 1.2 %ID/g at 0.5, 3, 16, 24, and 48 h p.i., respectively (n = 4; Figure 4c). The radioactivity of 64Cu-NOTA-GO in the blood was also comparable to 64Cu-NOTA-GO-TRC105: 12.1 ± 2.1, 8.8 ± 0.9, 6.5 ± 0.8, 4.2 ± 0.5, and 3.2 ± 0.3 %ID/g at 0.5, 3, 16, 24, and 48 h p.i. respectively (n = 4; Figure 4c). However, the 4T1 tumor uptake of 64Cu-NOTA-GO (2.0 ± 0.3, 2.1 ± 0.4, 1.9 ± 0.4, 2.2 ± 0.4, and 2.4 ± 0.3 %ID/g at 0.5, 3, 16, 24, and 48 h p.i. respectively; n = 4; Figure 4c&d) was significantly lower than that of 64Cu-NOTA-GO-TRC105 (P < 0.05) at all time points examined, which confirmed that conjugation of TRC105 was the crucial factor for enhanced tumor uptake of the GO conjugates.
Figure 4d summarizes the 4T1 tumor uptake of the GO conjugates in all three groups over time. The differences between the uptake of 64Cu-NOTA-GO-TRC105 and the two control groups (i.e. 64Cu-NOTA-GO and the “blocking” group) were statistically significant (P < 0.05; n = 4) at all time points examined, except the case between 64Cu-NOTA-GO-TRC105 and the “blocking” group at 48 h p.i. which did not reach statistical significance. Besides the apparent increase in 4T1 tumor volume over a period of 48 h, the appreciable decline of 64Cu-NOTA-GO-TRC105 uptake in the 4T1 tumor over time may also have been attributed to metabolism and degradation of the conjugate. Since TRC105 is an internalizing mAb, 64Cu-NOTA-GO-TRC105 likely underwent CD105-mediated endocytosis which eventually led to degradation and clearance of the conjugate from the 4T1 tumor, causing a slight increase in liver uptake at late time points. The slight increase in tumor uptake over time of the two control groups (i.e. 64Cu-NOTA-GO and the “blocking” group) may have been due to the enhanced permeability and retention effect, since there was still substantial amount of GO conjugates in the circulation at late time points (~ 5 %ID/g at 24 and 48 h p.i.). Furthermore, there was no significant level of CD105-mediated internalization/degradation of the GO conjugates to cause a decrease in tumor uptake. Overall, aside from the difference in tumor uptake of the GO conjugates, administration of a blocking dose of TRC105 did not significantly alter the in vivo kinetics of 64Cu-NOTA-GO-TRC105 in 4T1 tumor-bearing mice.
Figure 5 shows the biodistribution data of the GO conjugates at 3 h and 48 h p.i. Overall, the quantitative results based on PET and biodistribution studies matched very well. Besides the liver, the spleen and blood also had significant uptake of 64Cu-NOTA-GO-TRC105 and 64Cu-NOTA-GO at 3 h p.i. (Figure 5a). The uptake of 64Cu-NOTA-GO-TRC105 in the 4T1 tumor was higher than all other major organs, thus providing good tumor contrast. The biodistribution of 64Cu-NOTA-GO-TRC105 and 64Cu-NOTA-GO was similar in all tissues except the 4T1 tumor, for which the difference in uptake of 64Cu-NOTA-GO-TRC105 and 64Cu-NOTA-GO reached statistical significance and confirmed CD105 specificity of 64Cu-NOTA-GO-TRC105.
Figure 5.

Biodistribution studies in 4T1 tumor-bearing mice. (a) Biodistribution of 64Cu-NOTA-GO-TRC105 and 64Cu-NOTA-GO in 4T1 tumor-bearing mice at 3 h post-injection. *: p < 0.05. (b) Biodistribution of 64Cu-NOTA-GO-TRC105 and 64Cu-NOTA-GO in 4T1 tumor-bearing mice at 48 h post-injection. (c) Biodistribution of 64Cu-NOTA-GO-TRC105 and 64Cu-NOTA-GO-TRC105 after a blocking dose of TRC105 (denoted as “blocking”) in 4T1 tumor-bearing mice at 48 h post-injection. All data represent 4 mice per group.
For mice euthanized at 48 h p.i. after the last PET scans (Figure 5b&c), tumor uptake of 64Cu-NOTA-GO-TRC105 was lower than that of 3 h p.i. yet still remained prominent, higher than all organs except the liver, spleen, and kidneys (i.e. organs responsible for nanomaterial clearance). Excellent tumor contrast was achieved for 64Cu-NOTA-GO-TRC105, with a tumor/muscle ratio of 18.3 ± 5.0 at 3 h p.i. and 17.2 ± 4.2 at 48 h p.i. (n = 4). Administration of a blocking dose of TRC105 led to a decrease in 4T1 tumor uptake, confirming the PET findings. Taken together, the PET and biodistribution data confirmed CD105 specificity of 64Cu-NOTA-GO-TRC105 in vivo, through the investigation and comparison with the two control groups. In addition, the corroborating results also validated that serial non-invasive PET imaging truly reflected the distribution of 64Cu-NOTA-GO-TRC105 and 64Cu-NOTA-GO in tumor-bearing mice.
Tumor targeting of NOTA-GO-TRC105 is vascular specific
To further confirm that tumor uptake of 64Cu-NOTA-GO-TRC105 is CD105 specific and GO was indeed delivered to the tumor by TRC105, three 4T1 tumor-bearing mice were each injected with a larger dose of NOTA-GO-TRC105 (5 mg/kg mouse body weight) and euthanized at 3 h p.i. (when 4T1 tumor uptake of 64Cu-NOTA-GO-TRC105 was at the peak based on PET results). The 4T1 tumor, liver, spleen (i.e. tissues with significant uptake of 64Cu-NOTA-GO-TRC105), and muscle (which has negligible uptake of 64Cu-NOTA-GO-TRC105 and serves as a control normal organ) were frozen and cryo-sectioned for histological analysis. Photographs of the tissue slices (i.e. the “light view” mode) showed that there were significant amount of NOTA-GO-TRC105 in the tumor, liver, and spleen, but not in the muscle (dark spots in Figure 6a). However, there is no observable GO in the tumor of mice injected with NOTA-GO. Therefore, both 64Cu (detected by PET) and GO (visible under the microscope) were delivered to the 4T1 tumor by TRC105-based CD105 targeting, which suggested good in vivo stability of 64Cu-NOTA-GO-TRC105, corroborating serum stability results.
Figure 6.
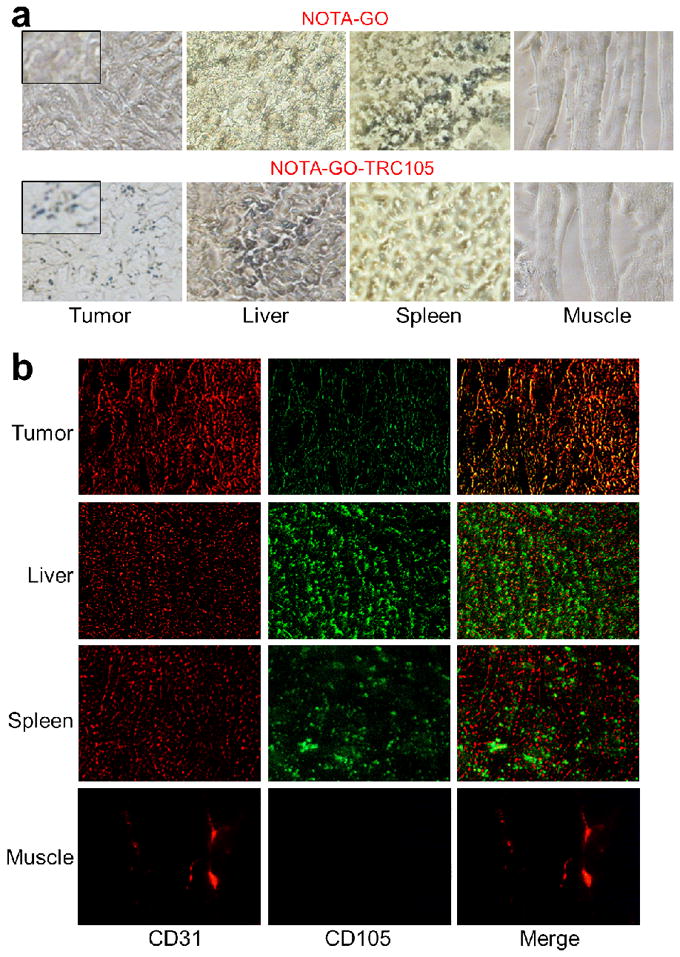
Ex vivo histological analysis. (a) Photographs of tissue slices harvested from mice injected with NOTA-GO or NOTA-GO-TRC105. The dark spots indicate the presence of GO. Inset: higher magnification photographs of the tumor tissue. (b) Immunofluorescence staining of the tissue slices with CD31 (red, with anti-mouse CD31 primary antibody) and CD105 (green, using the TRC105 within NOTA-GO-TRC105 as the primary antibody). Merged images are also shown. Magnification: 200×.
Since TRC105 within the NOTA-GO-TRC105 conjugate served as the primary antibody for histological analysis of CD105 (no unconjugated TRC105 was used), the fluorescence signal of CD105 in Figure 6b is attributed to the presence of NOTA-GO-TRC105 conjugate in the examined tissues. The histology data demonstrated that NOTA-GO-TRC105 can specifically target CD105 in the tumor vasculature. As can be seen in Figure 6b, NOTA-GO-TRC105 distribution in the 4T1 tumor was primarily on the tumor vasculature (indicated by good overlay of the red and green fluorescence signal, which represents CD31 and CD105 respectively) with little extravasation (green spots). Taken together, the results from light view and immunofluorescence images indicated that NOTA-GO-TRC105 was quite stable in vivo and was specifically directed to the tumor vasculature as an intact entity through targeting of CD105 on the tumor neovasculature. The fact that there is little extravasation of NOTA-GO-TRC105 in the 4T1 tumor suggested that the 4T1 tumor vasculature is not very “leaky”.
Ample dark spots in the light view images (indicating the presence of GO), as well as fluorescence signal resulting from TRC105 within NOTA-GO-TRC105, were observed in the liver and spleen slices which indicated significant uptake of NOTA-GO-TRC105 by these two organs (as both are part of the reticuloendothelial system). However, the green fluorescence attributed to NOTA-GO-TRC105 exhibited little overlay with the CD31 staining of vessels in the liver and spleen, indicating that the uptake of NOTA-GO-TRC105 in these two organs were mainly due to the capture by macrophages in the reticuloendothelial system rather than specific targeting of CD105 on the vasculature. Meanwhile, little signal originated from NOTA-GO-TRC105 was observed in normal tissues such as the muscle, which is consistent with our in vivo imaging results.
CONCLUSIONS
In this study, we have demonstrated that GO can be specifically directed to the tumor neovasculature in vivo through targeting of CD105, a vascular marker for tumor angiogenesis. The covalently functionalized GO exhibited excellent stability and target specificity. Pharmacokinetics and tumor targeting efficacy of NOTA-GO-TRC105 was investigated with both serial non-invasive PET imaging and biodistribution studies, which were validated with in vitro, in vivo, and ex vivo experiments. We found that tumor targeting of NOTA-GO-TRC105 was vasculature specific with little extravasation.
Achieving active tumor targeting and imaging in vivo is highly important to the emerging field of graphene-based nanomedicine. The significantly improved tumor targeting efficiency of nano-graphene realized in this work may be utilized for cancer-targeted drug delivery and/or photothermal therapy in vivo, to further enhance the therapeutic efficacy and to enable cancer theranostics. The versatile chemistry of graphene-based nanomaterials makes them a desirable nanoplatform for future biomedical research. Since poor extravasation is a major hurdle for nanomaterial-based targeting in vivo, this study also establishes CD105 as a promising vascular target for future cancer nanomedicine.
METHODS
Syntheses of the GO Conjugates
GO-PEG-NH2 was mixed with S-2-(4-isothiocyanatobenzyl)-1,4,7-triazacyclononane-1,4,7-triacetic acid (p-SCN-Bn-NOTA) or FITC, which has the same chemical reaction between the SCN group and the NH2 group on GO, at a molar ratio of 1:10 at pH 9.0 for 2 h. The resulting NOTA-GO (or FITC-GO) was purified by centrifugation filtration using 100 kDa cutoff Amicon filters (15 minutes at 12,520 g). NOTA-GO (or FITC-GO) was subsequently reacted with succinimidyl carboxymethyl PEG maleimide (SCM-PEG-Mal) at pH 8.5 at a molar ratio of 1:30 for 2 h. After removing the unreacted SCM-PEG-Mal and other reagents by centrifugation filtration, the resulting reaction intermediates were named as NOTA-GO-Mal or FITC-GO-Mal.
Meanwhile, TRC105 was mixed with Traut’s reagent at a molar ratio of 1:25 at pH 8.0. After 2 h of incubation at room temperature (RT), the resulting TRC105-SH was purified by size exclusive chromatography using phosphate-buffered saline (PBS, pre-treated with Chelex 100 resin to prevent oxidation of the thiol) as the mobile phase. With this reaction ratio, we calculated that there are about 8 thiol groups per TRC105 molecule based on Ellman’s reagent titration (see Supporting Information Figure S2). Subsequently, NOTA-GO-Mal or FITC-GO-Mal was mixed with TRC105-SH at a molar ratio of 1:5 at pH 7.5 in the presence of tris(2-carboxyethyl)phosphine (i.e. TCEP) to avoid disulfide formation between TRC105-SH. The final products were purified by centrifugation filtration as described above and termed NOTA-GO-TRC105 and FITC-GO-TRC105.
Flow cytometry and fluorescence microscopy
Cells were harvested and suspended in cold PBS with 2% bovine serum albumin at a concentration of 5 × 10⁶ cells/ml, incubated with FITC-GO-TRC105 or FITC-GO (at a concentration of 50 μg/ml based on GO) for 30 min at RT, washed three times with cold PBS, and centrifuged at 1,000 rpm (682 g) for 5 min. Afterwards, the cells were washed and analyzed using a BD FACSCalibur four-color analysis cytometer, which is equipped with 488-nm and 633-nm lasers (Becton-Dickinson, San Jose, CA) and FlowJo analysis software (Tree Star, Ashland, OR). “Blocking” experiment was also performed in cells incubated with 50 μg/ml of FITC-GO-TRC105, where 500 μg/ml of unconjugated TRC105 was added to evaluate the CD105 specificity of FITC-GO-TRC105. The cells were also examined under a Nikon Eclipse Ti microscope to validate the FACS results.
64Cu-labeling and serum stability studies
64CuCl2 (74 MBq) was diluted in 300 μL of 0.1 M sodium acetate buffer (pH 6.5) and added to 60 μg of NOTA-GO-TRC105 or NOTA-GO, and the reaction was allowed to proceed at 37 °C for 30 min with constant stirring. 64Cu-NOTA-GO-TRC105 and 64Cu-NOTA-GO were purified using PD-10 columns with PBS as the mobile phase. The whole procedure of 64Cu-labeling and purification of the GO conjugates took 90 ± 10 min (n = 10). 64Cu-NOTA-GO-TRC105 or 64Cu-NOTA-GO were incubated in complete mouse serum at 37 °C for up to 48 h (the time period investigated for serial PET imaging, which is about four half-lives of 64Cu). Portions of the mixture were sampled at different time points and filtered through 100 kDa cutoff filters as described above. The filtrates were collected and the radioactivity was measured. The percentages of retained (i.e. intact) 64Cu on the GO conjugates (64Cu-NOTA-GO-TRC105 or 64Cu-NOTA-GO) were calculated using the equation (total radioactivity - radioactivity in filtrate)/total radioactivity.
PET imaging and biodistribution studies
All animal studies were conducted under a protocol approved by the University of Wisconsin Institutional Animal Care and Use Committee. PET and PET/CT scans at various time points p.i. using a microPET/microCT Inveon rodent model scanner (Siemens Medical Solutions USA, Inc.), image reconstruction, and ROI analysis of the PET data were performed similar as described previously (see Supporting Information for details).49, 50 Quantitative PET data were presented as percentage injected dose per gram of tissue (%ID/g).
4T1 murine breast tumor-bearing mice, a fast-growing tumor model with high CD105 expression on the tumor vasculature,41, 42, 50 were each injected with 5–10 MBq of 64Cu-NOTA-GO-TRC105 or 64Cu-NOTA-GO via tail vein before serial PET scans. Another group of four 4T1 tumor-bearing mice were each injected with 2 mg of unlabeled TRC105 at 2 h before 64Cu-NOTA-GO-TRC105 administration to evaluate the CD105 specificity of 64Cu-NOTA-GO-TRC105 in vivo (i.e. blocking experiment). To generate the 4T1 tumor model, 4- to 5-week-old female Balb/c mice were purchased from Harlan (Indianapolis, IN, USA) and tumors were established by subcutaneously injecting 2×10⁶ cells, suspended in 100 μl of 1:1 mixture of RPMI 1640 and Matrigel (BD Biosciences, Franklin Lakes, NJ, USA), into the front flank of mice. The tumor sizes were monitored every other day and the animals were subjected to in vivo experiments when the tumor diameter reached 5–8 mm.
After the last PET scans at 48 h p.i., biodistribution studies were carried out to confirm that the %ID/g values based on PET imaging truly represented the radioactivity distribution in tumor-bearing mice. In addition, separate groups of four 4T1 tumor-bearing mice were each intravenously injected with 64Cu-NOTA-GO-TRC105 or 64Cu-NOTA-GO and euthanized at 3 h p.i. (when tumor uptake was at the peak based on PET results) for biodistribution studies. Mice were euthanized and blood, 4T1 tumor, and major organs/tissues were collected and wet-weighed. The radioactivity in the tissue was measured using a gamma-counter (Perkin Elmer) and presented as %ID/g (mean ± SD).
Histology
All images were acquired with a Nikon Eclipse Ti microscope. Frozen tissue slices of 7 μm thickness were first visually inspected under the microscope for the presence of GO, without any immunofluorescence staining. Subsequently, the tissue slices were fixed with cold acetone and stained for endothelial marker CD31, as described previously through the use of a rat anti-mouse CD31 antibody and a Cy3-labeled donkey anti-rat IgG.51, 52 The tissue slices were also incubated with 2 μg/ml of AlexaFluor488-labeled goat anti-human IgG for visualization of NOTA-GO-TRC105 (no unconjugated TRC105 was used for histology).
Acknowledgments
This work is supported, in part, by the University of Wisconsin Carbone Cancer Center, the Department of Defense (W81XWH-11-1-0644 and W81XWH-11-1-0648), NCRR 1UL1RR025011, the National Basic Research Program (973 Program) of China (2012CB932600, 2011CB911002), the National Natural Science Foundation of China (51132006, 51002100), and the NIH through the UW Radiological Sciences Training Program 5 T32 CA009206-32.
Footnotes
Supporting Information Available: This material is available free of charge via the Internet at http://pubs.acs.org.
References
- 1.Novoselov KS, Geim AK, Morozov SV, Jiang D, Zhang Y, Dubonos SV, Grigorieva IV, Firsov AA. Electric Field Effect in Atomically Thin Carbon Films. Science. 2004;306:666–669. doi: 10.1126/science.1102896. [DOI] [PubMed] [Google Scholar]
- 2.Feng L, Liu Z. Graphene in Biomedicine: Opportunities and Challenges. Nanomedicine (Lond) 2011;6:317–324. doi: 10.2217/nnm.10.158. [DOI] [PubMed] [Google Scholar]
- 3.Pumera M. Graphene-Based Nanomaterials and Their Electrochemistry. Chem Soc Rev. 2010;39:4146–4157. doi: 10.1039/c002690p. [DOI] [PubMed] [Google Scholar]
- 4.Zhu Y, Murali S, Cai W, Li X, Suk JW, Potts JR, Ruoff RS. Graphene and Graphene Oxide: Synthesis, Properties, and Applications. Adv Mater. 2010;22:3906–3924. doi: 10.1002/adma.201001068. [DOI] [PubMed] [Google Scholar]
- 5.Li X, Wang X, Zhang L, Lee S, Dai H. Chemically Derived, Ultrasmooth Graphene Nanoribbon Semiconductors. Science. 2008;319:1229–1232. doi: 10.1126/science.1150878. [DOI] [PubMed] [Google Scholar]
- 6.Loh KP, Bao Q, Eda G, Chhowalla M. Graphene Oxide as a Chemically Tunable Platform for Optical Applications. Nat Chem. 2010;2:1015–1024. doi: 10.1038/nchem.907. [DOI] [PubMed] [Google Scholar]
- 7.Qi X, Pu KY, Li H, Zhou X, Wu S, Fan QL, Liu B, Boey F, Huang W, Zhang H. Amphiphilic Graphene Composites. Angew Chem Int Ed Engl. 2010;49:9426–9429. doi: 10.1002/anie.201004497. [DOI] [PubMed] [Google Scholar]
- 8.Ang PK, Chen W, Wee AT, Loh KP. Solution-Gated Epitaxial Graphene as pH Sensor. J Am Chem Soc. 2008;130:14392–14393. doi: 10.1021/ja805090z. [DOI] [PubMed] [Google Scholar]
- 9.Dua V, Surwade SP, Ammu S, Agnihotra SR, Jain S, Roberts KE, Park S, Ruoff RS, Manohar SK. All-Organic Vapor Sensor Using Inkjet-Printed Reduced Graphene Oxide. Angew Chem Int Ed Engl. 2010;49:2154–2157. doi: 10.1002/anie.200905089. [DOI] [PubMed] [Google Scholar]
- 10.Li W, Geng X, Guo Y, Rong J, Gong Y, Wu L, Zhang X, Li P, Xu J, Cheng G, et al. Reduced Graphene Oxide Electrically Contacted Graphene Sensor for Highly Sensitive Nitric Oxide Detection. ACS Nano. 2011;5:6955–6961. doi: 10.1021/nn201433r. [DOI] [PubMed] [Google Scholar]
- 11.Wang H, Zhang Q, Chu X, Chen T, Ge J, Yu R. Graphene Oxide-Peptide Conjugate as an Intracellular Protease Sensor for Caspase-3 Activation Imaging in Live Cells. Angew Chem Int Ed Engl. 2011;50:7065–7069. doi: 10.1002/anie.201101351. [DOI] [PubMed] [Google Scholar]
- 12.Xia JL, Chen F, Wiktor P, Ferry DK, Tao NJ. Effect of Top Dielectric Medium on Gate Capacitance of Graphene Field Effect Transistors: Implications in Mobility Measurements and Sensor Applications. Nano Lett. 2010;10:5060–5064. doi: 10.1021/nl103306a. [DOI] [PubMed] [Google Scholar]
- 13.He S, Song B, Li D, Zhu C, Qi W, Wen Y, Wang L, Song S, Fang H, Fan C. A Graphene Nanoprobe for Rapid, Sensitive, and Multicolor Fluorescent DNA Analysis. Adv Funct Mater. 2010;20:453–459. [Google Scholar]
- 14.Bao H, Pan Y, Ping Y, Sahoo NG, Wu T, Li L, Li J, Gan LH. Chitosan-Functionalized Graphene Oxide as a Nanocarrier for Drug and Gene Delivery. Small. 2011;7:1569–1578. doi: 10.1002/smll.201100191. [DOI] [PubMed] [Google Scholar]
- 15.Sun X, Liu Z, Welsher K, Robinson JT, Goodwin A, Zaric S, Dai H. Nano-Graphene Oxide for Cellular Imaging and Drug Delivery. Nano Res. 2008;1:203–212. doi: 10.1007/s12274-008-8021-8. [DOI] [PMC free article] [PubMed] [Google Scholar]
- 16.Liu Z, Robinson JT, Sun X, Dai H. PEGylated Nanographene Oxide for Delivery of Water-Insoluble Cancer Drugs. J Am Chem Soc. 2008;130:10876–10877. doi: 10.1021/ja803688x. [DOI] [PMC free article] [PubMed] [Google Scholar]
- 17.Tian B, Wang C, Zhang S, Feng L, Liu Z. Photothermally Enhanced Photodynamic Therapy Delivered by Nano-Graphene Oxide. ACS Nano. 2011;5:7000–7009. doi: 10.1021/nn201560b. [DOI] [PubMed] [Google Scholar]
- 18.Feng L, Zhang S, Liu Z. Graphene Based Gene Transfection. Nanoscale. 2011;3:1252–1257. doi: 10.1039/c0nr00680g. [DOI] [PubMed] [Google Scholar]
- 19.Zhang L, Lu Z, Zhao Q, Huang J, Shen H, Zhang Z. Enhanced Chemotherapy Efficacy by Sequential Delivery of SiRNA and Anticancer Drugs Using PEI-Grafted Graphene Oxide. Small. 2011;7:460–464. doi: 10.1002/smll.201001522. [DOI] [PubMed] [Google Scholar]
- 20.Yang K, Zhang S, Zhang G, Sun X, Lee ST, Liu Z. Graphene in Mice: Ultrahigh In Vivo Tumor Uptake and Efficient Photothermal Therapy. Nano Lett. 2010;10:3318–3323. doi: 10.1021/nl100996u. [DOI] [PubMed] [Google Scholar]
- 21.Zhang W, Guo Z, Huang D, Liu Z, Guo X, Zhong H. Synergistic Effect of Chemo-Photothermal Therapy Using PEGylated Graphene Oxide. Biomaterials. 2011;32:8555–8561. doi: 10.1016/j.biomaterials.2011.07.071. [DOI] [PubMed] [Google Scholar]
- 22.Uo M, Akasaka T, Watari F, Sato Y, Tohji K. Toxicity Evaluations of Various Carbon Nanomaterials. Dent Mater J. 2011;30:245–263. doi: 10.4012/dmj.2010-039. [DOI] [PubMed] [Google Scholar]
- 23.Yang K, Wan J, Zhang S, Zhang Y, Lee ST, Liu Z. In Vivo Pharmacokinetics, Long-Term Biodistribution, and Toxicology of PEGylated Graphene in Mice. ACS Nano. 2011;5:516–522. doi: 10.1021/nn1024303. [DOI] [PubMed] [Google Scholar]
- 24.Duch MC, Budinger GR, Liang YT, Soberanes S, Urich D, Chiarella SE, Campochiaro LA, Gonzalez A, Chandel NS, Hersam MC, et al. Minimizing Oxidation and Stable Nanoscale Dispersion Improves the Biocompatibility of Graphene in the Lung. Nano Lett. 2011;11:5201–5207. doi: 10.1021/nl202515a. [DOI] [PMC free article] [PubMed] [Google Scholar]
- 25.Ruiz ON, Fernando KA, Wang B, Brown NA, Luo PG, McNamara ND, Vangsness M, Sun YP, Bunker CE. Graphene Oxide: a Nonspecific Enhancer of Cellular Growth. ACS Nano. 2011;5:8100–8107. doi: 10.1021/nn202699t. [DOI] [PubMed] [Google Scholar]
- 26.Li Y, Liu Y, Fu Y, Wei T, Le Guyader L, Gao G, Liu RS, Chang YZ, Chen C. The Triggering of Apoptosis in Macrophages by Pristine Graphene Through the MAPK and TGF-Beta Signaling Pathways. Biomaterials. 2012;33:402–411. doi: 10.1016/j.biomaterials.2011.09.091. [DOI] [PubMed] [Google Scholar]
- 27.Zhang X, Yin J, Peng C, Hu W, Zhu Z, Li W, Fan C, Huang Q. Distribution and Biocompatibility Studies of Graphene Oxide in Mice after Intravenous Administration. Carbon. 2011;49:986–995. [Google Scholar]
- 28.Seon BK, Haba A, Matsuno F, Takahashi N, Tsujie M, She X, Harada N, Uneda S, Tsujie T, Toi H, et al. Endoglin-Targeted Cancer Therapy. Curr Drug Deliv. 2011;8:135–143. doi: 10.2174/156720111793663570. [DOI] [PMC free article] [PubMed] [Google Scholar]
- 29.Zhang Y, Yang Y, Hong H, Cai W. Multimodality Molecular Imaging of CD105 (Endoglin) Expression. Int J Clin Exp Med. 2011;4:32–42. [PMC free article] [PubMed] [Google Scholar]
- 30.Fonsatti E, Nicolay HJ, Altomonte M, Covre A, Maio M. Targeting Cancer Vasculature via Endoglin/CD105: a Novel Antibody-Based Diagnostic and Therapeutic Strategy in Solid Tumours. Cardiovasc Res. 2010;86:12–19. doi: 10.1093/cvr/cvp332. [DOI] [PubMed] [Google Scholar]
- 31.Dallas NA, Samuel S, Xia L, Fan F, Gray MJ, Lim SJ, Ellis LM. Endoglin (CD105): a Marker of Tumor Vasculature and Potential Target for Therapy. Clin Cancer Res. 2008;14:1931–1937. doi: 10.1158/1078-0432.CCR-07-4478. [DOI] [PubMed] [Google Scholar]
- 32.Hong H, Zhang Y, Sun J, Cai W. Molecular Imaging and Therapy of Cancer with Radiolabeled Nanoparticles. Nano Today. 2009;4:399–413. doi: 10.1016/j.nantod.2009.07.001. [DOI] [PMC free article] [PubMed] [Google Scholar]
- 33.Ruoslahti E, Bhatia SN, Sailor MJ. Targeting of Drugs and Nanoparticles to Tumors. J Cell Biol. 2010;188:759–768. doi: 10.1083/jcb.200910104. [DOI] [PMC free article] [PubMed] [Google Scholar]
- 34.Mendelson DS, Gordon MS, Rosen LS, Hurwitz H, Wong MK, Adams BJ, Alvarez D, Seon BK, Theuer CP, Leigh BR. Phase I Study of TRC105 (Anti-CD105 [Endoglin] Antibody) Therapy in Patients with Advanced Refractory Cancer. J Clin Oncol. 2010;28:15s. [Google Scholar]
- 35.Dearling JLJ, Voss SD, Dunning P, Snay E, Fahey F, Smith SV, Huston JS, Meares CF, Treves ST, Packard AB. Imaging Cancer using PET -- the Effect of the Bifunctional Chelator on the Biodistribution of a 64Cu-Labeled Antibody. Nucl Med Biol. 2011;38:29–38. doi: 10.1016/j.nucmedbio.2010.07.003. [DOI] [PMC free article] [PubMed] [Google Scholar]
- 36.Zhang Y, Hong H, Engle JW, Bean J, Yang Y, Leigh BR, Barnhart TE, Cai W. Positron Emission Tomography Imaging of CD105 Expression with a 64Cu-Labeled Monoclonal Antibody: NOTA Is Superior to DOTA. PLoS One. 2011;6:e28005. doi: 10.1371/journal.pone.0028005. [DOI] [PMC free article] [PubMed] [Google Scholar]
- 37.Gambhir SS. Molecular Imaging of Cancer with Positron Emission Tomography. Nat Rev Cancer. 2002;2:683–693. doi: 10.1038/nrc882. [DOI] [PubMed] [Google Scholar]
- 38.Alauddin MM. Positron Emission Tomography (PET) Imaging with 18F-Based Radiotracers. Am J Nucl Med Mol Imaging. 2012;2:55–76. [PMC free article] [PubMed] [Google Scholar]
- 39.Grassi I, Nanni C, Allegri V, Morigi JJ, Montini GC, Castellucci P, Fanti S. The Clinical Use of PET with 11C-Acetate. Am J Nucl Med Mol Imaging. 2012;2:33–47. [PMC free article] [PubMed] [Google Scholar]
- 40.Zhang Y, Hong H, Engle JW, Yang Y, Barnhart TE, Cai W. Positron Emission Tomography and Near-Infrared Fluorescence Imaging of Vascular Endothelial Growth Factor with Dual-Labeled Bevacizumab. Am J Nucl Med Mol Imaging. 2012;2:1–13. [PMC free article] [PubMed] [Google Scholar]
- 41.Hong H, Yang Y, Zhang Y, Engle JW, Barnhart TE, Nickles RJ, Leigh BR, Cai W. Positron Emission Tomography Imaging of CD105 Expression during Tumor Angiogenesis. Eur J Nucl Med Mol Imaging. 2011;38:1335–1343. doi: 10.1007/s00259-011-1765-5. [DOI] [PMC free article] [PubMed] [Google Scholar]
- 42.Yang Y, Zhang Y, Hong H, Liu G, Leigh BR, Cai W. In Vivo Near-Infrared Fluorescence Imaging of CD105 Expression. Eur J Nucl Med Mol Imaging. 2011;38:2066–2076. doi: 10.1007/s00259-011-1886-x. [DOI] [PMC free article] [PubMed] [Google Scholar]
- 43.Cai W, Chen K, Li ZB, Gambhir SS, Chen X. Dual-Function Probe for PET and Near-Infrared Fluorescence Imaging of Tumor Vasculature. J Nucl Med. 2007;48:1862–1870. doi: 10.2967/jnumed.107.043216. [DOI] [PubMed] [Google Scholar]
- 44.Chen K, Li ZB, Wang H, Cai W, Chen X. Dual-Modality Optical and Positron Emission Tomography Imaging of Vascular Endothelial Growth Factor Receptor on Tumor Vasculature using Quantum Dots. Eur J Nucl Med Mol Imaging. 2008;35:2235–2244. doi: 10.1007/s00259-008-0860-8. [DOI] [PubMed] [Google Scholar]
- 45.Liu Z, Cai W, He L, Nakayama N, Chen K, Sun X, Chen X, Dai H. In Vivo Biodistribution and Highly Efficient Tumour Targeting of Carbon Nanotubes in Mice. Nat Nanotechnol. 2007;2:47–52. doi: 10.1038/nnano.2006.170. [DOI] [PubMed] [Google Scholar]
- 46.Hong H, Shi J, Yang Y, Zhang Y, Engle JW, Nickles RJ, Wang X, Cai W. Cancer-Targeted Optical Imaging with Fluorescent Zinc Oxide Nanowires. Nano Lett. 2011;11:3744–3750. doi: 10.1021/nl201782m. [DOI] [PMC free article] [PubMed] [Google Scholar]
- 47.Yang X, Hong H, Grailer JJ, Rowland IJ, Javadi A, Hurley SA, Xiao Y, Yang Y, Zhang Y, Nickles RJ, et al. cRGD-Functionalized, DOX-Conjugated, and 64Cu-Labeled Superparamagnetic Iron Oxide Nanoparticles for Targeted Anticancer Drug Delivery and PET/MR Imaging. Biomaterials. 2011;32:4151–4160. doi: 10.1016/j.biomaterials.2011.02.006. [DOI] [PMC free article] [PubMed] [Google Scholar]
- 48.Choi HS, Liu W, Misra P, Tanaka E, Zimmer JP, Itty Ipe B, Bawendi MG, Frangioni JV. Renal Clearance of Quantum Dots. Nat Biotechnol. 2007;25:1165–1170. doi: 10.1038/nbt1340. [DOI] [PMC free article] [PubMed] [Google Scholar]
- 49.Hong H, Benink HA, Zhang Y, Yang Y, Uyeda HT, Engle JW, Severin GW, McDougall MG, Barnhart TE, Klaubert DH, et al. HaloTag: a Novel Reporter Gene for Positron Emission Tomography. Am J Transl Res. 2011;3:392–403. [PMC free article] [PubMed] [Google Scholar]
- 50.Hong H, Severin GW, Yang Y, Engle JW, Zhang Y, Barnhart TE, Liu G, Leigh BR, Nickles RJ, Cai W. Positron Emission Tomography Imaging of CD105 Expression with 89Zr-Df-TRC105. Eur J Nucl Med Mol Imaging. 2012;39:138–148. doi: 10.1007/s00259-011-1930-x. [DOI] [PMC free article] [PubMed] [Google Scholar]
- 51.Cai W, Wu Y, Chen K, Cao Q, Tice DA, Chen X. In Vitro and In Vivo Characterization of 64Cu-Labeled AbegrinTM, a Humanized Monoclonal Antibody against Integrin αvβ3. Cancer Res. 2006;66:9673–9681. doi: 10.1158/0008-5472.CAN-06-1480. [DOI] [PubMed] [Google Scholar]
- 52.Cai W, Chen K, Mohamedali KA, Cao Q, Gambhir SS, Rosenblum MG, Chen X. PET of Vascular Endothelial Growth Factor Receptor Expression. J Nucl Med. 2006;47:2048–2056. [PubMed] [Google Scholar]