

Abstract
Current treatment for type 1 diabetes mellitus requires daily insulin injections that fail to produce physiological glycemic control. Islet cell transplantation has been proposed as a permanent cure but is limited by loss of β-cell viability and function. These limitations could potentially be overcome by relying on the activity of glucagon-like peptide 1 (GLP-1), which acts on β-cells to promote insulin release, proliferation, and survival. We have developed a peptide amphiphile (PA) molecule incorporating a peptide mimetic for GLP-1. This GLP-1-mimetic PA self-assembles into one-dimensional nanofibers that stabilize the active secondary structure of GLP-1 and can be cross-linked by calcium ions to form a macroscopic gel capable of cell encapsulation and 3-dimensional culture. The GLP-1-mimetic PA nanofibers were found to stimulate insulin secretion from rat insulinoma (RINm5f) cells to a significantly greater extent than the mimetic peptide alone and to a level equivalent to that of the clinically used agonist exendin-4. The activity of the GLP-1-mimetic PA is glucose-dependent, lipid-raft dependent, and partially PKA-dependent consistent with native GLP-1. The GLP-1-mimetic PA also completely abrogates inflammatory cytokine-induced cell death to the level of untreated controls. When used as a PA gel to encapsulate RINm5f cells, the GLP-1-mimetic PA stimulates insulin secretion and proliferation in a cytokine-resistant manner that is significantly greater than a non-bioactive PA gel containing exendin-4. Due to its self-assembling property and bioactivity, the GLP-1-mimetic PA can be incorporated into previously developed islet cell transplantation protocols with the potential for significant enhancement of β-cell viability and function.
Keywords: Self Assembly, Biomimetic Material, Cell Activation, Cell Signaling, Pancreas, Diabetes
1. Introduction
Type 1 diabetes mellitus (T1DM) is an autoimmune disease characterized by immune-mediated cell death of insulin-producing β-cells of the pancreatic islets of Langerhans[1, 2]. Current treatment with daily insulin injections fails to achieve the strict glycemic control observed in healthy individuals, leading to progressive secondary pathologies that decrease patient quality of life and lead to adverse clinical outcomes including kidney failure, blindness, and limb amputation [3]. To alleviate these sequelae of inadequate glycemic control and free patients from the burden of daily insulin injection, islet cell transplantation (ICT) has been proposed as a permanent treatment for T1DM[4]. The Edmonton protocol for intrahepatic ICT has achieved insulin independence in up to 80% of patients for a median of 3 years[5, 6] but is limited by the loss of transplanted β-cell mass and function due to immune-mediated and inflammation-induced apoptosis[7, 8], lack of vascularization[9], decreased proliferative potential[10], and impaired insulin secretion[11]. Current approaches to preventing the loss of β-cell mass and function resulting from these deleterious phenomena include the use of biomaterial scaffolds to control the islet microenvironment[12] and the addition of biological functionality to islets through genetic modification[13], substrate immobilization[14], or ligand presentation[15–17].
One source of biological functionality for the enhancement of ICT is the action of glucagon-like peptide 1 (GLP-1). GLP-1 is an incretin hormone produced by the gut epithelium in response to nutrient delivery to the duodenum that exerts insulinotropic effects on the endocrine pancreas through activation of the GLP-1 receptor[18, 19]. The N-terminal residues of GLP-1 bind to the receptor core to stimulate activation, while the C-terminal residues of GLP-1 stabilize the coiled coil homodimeric active structure and bind to the receptor arm to enhance the binding energy[20–22]. The GLP-1 receptor is a G-protein coupled receptor that requires clustering in caveolin-1 lipid rafts for activity[23]. Receptor activation results in short-term glucose-sensitive insulin secretion via two distinct signaling pathways activated by cyclic adenosine monophosphate (cAMP): the protein kinase A (PKA) pathway and the endogenous protein activated by cAMP 2 (Epac2) pathway. Prolonged GLP-1 receptor activation stimulates long-term insulin production, inhibits apoptosis, induces proliferation, and inhibits inflammatory cytokine-mediated β-cell apoptosis[18, 24]. Multiple groups have previously incorporated the biological functionality of GLP-1 into biomaterials for ICT through chemical conjugation of native GLP-1 to polyethylene glycol (PEG) to produce biomaterials that demonstrate enhanced insulin secretion and enhanced survival in the presence of inflammatory cytokines [25–27]. In this work, we have utilized peptide amphiphiles (PAs) to generate a bioactive, cytoprotective, and fully biodegradable scaffold for ICT. This scaffold supports the survival, proliferation, and function of transplanted β-cells during the post-transplant period, in which the cells are susceptible to inflammatory and immune-mediated damage leading to transplant failure, while allowing for the eventual replacement with secreted native extracellular matrix to support long-term engraftment. PAs are composed of an oligopeptide conjugated to a lipid tail[28], and our group first introduced peptide sequences that lead to the self-assembly of high aspect ratio cylindrical nanofibers and at the same time effectively display bioactive epitopes on their surfaces[29, 30]. Self-assembly, mediated by hydrophobic collapse of lipid tails and hydrogen bond formation among oligopeptides, is promoted by charge screening by ions[31–35]. Divalent and trivalent ions cross-link PA nanofibers to form a three-dimensional network that turns aqueous solutions into macroscopic gels[36]. Cells suspended in PA solutions can be easily encapsulated by these gels, forming an artificial ECM[37]. The biological activity of the PA is conferred by bioactive sequences that can bind soluble ligands or cell surface receptors[38–42]. Different PA molecules can be co-assembled to present multiple bioactive epitopes on a single PA nanofiber[43–45]. PA nanofibers have the capacity to signal for differentiation[46], proliferation[47], and biological adhesion[48] and have demonstrated in vivo biocompatibility with biodegradation[49]. Previous application of PA nanofibers to islet transplantation focused on addition of proangiogenic bioactivity to promote vascularization of transplanted islets. The heparin-binding PA developed by our group[41] demonstrated enhanced islet vascularization and cure rate in a murine model of ICT[50] and was subsequently shown to enhance sprouting of new blood vessels from islets in vitro[15]. In this work, we incorporate the insulinotropic and proliferative bioactivity of GLP-1 into a PA molecule using a GLP-1-mimetic peptide sequence. Multiple GLP-1-mimetic peptides have been identified[51], including the clinically used peptide drug exendin-4 (Byetta™, Amylin Pharmaceuticals). We chose the 9mer GLP-1-mimetic peptide Ser[2]exendin(1–9) with sequence HSEDTFTSD[52], which has demonstrated bioactivity both in vitro and in vivo and is resistant to enzymatic inactivation due to the substitution at the second residue[53]. By incorporating this peptide sequence into a functional GLP-1-mimetic PA, we seek to create a single-component biomaterial that forms a cell-encapsulating network of nanofibers under physiological conditions, contains GLP-1 biological functionality, and does not require secondary chemical reactions or non-biodegradable materials.
2. Materials and Methods
2.1. Peptide Synthesis and Purification
All PAs and peptides were synthesized by fluorenylmethoxycarbonyl (Fmoc) protected solid-phase peptide synthesis as previously reported by our group[29] using materials purchased from EMD Chemicals Inc. (Merck KGaA, Darmstadt, Germany). Briefly, the PAs/peptides were synthesized at 0.5mmol scale on Rink Amide MBHA resin. For each amino acid addition, the resin was deprotected using 30% piperidine in dimethylformamide (DMF), and the amino acid was coupled using 4 eq. of protected amino acid functionalized with 4 eq. of 2-(1hbenzotriazole-1-yl)-1,1,3,3- tetramethyluronium hexafluorophosphate (HBTU) and 6 eq. of diisopropylethylamine (DIPEA) in DMF. The dodecanoic acid tail was similarly functionalized and coupled to a lysine side chain following selective deprotection of the 4-methyltrityl (Mtt) group using a 91:5:4 mixture of dichloromethane (DCM), triisopropylsilane (TIPS), and trifluoroacetic acid (TFA). Resin cleavage and amino acid deprotection was performed using a 94:3:3 mixture of TFA, TIPS, and water. Following rotary evaporation of solvent, the PAs/peptides were precipitated with diethyl ether at −20°C and dried under vacuum to generate crude product with identity confirmed by electrospray ionization (ESI) mass spectrometry.
All PAs and peptides were purified by reverse-phase high performance liquid chromatography (HPLC) as previously reported by our group[29]. Briefly, the crude product was dissolved in 0.1% ammonium hydroxide in water, filtered, injected onto a Gemini-NX 5µ C18 column, and eluted using a water-acetonitrile solvent gradient for separation. The purified product was lyophilized and stored at −20°C. The purity of each product was determined by LCMS, and the peptide content of each product was determined by amino acid analysis (Commonwealth Biotechnologies Inc., Richmond, VA). For all subsequent assays, the reported concentration of the PAs and peptides is the monomer concentration calculated from the monomer molecular weight and adjusted for peptide content.
2.2. Transmission Electron Microscopy
The nanostructure morphology of each PA was characterized using transmission electron microscopy (TEM). For conventional TEM, 7µL of each PA dissolved at 1mM in saline with 1mM calcium chloride was deposited on a copper grid with 300 mesh carbon support film, negatively stained with 2% (w/v) uranyl acetate, and dried at room temperature. For cryogenic TEM, 7µL of 1mM PA solution in saline with 1mM calcium chloride was deposited onto a copper grid with holey carbon support film. The sample was plunged in liquid ethane using a Vitrobot Mark IV vitrification robot at 95–100% himidity and transferred in liquid nitrogen to a Gatan 626 cryo holder. Images were visualized using a JEOL 1230 microscope at 100kV accelerating voltage.
2.3. Small-Angle X-Ray Scattering
The nanostructure morphology of each PA was further characterized using small-angle X-ray scattering (SAXS). Approximately 40µL of 5mM PA solution in saline with 1mM calcium chloride was placed in a 2mm quartz capillary tube for analysis by SAXS. An identical capillary tube containing an identical solution without PA was used for background subtraction. SAXS was performed on the 5ID-D beam line of the Dupont-Northwestern-Dow Collaborate Access Team (DND-CAT) Synchotron Research Center at the Advanced Photon Source, Argonne National Laboratory. The X-ray energy of 15 keV was selected using a double-crystal monochromator to produce a typical incident flux of 1012 photons/s estimated by a helium ion channel. The SAXS profile of each PA was fit to a cylindrical coreshell model or analyzed for the initial log-log slope to determine the dimensions of the peptide shell and hydrophobic core of the PA nanofiber.
2.4. Circular Dichroism Spectroscopy
The secondary structure of each PA was characterized using circular dichroism (CD) spectroscopy[54]. Each PA was dissolved at 100µM in aqueous solution and adjusted to desired pH with ammonium hydroxide and hydrochloric acid. Spectra were measured on a JASCO J-715 CD spectrophotometer using a 0.1cm path length quartz cuvette. The CD spectra were fit to linear combinations of reference spectra for known secondary structures using the PEPFIT algorithm[55] to estimate secondary structure.
2.5. Rheology
The rheological measurements were carried out on a Paar Physica MCR-300 rheometer using a 25mm parallel plate with a 0.5mm gap distance at 25°C. Approximately 160µl of 8mM PA solutions were gelled directly on the rheometer using 20µl of 500mM calcium chloride in water. Following a 1-hour time test performed at 10Hz and 0.1% strain to allow gel maturation and ensure gel tolerance to rheological measurement, a frequency sweep was performed from 100Hz to 1Hz at 0.1% strain to generate the reported storage and loss moduli.
2.6. Cell Culture and Reagents
Rat insulinoma (RINm5f) cells (American Type Culture Collection, Manassas, VA) were maintained in monolayer culture on tissue-culture polystyrene (TCPS) flasks in complete growth medium (RPMI-1640 supplemented with 10% fetal bovine serum and 100µg/mL penicillin/streptomycin). Upon reaching 80% confluence, cells were detached using 0.25% trypsin with ethylenediaminetetraacetic acid (EDTA) and resupended in growth medium for reseeding or functional assays. All media components, positive controls (exendin-4), and inhibitors (H-89, β-methylcyclodextrin, exendin(9–39)) were purchased from the Sigma-Aldrich Corporation in St. Louis, MO.
2.7. Insulin Release Assay
RINm5f cells (were seeded at 400,000 cells/well in 48-well TCPS plates or encapsulated in PA gels as described below and cultured for 2 days in assay medium (RPMI-1640 supplemented with 2.5mM glucose, 10% fetal bovine serum, and 100µg/mL penicillin/streptomycin) or 1 day in assay medium followed by 12 hours in glucose-depleted medium (glucose-free RPMI-1640 supplemented as above). Since basal RPMI-1640 medium contains 11.1mM glucose, the final glucose concentration of the assay medium is 13.6mM. A 30-minute pretreatment period with fresh media or inhibitors was used for equilibration or inhibition. Media was collected following a 4-hour treatment period to assess insulin release from monolayer culture or a 24-hour treatment period to assess insulin release from gels. From the collected media, insulin release was quantified relative to a no treatment control using a rat insulin enzyme-linked immunosorbent assay (ELISA) kit (Millipore Corporation, Billerica, MA) according to the manufacturer’s protocol. The reported insulin release per million cells is based on the total number of cells seeded.
2.8. Intracellular cAMP Assay
RINm5f cells were seeded at 400,000 cells/well in 48-well TCPS plates and cultured in untreated assay medium for 2 days. Following 1-hour pretreatment with fresh assay medium, the indicated treatment was added for 30 minutes. The cells were lysed and analyzed for intracellular cAMP concentration using the cAMP-Glo™ assay kit (Promega Corporation, Madison, WI) according to the manufacturer’s protocol.
2.9. Cell Viability Assay
RINm5f cells were seeded at 200,000 cells/well in 48-well TCPS plates and cultured in untreated assay medium for 1 day followed by culturing in assay medium containing the indicated treatment for 1 day. The cell viability was measured using the Live/Dead Cell Viability Assay (Invitrogen Corporation, Carlsbad, CA). Briefly, cells were stained with 4mM calcein acetoxymethyl ester (calcein AM) and 2mM ethidium homodimer-1 (EthD-1) at 37°C for 20 minutes and visualized using a Nikon Eclipse TE2000-U inverted fluorescence microscope with 488nm and 546nm filters. For each condition, the number of EthD-1 positive cells, the calcein AM positive cell area, and the average calcein AM positive cell size were determined using a custom macro in ImageJ software (NIH). The total cell number was calculated as the calcein AM positive cell area divided by the average calcein AM positive cell size, and the EthD-1 positive cell index was calculated as the number of EthD-1+ cells divided by this total cell number.
2.10. Cell Encapsulation in PA Gels
To form PA gels for cell encapsulation, each PA was dissolved at 10mM in saline and titrated to pH 7.4 using sodium hydroxide. Each PA solution was supplemented with 1mM calcium chloride, heated to 80°C for 30 minutes, and cooled to room temperature. Each PA solution was mixed 4:1 by volume with phosphate-buffered saline (PBS) containing suspended RINm5f for a final PA concentration of 8mM and a final cell concentration of 5000 cells/µL. For each replicate, a 10µL droplet of PA solution with cells was placed on glass surface, gelled with two successive 10µL additions of 100mM calcium chloride for 10 minutes each, and placed in complete assay medium for subsequent immunostaining or insulin release assay. The total gelation time was approximately 20 minutes.
2.11. Immunostaining for Cell Proliferation
To assess proliferation of RINm5f cells encapsulated in PA gels, 3µg/mL bromodeoxyuridine (brdU) was added to the assay medium for the last 4 hours of the 24-hour treatment period. The PA gels were fixed with 4% paraformaldehyde in PBS for 30 minutes at room temperature, and the cellular DNA was degraded by with 2N hydrochloric acid for 30 minutes at 37°C. The PA gels were blocked and permeabilized with blocking buffer (10% normal goat serum, 2% bovine serum albumin, 0.4% Triton X100 in PBS) for 30 minutes at 4°C. The PA gels were stained with AlexaFluor555-conjugated mouse monoclonal IgG primary antibody against brdU (Invitrogen, clone MoBU-1) diluted 1:100 in blocking buffer overnight at 4°C. The labeled cells were visualized using a Zeiss 510 laser scanning confocal microscope with separate channels for 488nm fluorescence and differential interference contrast (DIC). This confocal microscopy generated a stack of images from throughout the thickness of the PA gel. The BrdU positive cell count and total cell count were determined manually from the fluorescence and DIC images respectively.
2.12. Statistics and Data Analysis
For the insulin release assay, four replicates of each condition were analyzed to calculate the sample mean, standard error, and confidence interval assuming normal distribution. To establish statistical significance, each condition was compared to no treatment using the Student’s t-test, and where indicated, compared to other treatments following the Tukey method to adjust for multiple comparisons.
For the cell viability and cell proliferation assays, the number of EthD-1 positive or BrdU positive cells and total cells was analyzed to calculate the sample proportion and confidence intervals assuming normal approximation of binomial distribution. To establish statistical significance, each condition was compared to the no treatment or control condition using the two-proportion z-test with unpooled sample variance (Wald test).
3. Results and Discussion
3.1 GLP-1-mimetic PA self-assembles into one-dimensional nanofibers with α-helical conformation
The GLP-1-mimetic PA was designed to present the bioactive GLP-1-mimetic peptide Ser[2]exendin(1–9)[52] on the surfaces of self-assembling nanofibers. The GLP-1-mimetic PA (Figure 1a) contains this bioactive peptide added to the amino terminus of the non-bioactive PA backbone, subsequently referred to as the control PA (Figure 1d). Both the GLP-1-mimetic PA and the control PA formed gels in the presence of calcium ions or acid. Cryogenic transmission electron microscopy (TEM) revealed that the GLP-1-mimetic PA self-assembled into short cylindrical nanofibers approximately 10nm in diameter (Figure 1b), while the control PA self-assembles into long cylindrical nanofibers mixed with flatter twisted nanostructures (Figure 1e). The nanofiber morphology observed by TEM for the GLP-1-mimetic PA was confirmed using small-angle x-ray scattering (SAXS). The SAXS spectrum of the GLP-1-mimetic PA was successfully fit to a cylindrical core-shell model of nanofibers with diameter 9.8nm and length 120nm consistent with structures observed by TEM (Supplementary Figure 1a). The SAXS spectrum of the control PA could not be fit to the cylindrical core-shell model but showed an initial log-log slope of −2.3, consistent with the flatter twisted nanostructures observed by TEM (Supplementary Figure 1b).
Figure 1.

Chemical structures and nanofiber self-assembly of PA molecules. The chemical structure of the GLP-1-mimetic PA (a) and the control PA (d) are identical except for the inclusion of the bioactive epitope Ser[2]exendin(1–9) at the N-terminus of the GLP-1-mimetic PA. The morphology of GLP-1-mimetic PA nanofibers (b) and control PA nanofibers (e) dissolved at 1mM in saline with 1mM calcium chloride was visualized by cryogenic TEM. The self-assembly of the GLP-1-mimetic PA into nanofibers stabilizes the α-helical conformation of the mimetic peptide (c). Please reproduce in color on the web and in print.
The secondary structures of the GLP-1-mimetic PA and control PA were characterized using circular dichroism (CD) spectroscopy (Figure 2a,b). The CD spectra were fit to linear combinations of reference spectra for known secondary structures using the PEPFIT algorithm[55] (Figure 2c). Both PAs have predominantly random coil character under basic conditions, but upon addition of acid to promote self-assembly, the GLP-1-mimetic PA transitions to strong α-helical character, while the control PA transitions to weak β-sheet character. Thus, self-assembly of the GLP-1-mimetic PA stabilizes the α-helical conformation of the mimetic peptide (Figure 1c).
Figure 2.

Conformational analysis of PA molecules. The GLP-1-mimetic PA (a) and control PA (b) were dissolved at 100µM in aqueous solution under basic conditions with ammonium hydroxide or acidic conditions with hydrochloric acid for measurement of the CD spectra. These CD spectra were fit to linear combinations of reference spectra for known secondary structures using the PEPFIT algorithm to determine the conformational character (c).
3.2. GLP-1-mimetic PA nanofibers enhance insulin release in RINm5f cells
The bioactivity of each PA or peptide was measured by its stimulation of insulin release from a rat insulinoma (RINm5f) β-cell line as quantified by enzyme-linked immunosorbent assay (ELISA). For these and subsequent assays, the PA or peptide concentration is the monomer concentration calculated from the monomer molecular weight and adjusted for peptide content, and the insulin release per million cells is based on the total number of cells seeded. The dose response of 4-hour insulin release normalized to no treatment was compared for the following treatments: GLP-1-mimetic PA, exendin-4, Ser[2]exendin(1–9) peptide, and control PA (Figure 3a,b). The GLP-1-mimetic PA achieved a maximal response of 2.5-fold increase in insulin release, which is similar to the 1.9-fold increase in insulin release observed for exendin-4 here and in previous investigations[56]. The bioactivity of native GLP-1(7–37) in this assay is shown for comparison. The GLP-1-mimetic PA activity was not affected by a 4-fold reduction in the cell seeding density. The control PA did not produce a statistically significant increase in insulin release, while the peptide control Ser[2]exendin(1–9) produces a 1.3-fold increase in insulin release at the highest dose. Thus, the GLP-1-mimetic PA nanofibers exhibit significantly higher activity than the bioactive peptide, indicating that the incorporation of the peptide into a supramolecular nanofiber enhances activity. Since the control PA shows no bioactivity, this enhanced activity does not result from the supramolecular structure of PA nanofibers alone but likely results from the surface presentation of bioactive peptides by the nanofibers.
Figure 3.

Insulinotropic activity of soluble PA nanofibers. The positive control exendin-4, GLP-1-mimetic PA, control PA, and peptide control Ser[2]exendin(1–9) were assayed for stimulation of 4-hour insulin release from RINm5f cells in monolayer culture as quantified by ELISA (a,b; * p<0.05, ** p<0.01 vs. no treatment; # p<0.05, ## p<0.01 vs. Ser[2]exendin(1–9)). Glucose depletion fully abrogated activity of the GLP-1-mimetic PA but not exendin-4 (c; ** p<0.01 vs. 13.6mM glucose, # p<0.05 vs. 2.5mM glucose), while PKA inhibitor H-89 partially abrogated activity and lipid raft ablator β-MCD fully abrogated activity (d; * p<0.05, ** p<0.01 vs. H-89; # p<0.05, ## p<0.01 vs. no treatment). Error bars represent S.E.M.
3.3. GLP-1-mimetic PA-induced insulin release is partially PKA-dependent, fully lipid raft-dependent, and fully glucose-dependent
Since the mechanism of action of native GLP-1 requires glucose sensing, lipid raft formation, and PKA activity, the contribution of these pathways to GLP-1-mimetic PA activity was measured to determine whether it has a similar mechanism of action. Glucose depletion prior to assessment of insulin release completely abolished the activity of the GLP-1-mimetic PA and significantly reduced the activity of exendin-4 (Figure 3c), indicating that the GLP-1-mimetic PA acts in a glucose-dependent manner similar to exendin-4. The addition of PKA inhibitor H-89 partially decreased GLP-1-mimetic PA-induced insulin secretion (Figure 3d). Interestingly, the absolute magnitude of the decrease was consistent over multiple dosages of GLP-1-mimetic PA, indicating that high doses of GLP-1-mimetic PA are able to activate a PKA-independent pathway. However, addition of the cholesterol sequestering agent β-methylcyclodextrin (β-MCD), which inhibits the formation of lipid rafts, completely abolishes the activity of the GLP-1-mimetic PA (Figure 3d), indicating that the putative PKA-independent pathway is dependent on lipid raft formation. Both H-89 alone and β-MCD alone had no effect on insulin release compared to no treatment.
We hypothesize that this PKA-independent pathway for insulin release is mediated by Epac2, which is activated by high concentrations of cAMP[18]. The GLP-1-mimetic PA at high doses may be able to produce sufficient concentrations of cAMP to activate this pathway. Consistent with this hypothesis, we observed a significantly greater increase in intracellular cAMP concentration upon activation with GLP-1-mimetic PA compared to exendin-4 or control PA (Figure 4). This result provides a mechanistic basis for the downstream effect of the GLP-1-mimetic PA on insulin release.
Figure 4.
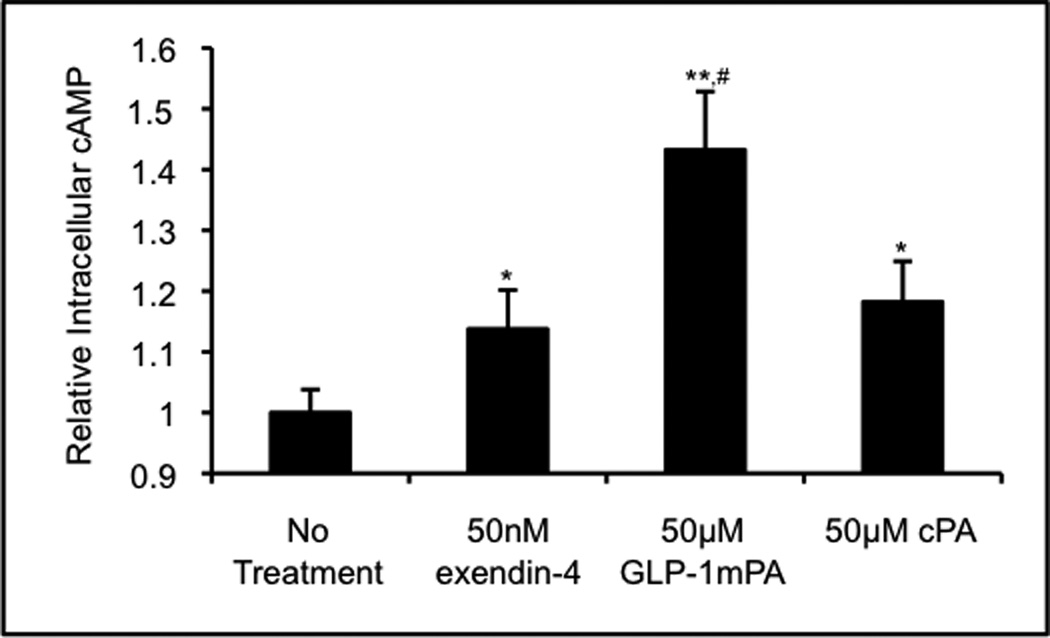
Cyclic AMP upregulation by soluble PA nanofibers. The intracellular cAMP concentration within RINm5f cells in monolayer culture was assayed either untreated or treated with exendin-4, GLP-1-mimetic PA, or control PA. The intracellular cAMP concentration was significantly higher following GLP-1-mimetic PA treatment than following either exendin-4 or control PA treatment (* p<0.05, ** p<0.01 vs. no treatment; # p<0.05 vs. exendin-4 and control PA).
3.4. GLP-1-mimetic PA nanofibers prevent inflammatory cytokine-induced death of RINm5f cells
Since cytokine-induced inflammatory damage is a significant contributor to post-transplant islet loss[7], we tested the ability of the GLP-1-mimetic PA to reduce inflammatory cytokine-induced cell death in β-cells. A cytokine mixture consisting of 5ng/mL interleukin-1β (IL-1β), 10ng/mL tumor necrosis factor α (TNF-α), and 25ng/mL interferon γ (IFN-γ) chosen based on previous investigations of cytokine-induced death of rat islet cells[24] produced a 6-fold increase in RINm5f cell death at 24 hours compared to no treatment (Figure 5a,b). Following pretreatment and concurrent treatment with exendin-4, the cytokine-induced cell death decreased to a 1.4-fold increase over no treatment (Figure 5d). However, following pretreatment and concurrent treatment with GLP-1-mimetic PA, the cytokine-induced cell death was indistinguishable from the no treatment condition (Figure 5c). Pretreatment and concurrent treatment with control PA produces a small decrease in cytokine-induced cell death, indicating that the effect of the GLP-1-mimetic PA is mostly due to its bioactive sequence. These results are consistent with other investigations indicating that GLP-1 receptor activation can protect β-cells from the effects of inflammatory cytokines[24]. The incorporation of this activity into ICT protocols using the GLP-1-mimetic PA could potentially reduce inflammation-induced post-transplant islet loss, overcoming one of the major barriers to success of this intervention.
Figure 5.
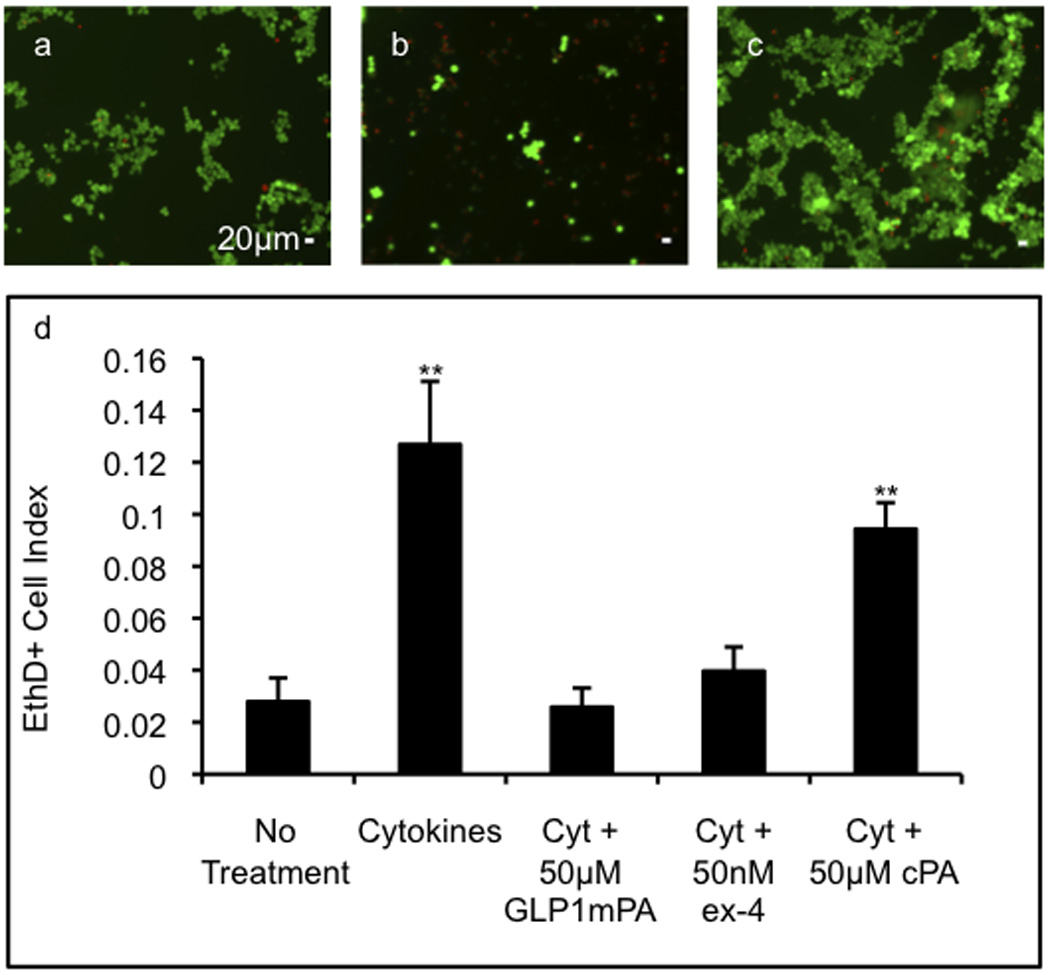
Cytoprotective activity of soluble PA nanofibers. The viability of RINm5f cells in monolayer culture was assayed either untreated (a), with inflammatory cytokines (5ng/mL IL-1β, 10ng/mL TNF-α, and 25ng/mL IFN-γ) alone (b), with cytokines and GLP-1-mimetic PA (c), or with cytokines and exendin-4 or cytokines and control PA by staining with 2µM ethidium homodimer-1 (red) to visualize dead cells and with 4µM calcein AM (green) to visualize live cells. The proportion of dead cells is significantly increased in the presence of cytokines but is returned to the baseline value with GLP-1-mimetic PA or exendin-4 (e; error bars: 95%CI; ** p<0.01 vs. no treatment). Please reproduce in color on the web and in print.
3.5. GLP-1-mimetic PA gels enhance insulin release and proliferation of encapsulated β-cells in a cytokine-resistant manner
We next tested whether the functional effects of the GLP-1-mimetic PA on β-cells are retained when the cells are encapsulated in a PA gel. While gel formation occurred instantaneously in the presence of calcium chloride, a total gelation time of 20 minutes was used to ensure complete diffusion of calcium for formation of a homogeneous PA gel. The insulinotropic effect of the GLP-1-mimetic PA is enhanced when used as a PA gel for cell encapsulation, with GLP-1-mimetic PA gels producing a 7.9-fold increase in insulin release from RINm5f cells at 24 hours compared to control PA gels (Figure 6a). This increase is fully retained when the PA gel contains 10% GLP-1-mimetic PA and 90% control PA, indicating that the enhanced insulin release is due to insulinotropic effects of the GLP-1-mimetic PA and not due to effects of the control PA. The potential effects of rheology were also ruled out as a contributor to insulinotropic bioactivity by confirming that the 10% GLP-1-mimetic PA gel and control PA gel have similar rheological properties (Supplementary Figure 2). The dose response of insulin release to the GLP-1-mimetic PA at lower concentrations in the gel is shown at multiple time points in Figure 6b. The dose response profile and saturation at high concentration are consistent with the dose response data in Figure 3. Most of the insulin release occurs in the first four hours in all conditions, which likely represents the release of preformed insulin granules at the cell membrane upon activation and indicates that the PA gel does not significantly slow the release of insulin from encapsulated cells. The total insulin release from cells encapsulated within the control PA gel (17µg per million cells) is not significantly different from that of unencapsulated cells treated with the highest dose of control PA (19µg per million cells). For comparison with the GLP-1-mimetic PA-containing gels, exendin-4 at its maximally active dose of 50nM in a control PA gel produces a 2.0-fold increase in insulin release from encapsulated β-cells at 24 hours, which is also consistent with the dose response data. Upon addition of a cytokine mixture consisting of 20ng/mL IL-1β, 40ng/mL TNF-α, and 100ng/mL IFN-γ, the insulinotropic activity of GLP-1-mimetic PA gels is partially reduced to a 4.9-fold increase in insulin release, which is still significantly higher than the insulin release from the control PA gel with exendin-4.
Figure 6.
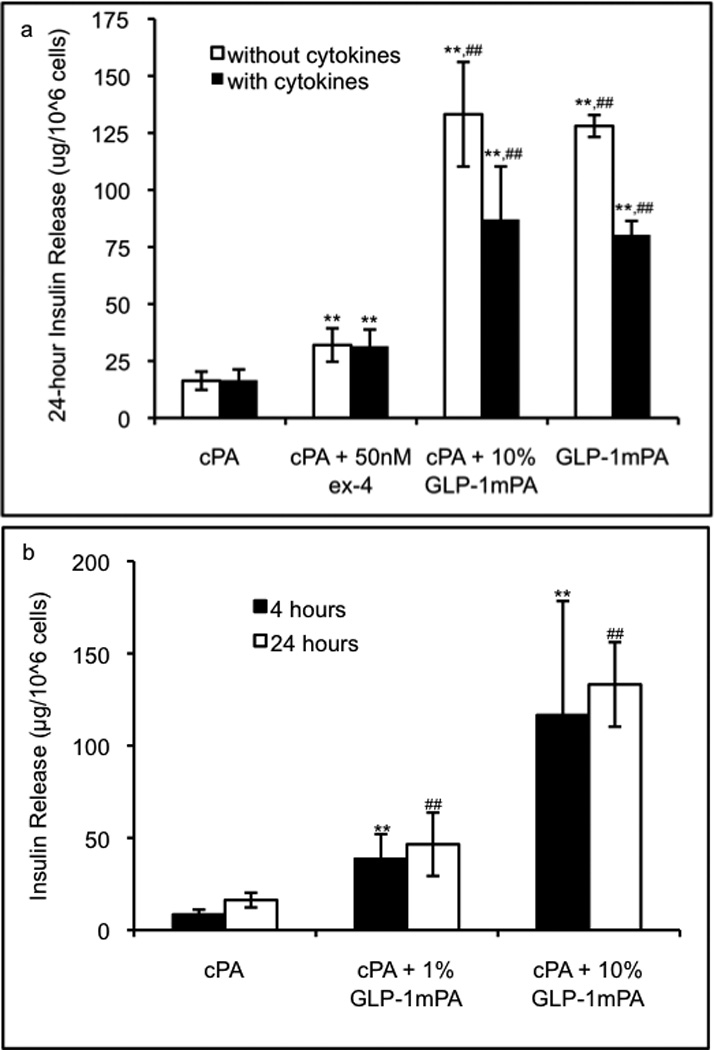
Insulinotropic activity of PA gels. The 8mM PA gels containing 5000 RINm5f cells/uL were assayed for stimulation of insulin release at 24 hours in the presence or absence of inflammatory cytokines (20ng/mL IL-1β, 40ng/mL TNF-α, and 100ng/mL IFN-γ) to demonstrate that GLP-1-mimetic PA gel at 10% or 100% produces significantly higher insulin release than exendin-4 or control PA gel (a; error bars: 95%CI; ** p<0.01 vs. control PA gel; ## p<0.01 vs. exendin-4 in control PA gel). The time course and dose response of insulin release from GLP-1-mimetic PA gels are shown (b; error bars: 95%CI; ** p<0.01 vs. control PA gel at 4 hours; ## p<0.01 vs. control PA gel at 24 hours).
The proliferative effects of the GLP-1-mimetic PA gel on encapsulated RINm5f cells were assayed using BrdU incorporation. For this assay, confocal microscopy was used to generate a stack of images from throughout the thickness of the gel, and these images confirmed that the cells were homogeneously distributed throughout the gel. The GLP-1-mimetic PA gel produced a 2.3-fold increase in BrdU incorporation compared to the control PA gel (Figure 7a,b), while the addition of 50nM exendin-4 to the control PA gel produced no change in proliferation (Figure 7c). The 10% GLP-1-mimetic PA in control PA gel retains the activity of the GLP-1-mimetic PA gel, producing a 2.0-fold increase in BrdU incorporation. The addition of the cytokine mixture to the GLP-1-mimetic PA gel produces a similar 1.8-fold increase in BrdU incorporation. These results are broadly consistent with the insulin release data in Figure 5. The ability of the GLP-1-mimetic PA gel to promote enhanced insulin release and proliferation of encapsulated β-cells in a cytokine-resistant manner demonstrates its potential to enhance ICT. The GLP-1-mimetic PA can be readily incorporated into ICT protocols previously developed used with the heparin-binding PA (HBPA) to enhance islet vascularization[50]. Given the ability of the GLP-1-mimetic PA to encapsulate and activate individual β-cells, this novel biomaterial could be used to develop ICT protocols utilizing newer sources of β-cells, such as differentiated human embryonic stem cells[57] and differentiated induced pluripotent stem cells[58], which will be necessary for widespread implementation of ICT for the type 1 diabetic population. Since GLP-1 promotes the differentiation of β-cells from pancreatic ductal and embryonic progenitors[59], and GLP-1 agonists are currently used in differentiation protocols for β-cells[58], the GLP-1-mimetic PA may also be useful in developing protocols for β-cell differentiation in situ following transplantation of stem or progenitor cells. Furthermore, the ability of PA nanofibers to encapsulate and sustain release of hydrophobic drugs[60] can be used for localized delivery of immunosuppressive agents following islet transplantation, potentially avoiding their systemic toxicity.
Figure 7.

Proliferative activity of PA gels. The 8mM PA gels containing 5000 RINm5f cells/uL were assayed for cell proliferation by brdU incorporation and immunostaining followed by visualization of brdU+ cells (red) and total cells (DIC, grey) using confocal microscopy (a: control PA gel; b: GLP-1-mimetic PA gel). The GLP-1-mimetic PA gel at 10% or 100% with or without cytokines produces significantly higher proliferation than exendin-4 or control PA (c; error bars: 95%CI; * p<0.05, ** p<0.01 vs. control PA gel). Please reproduce in color on the web and in print.
4. Conclusions
We have successfully incorporated the biological activity of the insulinotropic peptide GLP-1 into self-assembling PA nanofibers to produce a novel biomaterial that demonstrates enhanced bioactivity and forms a macroscopic gel for three-dimensional encapsulation and culture of β-cells. This GLP-1-mimetic PA stimulates insulin release from rat β-cells that is significantly greater than the peptide alone and comparable to the clinically used agonist exendin-4. However, the GLP-1-mimetic PA protects β-cells from inflammatory cytokine-induced cell death to a greater extent than exendin-4. Furthermore, GLP-1-mimetic PA gels stimulate insulin secretion and proliferation of encapsulated β-cells to a greater extent than control PA gels containing exendin-4, indicating that the bioactivity of peptide signals presented on the PA nanofibers cannot be recapitulated simply by incorporating soluble bioactive molecules into non-bioactive gels. The capabilities of the GLP-1-mimetic PA to form a gel of self-assembling nanofibers that enhances β-cell activity, viability, and proliferation demonstrate its potential for incorporation into islet cell transplantation protocols to potentially enhance this intervention as a permanent cure for type 1 diabetes mellitus.
Supplementary Material
Supplementary Figure 1. Nanostructure morphology analyzed by SAXS. Log-log plots of the scattering intensity as a function of scattering vector magnitude generated upon bombardment with a 15 keV x-ray beam with typical incident flux of 1012 photons/s are shown for (a) 5mM GLP-1-mimetic PA in water fit to a cylindrical core-shell model using Igor Pro 6.2 software and (b) 5mM control PA in water with initial slope of −2.3. The model parameters used for fitting are as follows: mean core radius = 1.59nm, radial polydispersity σ = 0.314, core length = 120.7nm, radial shell thickness = 3.31nm, face shell thickness = 3.00 nm, scattering length density of core = 9.36×10⁻⁶ Å−2, scattering length density of shell = 2.30×10⁻⁵ Å−2, scattering length density of solvent = 9.42×10⁻⁶ Å−2.
Supplementary Figure 2. Rheological analysis of PA gels. The storage modulus (G’) and loss modulus (G”) of 8mM PA gels are shown over a range of angular frequencies for a control PA gel and a 10% GLP-1-mimetic PA in control PA gel.
Acknowledgments
This work was funded by research grant 2 R01 EB003806-06A2 (NIH/NIBIB), and the primary author’s graduate studies were supported by training grant 5 T90 DA022881 from NIH/NIDA. The authors would like to acknowledge the following core facilities at Northwestern University: Biological Imaging Facility, which operates the JEOL 1230 microscope used for TEM, Cell Imaging Facility, which operates the Zeiss LSM 510 microscope used for confocal imaging, Keck Biophysics Facility, which operates the JASCO J-815 spectrophotometer used for circular dichroism, and Institute for BioNanotechnology and Medicine, where most of this work was completed. The authors would also like to acknowledge the DND-CAT Synchotron Research Center at Argonne National Laboratory where the SAXS experiment was completed. Finally, the authors would like to thank Mark McClendon for conducting the rheological measurements, Liam Palmer for editing this manuscript, Mark Seniw for constructing the graphical representation of GLP-1-mimetic PA self-assembly.
Footnotes
Publisher's Disclaimer: This is a PDF file of an unedited manuscript that has been accepted for publication. As a service to our customers we are providing this early version of the manuscript. The manuscript will undergo copyediting, typesetting, and review of the resulting proof before it is published in its final citable form. Please note that during the production process errors may be discovered which could affect the content, and all legal disclaimers that apply to the journal pertain.
Contributor Information
Saahir Khan, Email: saahir-khan@northwestern.edu.
Shantanu Sur, Email: s-sur@northwestern.edu.
Christina J. Newcomb, Email: cnewcomb@u.northwestern.edu.
Elizabeth A. Appelt, Email: elizabethappelt2008@u.northwestern.edu.
Samuel I. Stupp, Email: s-stupp@northwestern.edu.
References
- 1.Van Belle TL, Coppieters KT, Von Herrath MG. Type 1 diabetes: etiology, immunology, and therapeutic strategies. Physiol Rev. 2011;91:79–118. doi: 10.1152/physrev.00003.2010. [DOI] [PubMed] [Google Scholar]
- 2.Diseases NIoDaDaK. National Diabetes Statistics, 2007 Fact Sheet. Bethesda, MD: U.S. Department of Health and Human Services, National Institutes of Health; 2008. [Google Scholar]
- 3.Group WTftDCaCTEoDIaCR. Effect of intensive therapy on the microvascular complications of type 1 diabetes mellitus. JAMA. 2002;287:2563–2569. doi: 10.1001/jama.287.19.2563. [DOI] [PMC free article] [PubMed] [Google Scholar]
- 4.Harlan DM, Kenyon NS, Korsgren O, Roep BO, Society IoD. Current advances and travails in islet transplantation. Diabetes. 2009;58:2175–2184. doi: 10.2337/db09-0476. [DOI] [PMC free article] [PubMed] [Google Scholar]
- 5.Ryan EA, Paty BW, Senior PA, Bigam D, Alfadhli E, Kneteman NM, et al. Five-year follow-up after clinical islet transplantation. Diabetes. 2005;54:2060–2069. doi: 10.2337/diabetes.54.7.2060. [DOI] [PubMed] [Google Scholar]
- 6.Pileggi A, Cobianchi L, Inverardi L, Ricordi C. Overcoming the challenges now limiting islet transplantation: a sequential, integrated approach. Ann N Y Acad Sci. 2006;1079:383–398. doi: 10.1196/annals.1375.059. [DOI] [PubMed] [Google Scholar]
- 7.Emamaullee JA, Shapiro AMJ. Interventional strategies to prevent beta-cell apoptosis in islet transplantation. Diabetes. 2006;55:1907–1914. doi: 10.2337/db05-1254. [DOI] [PubMed] [Google Scholar]
- 8.Thomas HE, McKenzie MD, Angstetra E, Campbell PD, Kay TW. Beta cell apoptosis in diabetes. Apoptosis. 2009;14:1389–1404. doi: 10.1007/s10495-009-0339-5. [DOI] [PubMed] [Google Scholar]
- 9.Cross SE, Richards SK, Clark A, Benest AV, Bates DO, Mathieson PW, et al. Vascular endothelial growth factor as a survival factor for human islets: effect of immunosuppressive drugs. Diabetologia. 2007;50:1423–1432. doi: 10.1007/s00125-007-0670-8. [DOI] [PubMed] [Google Scholar]
- 10.Emamaullee JA, Shapiro AMJ. Factors influencing the loss of beta-cell mass in islet transplantation. Cell Transplant. 2007;16:1–8. [PubMed] [Google Scholar]
- 11.Lau J, Mattsson G, Carlsson C, Nyqvist D, Köhler M, Berggren P-O, et al. Implantation site-dependent dysfunction of transplanted pancreatic islets. Diabetes. 2007;56:1544–1550. doi: 10.2337/db06-1258. [DOI] [PubMed] [Google Scholar]
- 12.Narang AS, Mahato RI. Biological and biomaterial approaches for improved islet transplantation. Pharmacol Rev. 2006;58:194–243. doi: 10.1124/pr.58.2.6. [DOI] [PubMed] [Google Scholar]
- 13.Contreras JL, Bilbao G, Smyth CA, Eckhoff DE, Jiang XL, Jenkins S, et al. Cytoprotection of pancreatic islets before and early after transplantation using gene therapy. Kidney Int. 2002;61:S79–S84. doi: 10.1046/j.1523-1755.2002.0610s1079.x. [DOI] [PubMed] [Google Scholar]
- 14.Salvay DM, Rives CB, Zhang X, Chen F, Kaufman DB, Lowe WL, et al. Extracellular matrix protein-coated scaffolds promote the reversal of diabetes after extrahepatic islet transplantation. Transplantation. 2008;85:1456–1464. doi: 10.1097/TP.0b013e31816fc0ea. [DOI] [PMC free article] [PubMed] [Google Scholar]
- 15.Chow LW, Wang L-J, Kaufman DB, Stupp SI. Self-assembling nanostructures to deliver angiogenic factors to pancreatic islets. Biomaterials. 2010;31:6154–6161. doi: 10.1016/j.biomaterials.2010.04.002. [DOI] [PMC free article] [PubMed] [Google Scholar]
- 16.Kidszun A, Schneider D, Erb D, Hertl G, Schmidt V, Eckhard M, et al. Isolated pancreatic islets in three-dimensional matrices are responsive to stimulators and inhibitors of angiogenesis. Cell Transplant. 2006;15:489–497. doi: 10.3727/000000006783981774. [DOI] [PubMed] [Google Scholar]
- 17.Su J, Hu B-H, Lowe WL, Kaufman DB, Messersmith PB. Anti-inflammatory peptide-functionalized hydrogels for insulin-secreting cell encapsulation. Biomaterials. 2010;31:308–314. doi: 10.1016/j.biomaterials.2009.09.045. [DOI] [PMC free article] [PubMed] [Google Scholar]
- 18.Doyle ME, Egan JM. Mechanisms of action of glucagon-like peptide 1 in the pancreas. Pharmacol Ther. 2007;113:546–593. doi: 10.1016/j.pharmthera.2006.11.007. [DOI] [PMC free article] [PubMed] [Google Scholar]
- 19.Drucker DJ. Glucagon-Like Peptides: Regulators of Cell Proliferation, Differentiation, and Apoptosis. Molecular Endocrinology. 2003;17:161–171. doi: 10.1210/me.2002-0306. [DOI] [PubMed] [Google Scholar]
- 20.Chang X, Keller D, O'Donoghue SI, Led JJ. NMR studies of the aggregation of glucagon-like peptide-1: formation of a symmetric helical dimer. FEBS Lett. 2002;515:165–170. doi: 10.1016/s0014-5793(02)02466-3. [DOI] [PubMed] [Google Scholar]
- 21.Mann R, Nasr N, Hadden D, Sinfield J, Abidi F, Al-Sabah S, et al. Peptide binding at the GLP-1 receptor. Biochem Soc Trans. 2007;35:713–716. doi: 10.1042/BST0350713. [DOI] [PubMed] [Google Scholar]
- 22.Underwood C, Garibay P, Knudsen L, Hastrup S, Peters G, Rudolph R, et al. Crystal structure of glucagon-like peptide-1 in complex with the extracellular domain of the glucagon-like peptide-1 receptor. Journal of Biological Chemistry. 2009 doi: 10.1074/jbc.M109.033829. [DOI] [PMC free article] [PubMed] [Google Scholar]
- 23.Syme CA, Zhang L, Bisello A. Caveolin-1 regulates cellular trafficking and function of the glucagon-like Peptide 1 receptor. Mol Endocrinol. 2006;20:3400–3411. doi: 10.1210/me.2006-0178. [DOI] [PubMed] [Google Scholar]
- 24.Bregenholt S, Møldrup A, Blume N, Karlsen AE, Nissen Friedrichsen B, Tornhave D, et al. The long-acting glucagon-like peptide-1 analogue, liraglutide, inhibits beta-cell apoptosis in vitro. Biochem Biophys Res Commun. 2005;330:577–584. doi: 10.1016/j.bbrc.2005.03.013. [DOI] [PubMed] [Google Scholar]
- 25.Kim S, Wan Kim S, Bae YH. Synthesis, bioactivity and specificity of glucagon-like peptide-1 (7–37)/polymer conjugate to isolated rat islets. Biomaterials. 2005;26:3597–3606. doi: 10.1016/j.biomaterials.2004.09.045. [DOI] [PubMed] [Google Scholar]
- 26.Kizilel S, Scavone A, Liu X, Nothias JM, Ostrega D, Witkowski P, et al. Encapsulation of pancreatic islets within nano-thin functional polyethylene glycol coatings for enhanced insulin secretion. Tissue Eng Part A. 2010;16:2217–2228. doi: 10.1089/ten.TEA.2009.0640. [DOI] [PubMed] [Google Scholar]
- 27.Lin C, Anseth K. Glucagon-Like Peptide-1 Functionalized PEG Hydrogels Promote Survival and Function of Encapsulated Pancreatic beta-Cells. Biomacromolecules. 2009 doi: 10.1021/bm900420f. [DOI] [PMC free article] [PubMed] [Google Scholar]
- 28.Fields GB, Lauer JL, Dori Y, Forns P, Yu YC, Tirrell M. Protein-like molecular architecture: biomaterial applications for inducing cellular receptor binding and signal transduction. Biopolymers. 1998;47:143–151. doi: 10.1002/(SICI)1097-0282(1998)47:2<143::AID-BIP3>3.0.CO;2-U. [DOI] [PubMed] [Google Scholar]
- 29.Hartgerink JD, Beniash E, Stupp SI. Self-assembly and mineralization of peptide-amphiphile nanofibers. Science. 2001;294:1684–1688. doi: 10.1126/science.1063187. [DOI] [PubMed] [Google Scholar]
- 30.Hartgerink JD, Beniash E, Stupp SI. Peptide-amphiphile nanofibers: a versatile scaffold for the preparation of self-assembling materials. Proc Natl Acad Sci USA. 2002;99:5133–5138. doi: 10.1073/pnas.072699999. [DOI] [PMC free article] [PubMed] [Google Scholar]
- 31.Palmer LC, Stupp SI. Molecular self-assembly into one-dimensional nanostructures. Acc Chem Res. 2008;41:1674–1684. doi: 10.1021/ar8000926. [DOI] [PMC free article] [PubMed] [Google Scholar]
- 32.Palmer LC, Velichko YS, de la Cruz MO, Stupp SI. Supramolecular self-assembly codes for functional structures. Philos Transact A Math Phys Eng Sci. 2007;365:1417–1433. doi: 10.1098/rsta.2007.2024. [DOI] [PubMed] [Google Scholar]
- 33.Paramonov SE, Jun H-W, Hartgerink JD. Self-assembly of peptide-amphiphile nanofibers: the roles of hydrogen bonding and amphiphilic packing. J Am Chem Soc. 2006;128:7291–7298. doi: 10.1021/ja060573x. [DOI] [PubMed] [Google Scholar]
- 34.Tovar JD, Claussen RC, Stupp SI. Probing the interior of peptide amphiphile supramolecular aggregates. J Am Chem Soc. 2005;127:7337–7345. doi: 10.1021/ja043764d. [DOI] [PubMed] [Google Scholar]
- 35.Velichko YS, Stupp SI, de la Cruz MO. Molecular simulation study of peptide amphiphile self-assembly. The journal of physical chemistry B. 2008;112:2326–2334. doi: 10.1021/jp074420n. [DOI] [PubMed] [Google Scholar]
- 36.Stendahl JC, Rao MS, Guler MO, Stupp SI. Intermolecular Forces in the Self-Assembly of Peptide Amphiphile Nanofibers. Advanced Functional Materials. 2006;16:499–508. [Google Scholar]
- 37.Beniash E, Hartgerink JD, Storrie H, Stendahl JC, Stupp SI. Self-assembling peptide amphiphile nanofiber matrices for cell entrapment. Acta biomaterialia. 2005;1:387–397. doi: 10.1016/j.actbio.2005.04.002. [DOI] [PubMed] [Google Scholar]
- 38.Malkar NB, Lauer-Fields JL, Juska D, Fields GB. Characterization of peptide-amphiphiles possessing cellular activation sequences. Biomacromolecules. 2003;4:518–528. doi: 10.1021/bm0256597. [DOI] [PubMed] [Google Scholar]
- 39.Mardilovich A, Craig JA, McCammon MQ, Garg A, Kokkoli E. Design of a novel fibronectin-mimetic peptide-amphiphile for functionalized biomaterials. Langmuir : the ACS journal of surfaces and colloids. 2006;22:3259–3264. doi: 10.1021/la052756n. [DOI] [PubMed] [Google Scholar]
- 40.Rajangam K, Arnold MS, Rocco MA, Stupp SI. Peptide amphiphile nanostructure-heparin interactions and their relationship to bioactivity. Biomaterials. 2008;29:3298–3305. doi: 10.1016/j.biomaterials.2008.04.008. [DOI] [PMC free article] [PubMed] [Google Scholar]
- 41.Rajangam K, Behanna HA, Hui MJ, Han X, Hulvat JF, Lomasney JW, et al. Heparin binding nanostructures to promote growth of blood vessels. Nano Lett. 2006;6:2086–2090. doi: 10.1021/nl0613555. [DOI] [PubMed] [Google Scholar]
- 42.Shah RN, Shah NA, Del Rosario Lim MM, Hsieh C, Nuber G, Stupp SI. Supramolecular design of self-assembling nanofibers for cartilage regeneration. Proc Natl Acad Sci USA. 2010;107:3293–3298. doi: 10.1073/pnas.0906501107. [DOI] [PMC free article] [PubMed] [Google Scholar]
- 43.Behanna HA, Donners JJJM, Gordon AC, Stupp SI. Coassembly of amphiphiles with opposite peptide polarities into nanofibers. J Am Chem Soc. 2005;127:1193–1200. doi: 10.1021/ja044863u. [DOI] [PubMed] [Google Scholar]
- 44.Behanna HA, Rajangam K, Stupp SI. Modulation of fluorescence through coassembly of molecules in organic nanostructures. J Am Chem Soc. 2007;129:321–327. doi: 10.1021/ja062415b. [DOI] [PubMed] [Google Scholar]
- 45.Niece KL, Hartgerink JD, Donners JJJM, Stupp SI. Self-assembly combining two bioactive peptide-amphiphile molecules into nanofibers by electrostatic attraction. J Am Chem Soc. 2003;125:7146–7147. doi: 10.1021/ja028215r. [DOI] [PubMed] [Google Scholar]
- 46.Silva GA, Czeisler C, Niece KL, Beniash E, Harrington DA, Kessler JA, et al. Selective differentiation of neural progenitor cells by high-epitope density nanofibers. Science. 2004;303:1352–1355. doi: 10.1126/science.1093783. [DOI] [PubMed] [Google Scholar]
- 47.Webber M, Tongers J, Renault M, Roncalli J, Losordo D, Stupp S. Development of bioactive peptide amphiphiles for therapeutic cell delivery. Acta biomaterialia. 2009 doi: 10.1016/j.actbio.2009.07.031. [DOI] [PMC free article] [PubMed] [Google Scholar]
- 48.Storrie H, Guler MO, Abu-Amara SN, Volberg T, Rao M, Geiger B, et al. Supramolecular crafting of cell adhesion. Biomaterials. 2007;28:4608–4618. doi: 10.1016/j.biomaterials.2007.06.026. [DOI] [PubMed] [Google Scholar]
- 49.Ghanaati S, Webber MJ, Unger RE, Orth C, Hulvat JF, Kiehna SE, et al. Dynamic in vivo biocompatibility of angiogenic peptide amphiphile nanofibers. Biomaterials. 2009;30:6202–6212. doi: 10.1016/j.biomaterials.2009.07.063. [DOI] [PMC free article] [PubMed] [Google Scholar]
- 50.Stendahl JC, Wang L-J, Chow LW, Kaufman DB, Stupp SI. Growth factor delivery from self-assembling nanofibers to facilitate islet transplantation. Transplantation. 2008;86:478–481. doi: 10.1097/TP.0b013e3181806d9d. [DOI] [PMC free article] [PubMed] [Google Scholar]
- 51.Bosi E, Lucotti P, Setola E, Monti L, Piatti PM. Incretin-based therapies in type 2 diabetes: a review of clinical results. Diabetes Res Clin Pract. 2008;82 Suppl 2:102–107. doi: 10.1016/j.diabres.2008.10.003. [DOI] [PubMed] [Google Scholar]
- 52.During MJ, Cao L, Zuzga DS, Francis JS, Fitzsimons HL, Jiao X, et al. Glucagon-like peptide-1 receptor is involved in learning and neuroprotection. Nat Med. 2003;9:1173–1179. doi: 10.1038/nm919. [DOI] [PubMed] [Google Scholar]
- 53.Holst JJ, Deacon CF. Inhibition of the activity of dipeptidyl-peptidase IV as a treatment for type 2 diabetes. Diabetes. 1998;47:1663–1670. doi: 10.2337/diabetes.47.11.1663. [DOI] [PubMed] [Google Scholar]
- 54.Greenfield NJ. Using circular dichroism spectra to estimate protein secondary structure. Nat Protoc. 2006;1:2876–2890. doi: 10.1038/nprot.2006.202. [DOI] [PMC free article] [PubMed] [Google Scholar]
- 55.Reed J, Reed TA. A set of constructed type spectra for the practical estimation of peptide secondary structure from circular dichroism. Anal Biochem. 1997;254:36–40. doi: 10.1006/abio.1997.2355. [DOI] [PubMed] [Google Scholar]
- 56.Parkes DG, Pittner R, Jodka C, Smith P, Young A. Insulinotropic actions of exendin-4 and glucagon-like peptide-1 in vivo and in vitro. Metab Clin Exp. 2001;50:583–589. doi: 10.1053/meta.2001.22519. [DOI] [PubMed] [Google Scholar]
- 57.Mao GH, Chen GA, Bai HY, Song TR, Wang YX. The reversal of hyperglycaemia in diabetic mice using PLGA scaffolds seeded with islet-like cells derived from human embryonic stem cells. Biomaterials. 2009;30:1706–1714. doi: 10.1016/j.biomaterials.2008.12.030. [DOI] [PubMed] [Google Scholar]
- 58.Zhang D, Jiang W, Liu M, Sui X, Yin X, Chen S, et al. Highly efficient differentiation of human ES cells and iPS cells into mature pancreatic insulin-producing cells. Cell Res. 2009;19:429–438. doi: 10.1038/cr.2009.28. [DOI] [PubMed] [Google Scholar]
- 59.Egan JM, Bulotta A, Hui H, Perfetti R. GLP-1 receptor agonists are growth and differentiation factors for pancreatic islet beta cells. Diabetes Metab Res Rev. 2003;19:115–123. doi: 10.1002/dmrr.357. [DOI] [PubMed] [Google Scholar]
- 60.Accardo A, Tesauro D, Mangiapia G, Pedone C, Morelli G. Nanostructures by self-assembling peptide amphiphile as potential selective drug carriers. Biopolymers. 2007;88:115–121. doi: 10.1002/bip.20648. [DOI] [PubMed] [Google Scholar]
Associated Data
This section collects any data citations, data availability statements, or supplementary materials included in this article.
Supplementary Materials
Supplementary Figure 1. Nanostructure morphology analyzed by SAXS. Log-log plots of the scattering intensity as a function of scattering vector magnitude generated upon bombardment with a 15 keV x-ray beam with typical incident flux of 1012 photons/s are shown for (a) 5mM GLP-1-mimetic PA in water fit to a cylindrical core-shell model using Igor Pro 6.2 software and (b) 5mM control PA in water with initial slope of −2.3. The model parameters used for fitting are as follows: mean core radius = 1.59nm, radial polydispersity σ = 0.314, core length = 120.7nm, radial shell thickness = 3.31nm, face shell thickness = 3.00 nm, scattering length density of core = 9.36×10⁻⁶ Å−2, scattering length density of shell = 2.30×10⁻⁵ Å−2, scattering length density of solvent = 9.42×10⁻⁶ Å−2.
Supplementary Figure 2. Rheological analysis of PA gels. The storage modulus (G’) and loss modulus (G”) of 8mM PA gels are shown over a range of angular frequencies for a control PA gel and a 10% GLP-1-mimetic PA in control PA gel.