Abstract
In orbital floor fractures, the estimation of the herniated orbital content in the maxillary sinus has traditionally been the dividing line between surgical and nonsurgical management. In this study, we evaluated whether a relative change in volume would function as an indicator for surgical versus nonsurgical treatment of orbital floor fractures. This was a follow-up study in patients with untreated unilateral isolated orbital floor fractures admitted to our department from March 2003 to April 2007. Patients were contacted by regular mail and invited to have a clinical eye examination. The volume of the orbital content was calculated digitally from the patients' computed tomography scans at the time of their injury. Eighteen subjects with no facial skeleton fracture were included for reference of orbital content volumes. Five of 23 patients showed 2 to 4 mm of enophthalmos, and only three of them had intermittent diplopia. No statistical correlation was found between the herniated volume and enophthalmos. No statistical correlation supporting the supposition that 1 mL of herniated orbital content would result in 1 mm of enophthalmos was found. The relative volume change between the fractured and nonfractured orbit in an individual does not appear to be a useful criterion for surgery. The importance of the herniated orbital tissue for the development of enophthalmos is unclear.
Keywords: Orbital floor fracture, blowout fracture, orbital volume, nonsurgical treatment
Fractures involving the orbit are very common in the emergency room. Isolated fractures of the orbital floor are often referred to as a blowout fracture (BOF). Posttraumatic enophthalmos is a well-known sequel that is considered to be related to changes in orbital volume.1,2,3,4 In some cases, the orbital floor fragments are not displaced, and the orbital volume remains unchanged. If there are no other indications for surgery (disturbing double vision, entrapped inferior rectus muscle, or obvious enophthalmos), such a fracture may be left without surgical intervention. However, a BOF usually causes an extensive displacement of bone fragments resulting in an expansion of orbital content into the underlying maxillary sinus (i.e., herniation5). A surgical intervention with reconstruction of the orbital floor has been considered to be necessary by some authors to restore orbital volume and reposition the eye bulb.1,2 A dividing line between surgical and nonsurgical management traditionally has been the estimated volume of the herniated orbital content into the maxillary sinus.2 Thus, it is mentioned that a 0.8- to 1-cm3 herniation will result in an enophthalmos of 1 mm.2,6 Accordingly, a 1.6- to 2-cm3 herniation will result in a 2-mm enophthalmos.7 Such volume estimations are made from computed tomography (CT).8,9
In the nonherniated and the severely herniated cases, treatment is not debated. Generally, a herniation with a volume of >1.5 cm3 is considered to be an indication for surgical reconstruction of the orbital floor.1 However, even in these cases evidence from randomized controlled studies is lacking. Clinically, the problematic cases are those with a herniation just less than 1.5 cm3 where the risk of surgical sequelae arising10 has to be evaluated against the risk of the patient developing posttraumatic enophthalmos,1,4,11,12 if the fracture is left unoperated. Another important question in orbital floor fractures is whether pure volume change is a proper indication for surgery.13 One cubic millimeter herniation in a large person may be quite different than a similar herniation in a smaller person, if the herniation volume is compared with the total orbital volume.14
The aims of the present study were twofold: partly to evaluate whether the decision to refrain from surgery based on a herniated volume of <1.5 cm3 in a series of patients was correct, and partly to evaluate whether the relative change in orbital volume would be a better indicator for surgical versus nonsurgical treatment of BOF. Furthermore, we introduce a new method of calculating orbital volume and herniation.
MATERIALS AND METHODS
From the patient records in the Ear, Nose, and Throat department at the Karolinska University Hospital, patients were selected who had an isolated, untreated unilateral fracture of the orbital floor, diagnosed using a CT scan. The decision to refrain from surgery of the orbital floor fracture had been taken on the basis of the volume of the herniated orbital content, usually between 1.0 and 1.5 mL. From March 2003 to April 2007, 89 patients had met these criteria. They were all contacted by regular mail. In the letter, they were invited to have a clinical eye examination at the St. Erik Eye Hospital in Stockholm, Sweden. A control group of 18 subjects who had undergone CT examination of the facial skeleton for reasons other than orbital fracture were included for reference. The study was approved by the Local Ethics Committee at the Karolinska Institute.
The patients reported their impression of the eye bulb position and the presence of double vision or symptoms related to their eyes and vision. The clinical examination included an examination for diplopia and measurement of enophthalmos according to Hertel.15
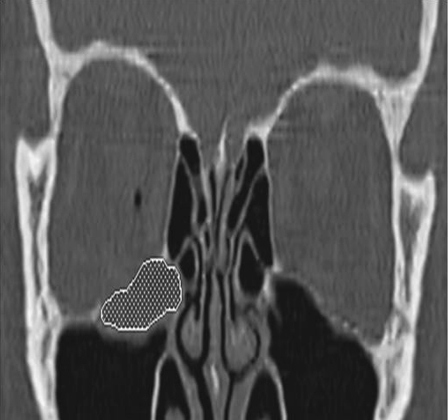
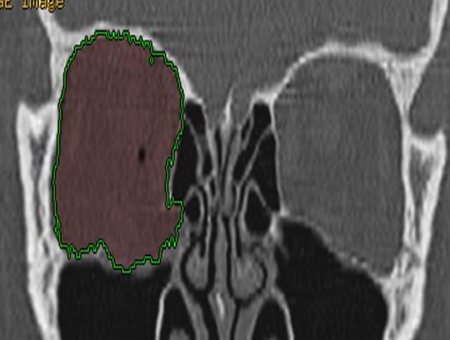
The volume of the orbital content was calculated digitally from the patients' CT scans at the time of their injury. The CT scans used ≤2-mm slices. On the fractured side, the volume (in milliliters) of the herniation (Fig. 1) and the volume of the orbit including the herniation (Fig. 2) were measured. The herniated orbital soft tissue was defined as the displaced orbital content, including orbital fat and muscle, truly herniating through the fracture of the orbital floor into the maxillary sinus, excluded the hematoma. The orbital volume on the nonfractured side was also measured for calculating the relative volume difference. The orbital volumes of the control group, who had no previous facial fractures, were measured using the same method described. These measurements were used to estimate the individual variability of orbital volumes in normal individuals.
Figure 1.
The volume of the herniated orbital content.
Figure 2.
Volume of the orbital content including the herniated orbital volume.
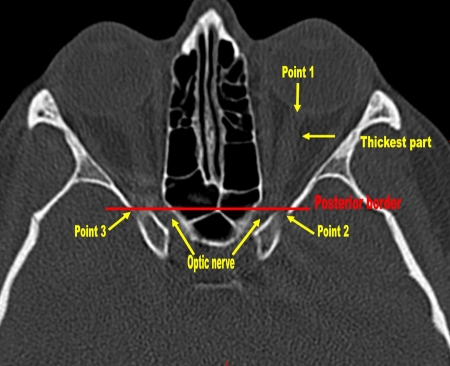
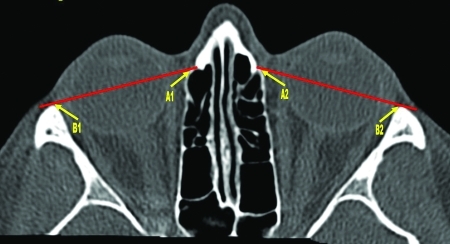
To facilitate repetitive volume measurements, a standardized method of defining the orbital borders was created by defining three distinct anatomic landmarks on the CT scan. These were: (1) posterior—in the central portion of the optic nerve at the level of the lateral edge of the superior orbital fissure (Fig. 3); (2) anterior/nasal—the most distinct and widest laterodorsal duct of the lacrimal canal bilaterally (Fig. 4); (3) anterior/temporal—the most anterior portion of the lateral orbital limit (Fig. 4). The volume of the orbit was calculated craniocaudally inside the bony orbital borders within these three points. (See Appendix for details.)
Figure 3.
The posterior border in orbital volume measurements. Point 1, the exit of the optic nerve from the eye globe. Points 2 and 3 are the lateral edges of the superior orbital fissure on each side.
Figure 4.
The anterior border in the orbital volume measurements. A1 and A2, the most distinct and widest laterodorsal duct of the lacrimal canal; B1 and B2, the lateral orbit limit.
CT images were all entered into a GE Healthcare Advantage Workstation version 4 (GE Healthcare, Milwaukee, WI). The orbital volume was measured with the rendering software in the Volume Viewer version 2.0 (GE Healthcare). (See Appendix for details.)
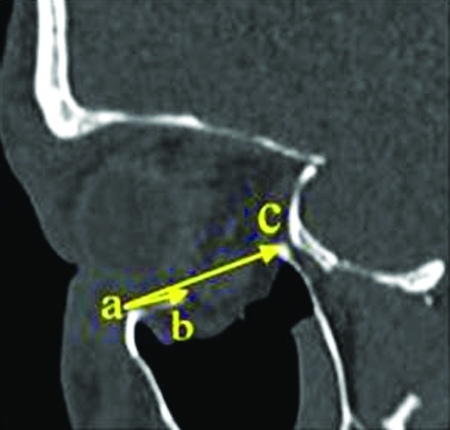
The localization of the fracture was measured on the sagittal CT slice where the fracture was considered largest. The distance from the infraorbital margin to the anterior and the posterior part of the fracture was measured (Fig. 5).
Figure 5.
Sagittal computed tomography slice where the fracture is considered largest. (A) Infraorbital margin, (B) anterior, and (C) the posterior part of the fracture.
The data were organized in MS Excel and analyzed with the StatSoft, Inc. (2007) STATISTICA data analysis software system, version 8.0 (www.statsoft.com). A correlation analysis was performed on the orbital measurements and the ophthalmologic data to determine the coefficient of determination (r2). To evaluate the reproducibility of the measured orbital volumes, two people separately calculated the orbital volumes using the same method. The intraclass correlation coefficient (ICC) was derived from a two-way mixed-effects model.
RESULTS
Eighty-nine patients were contacted and 43 (48%) responded. Twenty of those were excluded: two appeared to have had a medial orbital wall fracture instead of an orbital floor fracture, and 12 had been scanned with CT slices thicker than 2 mm. Finally, six individuals did not show up for the examination. Thus, 23 individuals were included in the study. There were 19 men and 4 women. They had a mean age of 41 (17 to 74). The mean time from injury to examination was 22 months (6 to 46). The CT scans of the patients were performed within 1.9 days1,2,5,6,7,8,10 after the injury.
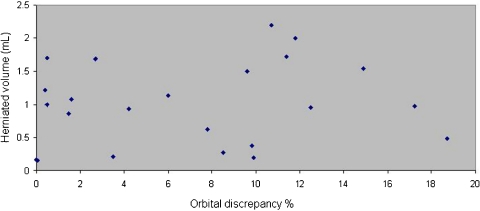
The mean herniated volume was 1.0 mL (0.2 to 2.2). The relative volume difference between the fractured and the nonfractured orbit was 1.4 mL (0 to 3.4) or in percentage terms 8.6% (0 to 18.7%; Table 1). The corresponding relative mean volume difference in the control group was 0.6 mL (0.1 to 1.4) and 2.5% (0.5 to 6.1%; Table 2). The correlation between herniated orbital volume and the relative orbital volume difference between orbits was found to be poor (Fig. 6). The relative difference in orbital volumes were significantly different between the two groups (p = 0.049; Mann-Whitney U test).
Table 1.
Summary of Clinical and CT Scan Findings
| Patient | Diplopia | Note to Diplopia | Enophthalmos (mm) | Herniated Volume (mL) | Relative Orbital Volume Difference (%) | The Distance from Infraorbital Margin to the Posterior Part of the Fracture |
|---|---|---|---|---|---|---|
| 1 | No | No | 0.4 | 9.8 | 15.5 | |
| 2 | No | 1 | 0.2 | 9.9 | 18.3 | |
| 3 | No | No | 1 | 12.5 | 21.8 | |
| 4 | No | No | 0.2 | 0 | 23.9 | |
| 5 | No | No | 1.2 | 0.4 | 24.1 | |
| 6 | Yes | Pretrauma | 2 | 0.3 | 8.5 | 20.2 |
| 7 | No | No | 1.1 | 6 | 21.5 | |
| 8 | No | 1 | 0.2 | 3.5 | 29.1 | |
| 9 | Yes | Posttrauma | 2 | 1 | 0.5 | 24.3 |
| 10 | No | No | 0.2 | 0.05 | 22.4 | |
| 11 | Yes | Pretrauma | No | 1.7 | 0.5 | 23.3 |
| 12 | No | No | 2 | 11.8 | 27.3 | |
| 13 | Yes | Posttrauma | 1 | 1.7 | 11.4 | 29.3 |
| 14 | No | 2 | 1.7 | 2.7 | 27.6 | |
| 15 | No | 2 | 2.2 | 10.7 | 31.8 | |
| 16 | No | No | 0.5 | 18.7 | 20.6 | |
| 17 | No | No | 1.1 | 1.6 | 24.1 | |
| 18 | No | No | 0.6 | 7.8 | 20.8 | |
| 19 | Yes | Posttrauma | 4 | 1.5 | 9.6 | 35 |
| 20 | Yes | Pretrauma | No | 1 | 17.2 | 32 |
| 21 | Yes | Pretrauma | No | 1.6 | 14.9 | 26 |
| 22 | No | 1 | 1 | 4.2 | 16.9 | |
| 23 | Yes | Posttrauma | No | 1 | 1.5 | 20.7 |
CT, computed tomography.
Table 2.
Orbital Volumes of the Control Group
| Right Orbit (mL) | Left Orbit (mL) | Orbital Difference (%) |
|---|---|---|
| 21.3 | 22.7 | 6.6 |
| 20.6 | 20.2 | 2.0 |
| 19.5 | 19.7 | 1.0 |
| 21.0 | 21.3 | 1.4 |
| 21.0 | 21.3 | 1.4 |
| 19.2 | 18.9 | 1.6 |
| 22.0 | 21.7 | 1.4 |
| 22.0 | 21.7 | 1.4 |
| 19.3 | 20.3 | 5.2 |
| 21.1 | 20.9 | 1.0 |
| 24.7 | 25.6 | 3.6 |
| 23.8 | 22.5 | 5.8 |
| 19.6 | 20.0 | 2.0 |
| 21.0 | 20.8 | 1.0 |
| 20.1 | 20.9 | 4.0 |
| 20.2 | 20.8 | 3.0 |
| 17.7 | 18.6 | 5.1 |
| 19.8 | 19.7 | 0.5 |
Figure 6.
Orbital discrepancy % (x) by herniated volume mL (y).
The analysis of the reproducibility of the orbital volume measurements by the two investigators revealed a mean value of the differences between the operators as 0.259 (standard deviation 1.397). The ICC, evaluated by a two-way mixed-effects model, was 0.822 (95% confidence interval from 0.700 to 0.898; Fig. 7).
Figure 7.
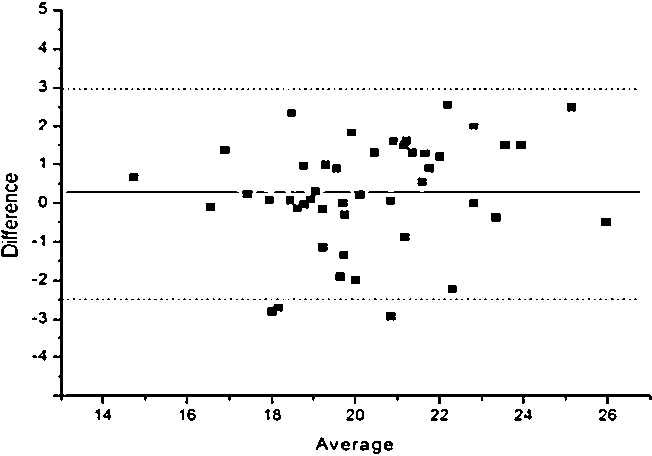
The analysis of the reproducibility of the orbital volume measurements. Mean value of the differences between the operators was 0.259 (standard deviation 1.397).
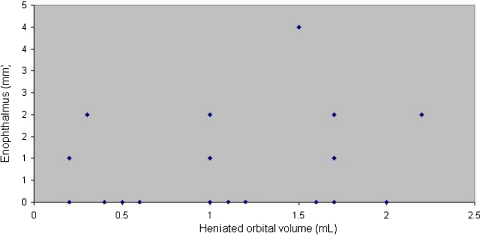
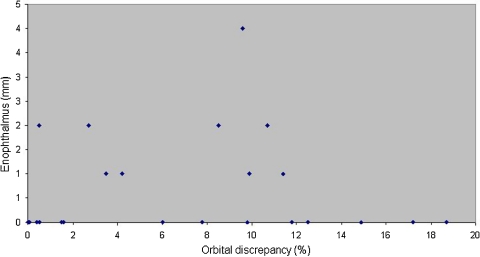
Five of the 23 patients presented with an enophthalmos mean of 2 mm.2,5,6 The mean herniated volume in these cases was 1.3 mL (0.3 to 2.2). There was no correlation between the herniated volume and the degree of enophthalmos (r2 value; Fig. 8). We did not find that large relative changes in orbital volume in orbital fractures correlated with posttraumatic enophthalmos (Fig. 9). Eight patients experienced an intermittent diplopia, and four of those could be related to their orbital floor fracture. For details, see Table 1.
Figure 8.
Herniated orbital volume (x) by enophthalmos (y).
Figure 9.
Orbital discrepancy (x) by enophthalmos (y).
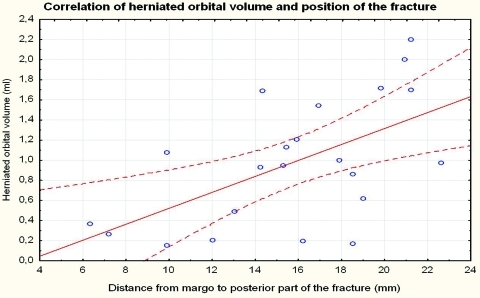
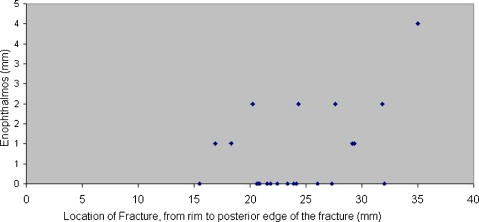
The mean distance from the infraorbital margin to the anterior part of the fracture was 7.8 mm (2.0 to 17.1) and to the posterior part of the fracture, 23.0 mm (16.9 to 35.0). A correlation analysis of the orbital volume (y) of the fractured orbit and the localization of the fracture (x) was performed that showed a weak (r2 = 0.25) but significantly (p < 0.001) increased risk of larger herniation in fractures that extend more posteriorly (Fig. 10). One plausible explanation for this might be that the distance from margo to the posterior location of the fractures is longer in larger orbits (r2 = 0.30; p < 0.01). The longer and larger an orbit is, the more likely to lead to a larger herniation. Two measurements (in millimeters) of the fracture localization were evaluated from the CT scan (i.e., the distance from the margin to the anterior and the posterior part of the fracture; Table 1). The analysis revealed a positive correlation between the orbital volume and the posterior localization of the fracture (r2 = 0.50; p < 0.05). Two of five patients with enophthalmos had posteriorly extended fractures 31.8 and 35.0 mm (Fig. 11). Only one patient (No. 19) in the study group was cosmetically discomforted by the enophthalmos, which measured 4 mm.
Figure 10.
Correlation of herniated orbital volume and position of the fracture. Distance from margo to posterior part of the fracture (x) by herniated orbital volume (y).
Figure 11.
Location of fracture from rim to the posterior edge of the fracture (x) by enophthalmos (y).
DISCUSSION
In this study, we did not find any correlation between large changes in orbital volume and enophthalmos, nor did we did not find any statistical correlation between the herniated volume and enophthalmos. Additionally, in this study, we propose a new method for calculating the volume of the orbit and the herniated volume.
Earlier studies suggest that in a fractured orbital floor, an 18 to 20% expansion of the bony orbital volume compared with the unfractured orbit could be a criterion for surgery due to an increased risk of enophthalmos and subsequent diplopia.1,14,16 In our study, the only patient (No. 16 in Table 1) who met this criterion of 18 to 20% volume expansion did not develop enophthalmos. However, there were still five patients who developed enophthalmos (mean 2 mm). Patient No. 19 in Table 1 had an orbital volume difference of 9.6% and developed a 4-mm enophthalmos. This indicates that the volume difference alone is an insufficient criterion for surgery. The hypothesis of an 18% expansion is the result of a retrospective study of 16 patients and therefore is of limited value.1
Earlier studies suggest that 1 mL of herniated orbital content would be followed by 1 mm of enophthalmos.2,6,14 However, we did not find any statistical correlation between the herniated volume and enophthalmos (r2 value). Six patients had herniated volumes of ≥1.5 mL, which is a current criterion for surgery. Three of six patients with larger herniated volumes did not develop enophthalmos. We observed that two of the patients who did develop enophthalmos (patients 15 and 19 in Table 1) had a posteriorly extended fracture compared with that of the patients with no enophthalmos. Our finding, therefore, is that the volume of herniation, as suggested in earlier studies,1,14,17 is a questionable tool in the evaluation of patients with orbital floor fractures and that the location of the fracture and herniation may be more important than the actual volume. The probability of having a more posterior fracture localization seems to increase with a larger orbital volume.
Our finding that the correlation between relative orbital volume difference between orbits and the herniated orbital volume was poor might be explained by the hematoma in the maxillary sinus attached to the orbital soft tissue, which could be challenging to differ when measuring the orbital volumes. In the current study, only the volume of orbital and the herniated orbital soft tissue were measured.
Interestingly, several patients with a large herniated volume were underestimated by the radiologist at the initial calculation of the herniated volume. The radiologists usually measure the herniated orbital volume by calculating the length × width × height of the herniation. In collaboration with our radiologist, we suggest a new method of calculating the herniated volume using a computer-assisted soft tissue algorithm (see Appendix). In the control group, the relative volume difference between the orbits was 0.6 mL (0.1 to 1.4) and in percentage terms 2.5% (0.5 to 6.1%; Table 2), which is in accordance to earlier studies.8,11 This indicates that the accuracy of our proposed method in measuring the orbital volumes is likely high and applicable in orbital volume measurement. The accuracy of the method needs to be validated.
Intermittent diplopia can be seen in the normal population with latent strabismus but the prevalence is unknown. In our study, 8 of 23 patients had intermittent diplopia (Table 1). We found that the diplopia in 50% of the patients was related to latent heterophoria (strabismus) rather than enophthalmos according to ophthalmologic examinations. The relative orbital volume change in patients with enophthalmos was 6.5%. Patients who did not develop enophthalmos had similar volume changes (6.4%). The contribution of enophthalmos to patients' diplopia development is unclear.
The strengths of our study are that we have introduced a new, more accurate method for calculating the volume of the orbit and orbital herniation with a high reproducibility. The CT scans we have used are ≤2-mm slices. Acceptable reliability was found for most orbital volume measurements for group comparison (ICC above 0.70) but not for individual comparisons (ICC between 0.90 and 0.95).
The weakness of our study is that it is retrospective. Eighty-nine patients were contacted via mail and only 48% (43 patients) responded and subsequently 20 patients were excluded due to medial orbital fractures or CT slices >2 mm, which left 23 patients being included. However, only a few studies have been performed,2,17,18 and they have included fewer patients, except one.19
In conclusion, we have found that the relative volume change in the orbit or the herniated volume following an orbital fracture may be an insufficient criterion for surgery and that additional prospective controlled studies are required to evaluate the importance of the location of the fracture and the herniation as well as the mechanism of diplopia seen in some patients with orbital floor fractures.
APPENDIX
The Measurement of the Orbital Volume
Starting on the uninjured side on the axial CT slices, the optic nerve in the orbital channel was centered at its thickest (Fig. 3). The optic nerve's exit from the eye globe was marked with the cursor/red point as Point 1 (Fig. 3). In “Oblique” with a Fixing Point 1 as the center, the foramen opticus on both sides were centralized as widest. The lateral edge of the superior orbital fissure on the uninjured side was marked as Point 2 and the same structure on the contralateral side was marked as Point 3 (Fig. 3). Points 1, 2, and 3 together constituted a fixing platform during the rest of the volume calculation.
The posterior border was defined by eliminating the structures behind the line between the Points 2 and 3 (Fig. 3). To define the anterior border, in the same plane, the picture was scrolled to its widest and most distinct point of the lacrimal channel bilaterally and marked as Points A1 and A2 (Fig. 4). The lateral orbital limits were marked bilaterally as Points B1 and B2 (Fig. 4). The anterior borders were formed by eliminating the structures anterior to A1-B1 and A2-B2 (Fig. 4).
The volume of the orbital content was then measured by using the VR tools. Starting on the uninjured orbit on an axial slice cranially, the following steps were taken: clicking on “VR tools”; “Add structure”; “Clear Destination”; the orbital content was marked with the mouse and left-clicked so that the area of interest was colored green. Then the slice was scrolled three to four steps caudally and the same procedure was performed until all the orbital content of interest was colored green. If any structure of no interest was colored green by mistake, the “Remove Structure” key was selected, and the areas were marked with the mouse by clicking the left button.
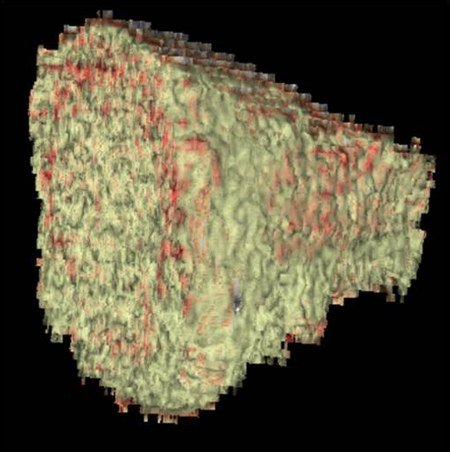
When the axial slices were completed, we moved to the coronal and then to sagittal slices and the same procedure was repeated (Fig. 12). To see the volume of the marked orbital content, “Display Tools” was clicked; the “Globe” key was selected and the marked orbital content was clicked. To exclude the bone structure, which may have been added, the “Threshold” was set between 0 and 200. Then by clicking on “Apply,” the volume of the orbital appeared on the screen (Fig. 13). To calculate the content of the other orbit, the “Apply” key was clicked, then “Undo Apply T”; “3D tools”; “Auto Select”; “Clear Destination” before repeating the same steps to measure the contralateral orbit content.
Figure 12.
Content of the orbit marked for the volume measurement: (A) axial slide, (B) coronal slide, (C) sagittal slide.
Figure 13.
The orbital volume.
The volume of herniated orbital soft tissue was measured as follows. The herniated orbital soft tissue was defined as orbital tissue herniated from the fracture edges of the orbital floor into the maxillary sinus. The hematoma underneath the herniated orbital soft tissue in the maxillary sinus was not included. The volume of the herniated orbital soft tissue was then measured by using the VR tools. Starting on the coronal slices, the herniated orbital soft tissue was marked anteriorly, and the following steps were taken: clicking on “VR tools”; “Add structure”; “Clear Destination”; the orbital content was marked with the mouse and left-clicked so that the area of interest was colored green. Then the slice was scrolled three to four steps posteriorly, and the same procedure was performed until all the orbital content of interest was colored green. If any structure of no interest, for example, hematoma, was colored green by mistake, the “Remove Structure” key was selected and the areas were marked with the mouse by clicking the left button (Fig. 1). When the coronal slices were completed, we moved to the axial and sagittal slices and the same procedure was repeated. To see the volume of the marked orbital content, “Display Tools” was clicked; the “Globe” key was selected, and the marked orbital content was clicked. To exclude the bone structure, which may have been added, the “Threshold” was set between 0 and 200.
References
- Manson P N, Grivas A, Rosenbaum A, Vannier M, Zinreich J, Iliff N. Studies on enophthalmos: II. The measurement of orbital injuries and their treatment by quantitative computed tomography. Plast Reconstr Surg. 1986;77:203–214. [PubMed] [Google Scholar]
- Lee J W, Chiu H Y. Quantitative computed tomography for evaluation of orbital volume change in blow-out fractures. J Formos Med Assoc. 1993;92:349–355. [PubMed] [Google Scholar]
- Tong L, Bauer R J, Buchman S R. A current 10-year retrospective survey of 199 surgically treated orbital floor fractures in a nonurban tertiary care center. Plast Reconstr Surg. 2001;108:612–621. doi: 10.1097/00006534-200109010-00003. [DOI] [PubMed] [Google Scholar]
- Bite U, Jackson I T, Forbes G S, Gehring D G. Orbital volume measurements in enophthalmos using three-dimensional CT imaging. Plast Reconstr Surg. 1985;75:502–508. doi: 10.1097/00006534-198504000-00009. [DOI] [PubMed] [Google Scholar]
- Koornneef L. Current concepts on the management of orbital blow-out fractures. Ann Plast Surg. 1982;9:185–200. doi: 10.1097/00000637-198209000-00001. [DOI] [PubMed] [Google Scholar]
- Fan X, Li J, Zhu J, Li H, Zhang D. Computer-assisted orbital volume measurement in the surgical correction of late enophthalmos caused by blowout fractures. Ophthal Plast Reconstr Surg. 2003;19:207–211. doi: 10.1097/01.iop.0000062848.26273.e5. [DOI] [PubMed] [Google Scholar]
- Ploder O, Klug C, Voracek M, Burggasser G, Czerny C. Evaluation of computer-based area and volume measurement from coronal computed tomography scans in isolated blowout fractures of the orbital floor. J Oral Maxillofac Surg. 2002;60:1267–1272. discussion 1273–1274. doi: 10.1053/joms.2002.35722. [DOI] [PubMed] [Google Scholar]
- McGurk M, Whitehouse R W, Taylor P M, Swinson B. Orbital volume measured by a low-dose CT scanning technique. Dentomaxillofac Radiol. 1992;21:70–72. doi: 10.1259/dmfr.21.2.1397459. [DOI] [PubMed] [Google Scholar]
- Forbes G, Gehring D G, Gorman C A, Brennan M D, Jackson I T. Volume measurements of normal orbital structures by computed tomographic analysis. AJR Am J Roentgenol. 1985;145:149–154. doi: 10.2214/ajr.145.1.149. [DOI] [PubMed] [Google Scholar]
- De Riu G, Meloni S M, Gobbi R, Soma D, Baj A, Tullio A. Subciliary versus swinging eyelid approach to the orbital floor. J Craniomaxillofac Surg. 2008;36:439–442. doi: 10.1016/j.jcms.2008.07.005. [DOI] [PubMed] [Google Scholar]
- Whitehouse R W, Jackson A. Measurement of orbital volumes following trauma using low-dose computed tomography. Eur Radiol. 1993;3:145–149. [Google Scholar]
- Pearl R M. Surgical management of volumetric changes in the bony orbit. Ann Plast Surg. 1987;19:349–358. doi: 10.1097/00000637-198710000-00011. [DOI] [PubMed] [Google Scholar]
- Carls F R, Schuknecht B, Sailer H F. [Orbital volumetry as a planning principle for reconstruction of the orbital wall] (in German) Fortschr Kiefer Gesichtschir. 1994;39:23–27. [PubMed] [Google Scholar]
- Lee J W, Chiu H Y. Quantitative computed tomography for evaluation of orbital volume change in blow-out fractures. J Formos Med Assoc. 1993;92:349–355. [PubMed] [Google Scholar]
- Cole H P, III, Couvillion J T, Fink A J, Haik B G, Kastl P R. Exophthalmometry: a comparative study of the Naugle and Hertel instruments. Ophthal Plast Reconstr Surg. 1997;13:189–194. [PubMed] [Google Scholar]
- Tahernia A, Erdmann D, Follmar K, Mukundan S, Grimes J, Marcus J R. Clinical implications of orbital volume change in the management of isolated and zygomaticomaxillary complex-associated orbital floor injuries. Plast Reconstr Surg. 2009;123:968–975. doi: 10.1097/PRS.0b013e318199f486. [DOI] [PubMed] [Google Scholar]
- Ploder O, Oeckher M, Klug C, et al. Follow-up study of treatment of orbital floor fractures: relation of clinical data and software-based CT-analysis. Int J Oral Maxillofac Surg. 2003;32:257–262. doi: 10.1054/ijom.2003.0366. [DOI] [PubMed] [Google Scholar]
- Hartmann N, Haase W. Isolated orbital floor fractures: a long-term follow-up with respect to early or late surgery or no surgery at all. Orbit. 1986;5:273–277. [Google Scholar]
- Putterman A M, Stevens T, Urist M J. Nonsurgical management of blow-out fractures of the orbital floor. Am J Ophthalmol. 1974;77:232–239. doi: 10.1016/0002-9394(74)90679-5. [DOI] [PubMed] [Google Scholar]


