

Abstract
Objective
The objective of this study was to assess relations between fine and gross motor development and spoken language processing skills in pediatric cochlear implant users. Study Design: The authors conducted a retrospective analysis of longitudinal data.
Methods
Prelingually deaf children who received a cochlear implant before age 5 and had no known developmental delay or cognitive impairment were included in the study. Fine and gross motor development were assessed before implantation using the Vineland Adaptive Behavioral Scales, a standardized parental report of adaptive behavior. Fine and gross motor scores reflected a given child’s motor functioning with respect to a normative sample of typically developing, normal-hearing children. Relations between these preimplant scores and postimplant spoken language outcomes were assessed.
Results
In general, gross motor scores were found to be positively related to chronologic age, whereas the opposite trend was observed for fine motor scores. Fine motor scores were more strongly correlated with postimplant expressive and receptive language scores than gross motor scores.
Conclusions
Our findings suggest a disassociation between fine and gross motor development in prelingually deaf children: fine motor skills, in contrast to gross motor skills, tend to be delayed as the prelingually deaf children get older. These findings provide new knowledge about the links between motor and spoken language development and suggest that auditory deprivation may lead to atypical development of certain motor and language skills that share common cortical processing resources.
Keywords: Behavioral assessment, motor development, children, deaf, cochlear implant, individual differences, audiologic outcome
INTRODUCTION
In young infants and children, both motor development and language acquisition proceed in a predictable fashion with normalized behavioral “milestones” widely reported and accepted.1 These milestones have been found to be correlated across processing systems: the emergence of specific language milestones coincides with specific motor milestones.1 In addition, early motor development has been shown to be a good predictor of language development later in childhood.2 These observed relations lead to the conclusion that independent motor and language systems are both subject to the same biologic, genetically driven processes of maturation and differentiation.1,3
However, recent research from developmental science has challenged the view that motor and language systems are independent. An emerging view known as “embodied cognition” suggests that perceptual-motor and cognition are not separate independent systems, but are processes that reflect the operation of highly integrated and interconnected brain/body systems.4 In the present study, this new theoretical framework is applied to a unique clinical population: prelingually deaf children who use cochlear implants (CIs).
Prelingually deaf children experience a delay in useful auditory input before implantation and are initially delayed in a range of spoken language skills.5,6 Furthermore, there is some evidence that hearing-impaired children also demonstrate atypical performance on a range of motor skills, including balance, eye-hand coordination, running, and throwing, compared with age-matched control children.7,8 However, the earlier studies of motor development in deaf children had several confounding factors that may have been responsible for the delayed motor skills in the deaf population. First, these previous studies included children with neurologic sequelae from etiologies of deafness such as central nervous system infection that may directly explain motor delay. Second, the relatively late age at diagnosis/intervention of the deaf children included in these studies may have contributed to the motor delays detected in deaf children. With the advent of universal newborn hearing screening programs, most prelingually deaf children who present for a CI today have been identified and receive intervention much earlier than the children tested previously. Finally, earlier studies included children from residential schools for the deaf who used American sign language. The majority of prelingually deaf children implanted today are immersed in oral only or oral and manual English environments. Thus, the earlier reports of atypical motor development in hearing-impaired children cannot be generalized to the population of prelingually deaf children who present for a CI.
Several recent studies have explored the issue of whether motor development is atypical in prelingually deaf children with CIs. Before implantation, overall motor skills of prelingually deaf infants and children do not appear to be atypical compared with normal-hearing children. In one study, Kutz et al. measured fine and gross motor skills in 17 young infants and children who presented for CI surgery using a standardized caregiver report.9 These children were all profoundly deaf and had received little benefit from hearing aids. The authors reported that standard scores for motor skills fell within the typical range of variation found in normal-hearing infants. Their initial findings were recently replicated in our laboratory with a larger sample of prelingually deaf infants and children who were given the same motor measure before cochlear implantation.10
However, as these children become older, they may begin to show delays in motor development even with a CI. Schlumberger et al. measured motor skills in three groups of 5- to 9-year-old children: normal-hearing children, profoundly deaf children who had used a CI for several years, and profoundly deaf children who had used a hearing aid for several years.11 The authors reported a three-way interaction among population, age, and type of motor task. All three groups performed similarly on the simple motor tasks across all ages. However, for 7- to 9-year-old children, both deaf groups demonstrated poorer performance than the normal-hearing controls on complex motor tasks. Complex motor task performance in the 5- to 7-year-olds was equivalent across the three groups.11
One reason that the studies of preimplant motor skills by Kutz et al. and Horn et al. did not show evidence for delays in motor development was that these studies used a coarse measure of motor development that reflected a wide range of behaviors. In particular, the scores from the parental report in these studies reflected overall motor skills and did not distinguish between fine/gross or complex/simple motor behaviors. This is a limitation that we addressed in the present study.
The first question we examined was whether gross or fine motor skills, when assessed separately in prelingually deaf children before implantation, show evidence of a developmental divergence. One hypothesis was that fine motor skills, more conceptually linked to the “complex motor skills” assessed by Schlumberger et al., would be delayed relative to the gross motor skills in these children. A second hypothesis was that fine motor skills would be negatively related to length of auditory deprivation: older deaf participants with longer periods of auditory deprivation would show lower standardized fine motor scores than younger deaf participants. A third hypothesis was that gross motor skills would show no relation to length of auditory deprivation. A cross-sectional, correlational design was used to test these three hypotheses.
The second question addressed in this study was whether preimplant fine or gross motor skills were predictive of spoken language outcomes in prelingually deaf children. In an earlier paper, Horn et al. reported that children with higher preimplant general motor development scores showed greater performance than children with lower preimplant motor scores on postimplant measures of word recognition, receptive and expressive language, and vocabulary knowledge. In the present study, fine and gross motor skills were analyzed independently using a series of correlational analyses with postimplant spoken language scores. We hypothesized that preimplant fine motor skills would be more strongly correlated with postimplant spoken language skills than gross motor skills.
The overall goal of the present study was to explore the links between motor skills and the development of spoken language and establish that they are not generally related, but are linked in specific, process-driven ways. Furthermore, confirmation of these hypotheses would suggest that common cortical mechanisms govern both the fine motor control of the body and the perceptual and linguistic processes involved in spoken language. Such findings would be consistent with predictions from embodied cognition that the mind and body are closely linked and coordinated in development.
METHODS
Participants
Institutional Review Board approval was first obtained for a retrospective study of longitudinal data collected in the DeVault Otologic Research Laboratory Cochlear Implant Project. Inclusion criteria for the study were: bilateral severe or profound hearing loss diagnosed by age 3 years, preimplant testing conducted before age 6 years, and consent to participate in retrospective studies. Twenty-three infants and children were identified from the pediatric CI database who fit these criteria. One participant was excluded as a result of a known diagnosis of developmental delay and sensorimotor impairment. The demographic characteristics of the remaining 22 infants and children are summarized in Table I.
TABLE I.
Demographic Characteristics of the Sample.
| Mean unaided pure-tone average (decibels of hearing loss) |
104.1, SD = 19.4.9 | Range: 58.3–118.4 |
| Mean age of onset (months) |
0.5, SD = 1.8 | Range: 0–6.0 |
| Mean age at pre-CI evaluation (months) |
22.0, SD = 13.7 | Range: 6.0–51.0 |
| Mean length of deprivation (months) |
28.5, SD = 13.8 | Range: 10.0–54.0 |
| Mean age of CI activation (months) |
28.2, SD = 13.8 | Range: 10.0–54.0 |
| Mode of communication (CM) |
9 OC, 13 TC | |
| Gender | 6 females, 16 males | |
| Etiology | 19 congenital: 16 unknown, 1 genetic, 1 large vestibular aqueduct syndrome, 1 auditory neuropathy |
|
| 3 acquired: 1 meningitis at 6 months, 1 ototoxicity at 6 months 1 perinatal cytomegalovirus infection |
||
Note: pure-tone average = average decibels of hearing loss threshold at 500, 1,000, and 2,000 Hz. Age of hearing loss was estimated from age at diagnosis and clinical history.
CI = cochlear implant; SD = standard deviation.
Procedures and Measures
Preimplant motor development was assessed in all participants using the Vineland Adaptive Behavioral Scales (VABS).12 The motor domain of the VABS consists of 36 statements describing specific gross and fine motor behaviors. Gross motor items describe behaviors relating to general balance, postural control, and walking, whereas fine motor items describe manual behaviors. Sample items are listed in Table II. The VABS was administered by a clinical psychologist in a structured interview format. Caregivers respond to each statement based on whether the child exhibits the behavior consistently, occasionally, or not at all. Raw scores were tallied from the total number of gross and fine motor behaviors and then converted into an age-equivalent score for each domain based on normative data obtained from 3,000 normal-hearing, typically developing children.12 For each child, two age-equivalent scores were obtained, one for fine motor age equivalent and one for gross motor age equivalent. Each age-equivalent score represents a child’s developmental age for fine or gross motor skills based on their observed behaviors.
TABLE II.
Some Sample Items From the Vineland Motor Domain.
| Gross Motor | Fine Motor |
|---|---|
| Sits supported for at least 1 minute |
Picks up small object with hands in any way |
| Rolls ball while sitting | Transfers object from one hand to the other |
| Walks as a primary means of getting around |
Opens doors that require only pushing or pulling |
| Climbs on low play equipment |
Opens doors by turning and pulling doorknobs |
| Walks up stairs, putting both feet on each step |
Screws and unscrews lid of jar |
| Jumps over small object | Opens and closes scissors with one hand |
| Climbs on high play equipment |
Cuts paper along a line with scissors |
| Hops forward on one foot with ease |
Cuts out complex items with scissors |
As a result of the wide range of ages in our sample, we normalized each age-equivalent score for chronologic age as follows. Age-equivalent scores were divided by the chronologic age of the child at preimplant testing to obtain gross and fine motor age-ratio scores (gross-r or fine-r). Gross-r and fine-r were used in the subsequent analyses as the dependent measures of motor development. Gross-r or fine-r scores greater than 1.0 reflected advanced behavioral development relative to the normative chronologic age, whereas scores less than 1.0 reflected delayed development relative to chronologic age. Although we recognize certain limitations of scores based on age-equivalent measures, namely, that the variance of the normative population is unknown, these scores can provide a meaningful index of age-related development provided that they are used appropriately.
Several measures of spoken language processing, collected longitudinally at various times after implantation, were available for a subset of these children. Three measures were selected based on their age appropriateness and availability in the study sample. The Grammatical Analysis of Elicited Language (GAEL-P) was used to assess closed-set spoken word recognition.13 Children were initially familiarized with 30 objects presented and named using audiovisual presentation. During testing, sets of four familiarized objects were presented and a target object name was presented live voice, auditory-only by the experimenter. Children were given a correct score if they chose the named object.
Receptive and expressive language skills were assessed with the Reynell Developmental Language Scales 3rd edition.14 The receptive scales (RDLS-rec) measure 10 different skills, including spoken word recognition, sentence comprehension, and verbal comprehension of ideational content. The expressive scales (RDLS-exp) assess skills such as spontaneous production of speech and picture description. The RDLS-rec and RDLS-exp scales were administered in the child’s preferred communication mode.
Vocabulary knowledge was measured with the Peabody Picture Vocabulary Test (PPVT).15 In this closed-set, forced-choice test, children were presented with a vocabulary item by their preferred mode of communication. Children then chose from four pictures, one of which correctly corresponded to the meaning of the word. Experienced clinicians administered each of the four tests in a quiet, well-lit room.
Statistical Analyses
The first hypothesis, that fine motor skills would be delayed relative to gross motor skills in prelingually deaf children, was assessed using a paired-samples t test with VABS motor domain (gross-r or fine-r) as the independent variable. The first hypothesis predicted that gross-r scores would be higher, on average, than fine-r scores. The second hypothesis, that gross and fine motor skills would differ in their relationship to chronologic age, was tested using two bivariate correlation analyses: gross-r × chronologic age and fine-r × chronologic age. We predicted the latter correlation would be negative and that the former would be weakly positive or negative. To assess whether the Pearson coefficients from the two correlations were significantly different, we used the Hotelling-William (HW) test.16 The null hypothesis of this test is that two correlations taken from the same sample are equal. A t-statistic is computed and, if significant to the P < .05 level, the null hypothesis is rejected. This is the preferred method to test the equality of two Pearson correlations obtained from the same sample.17
A second set of correlational analyses was conducted to test the hypothesis that preimplant fine-r would be more closely related to postimplant spoken language skills than gross-r. A bivariate correlation matrix was constructed with the following variables: gross-r, fine-r, GAEL-P, RDLS-rec, RDLS-exp, and PPVT. For the postimplant spoken language tests, we treated scores from the 1-year and 2-year postimplant intervals as separate variables in the matrix. We predicted that fine-r scores would tend to be more positively correlated with the spoken language measures than gross-r. Pearson correlations and results from individual HW tests were used to investigate this prediction.
RESULTS
Descriptive Statistics
The means and distribution of scores for fine-r and gross-r are shown in Figure 1. Mean gross-r was 0.822 (standard deviation [SD] = 0.35) and mean fine-r was 0.920 (SD = 0.30). A paired-samples t test revealed no significant difference between mean gross-r and fine-r (t[21] =−1.202, P = .243).
Fig. 1.
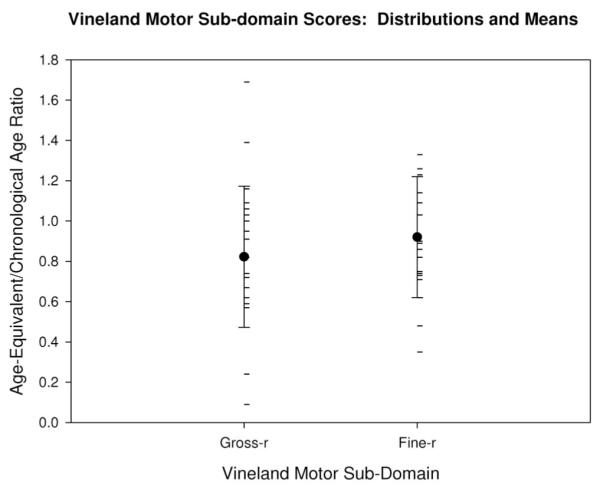
Vineland motor domain scores: distribution and means: The mean gross-r and fine-r for the sample are shown by the large black dots with error bars indicating the standard deviation. Individual gross-r and fine-r scores are shown by the horizontal hash marks.
Correlations: Motor Domain and Chronologic Age
Table III shows the correlation matrix Pearson coefficients for the variables fine-r, gross-r, and chronologic age. None of the individual correlations reached significance (one-tailed Ps > .05). The correlation between fine-r and gross-r was weakly positive (.316). As shown in the table, fine-r and chronologic age were weakly correlated in the negative direction, whereas gross-r and chronologic age were weakly correlated in the opposite, positive direction. An HW test confirmed that these two correlations were significantly different from each other (t[21] = 2.417, P = .0129). In other words, the relationship between fine-r and chronologic age was found to be significantly different than the relationship between gross-r and chronologic age. Scatterplots in Figure 2A and B illustrate these divergent correlations.
TABLE III.
Pearson Correlation Coefficients: Chronologic Age.
| Gross-r | Fine-r | Age | |
|---|---|---|---|
| Gross-r | — | 0.316 | 0.307 |
| Fine-r | 0.316 | — | −0.260 |
Fig. 2.

(A and B) Vineland motor domain as a function of age at test: (A) the positive relationship between age at test (in months) on the x-axis and gross-r scores on the y-axis. In contrast, (B) the inverse relationship between age at test on the x-axis and fine-r scores on the y-axis. Lines of best fit are shown in each scatterplot.
Correlations: Motor Domain and Spoken Language Outcomes
Table IV shows the Pearson correlation matrix for the motor domain variables and the four spoken language outcome measures: GAEL-P, RDLS-rec, RDLS-exp, and PPVT. For each outcome measure, separate correlations were computed using scores obtained at the 1-year and 2-year postimplant intervals. Only a subset of the 24 participants had a score for a given outcome measure and postimplant interval; therefore, the sample sizes of the correlations varied. The sample size for each correlation is shown in Table IV.
TABLE IV.
Pearson Correlation Coefficients: Outcome Measures.
| GAEL-P |
RDLS-rec |
RDLS-exp |
PPVT |
|||||
|---|---|---|---|---|---|---|---|---|
| Year 1 | Year 2 | Year 1 | Year 2 | Year 1 | Year 2 | Year 1 | Year 2 | |
| N | 13 | 8 | 15 | 8 | 13 | 7 | 11 | 7 |
| Gross-r | 0.278 | 0.160 | 0.197 | −0.340 | −0.038 | −0.267 | 0.309 | 0.115 |
| Fine-r | 0.280 | 0.447 | 0.293 | 0.521 | 0.646* | 0.892† | 0.397 | 0.393 |
| HW test | NS | NS | NS |
t(5) = 2.3 P = .10 |
t(10) = 2.0 P < .05 |
t(4) = 2.65 P < .05 |
NS | NS |
Pearson correlation significant to P < .01, one-tailed.
t statistics (degrees of freedom) and one-tailed P values for significant and near-significant results shown. GAEL-P = Grammatical Analysis of Elicited Language; RDLS-rec = Reynell Developmental Language Scales 3rd edition receptive scales; RDLS-exp = Reynell Developmental Language Scales 3rd edition expressive scales; PPVT = Peabody Picture Vocabulary Test; HW test = Hotelling-William test; NS = not significant (one-tailed P > .05).
In general, correlations between gross-r and the out-come measures were weakly positive, whereas correlations between fine-r and the outcome measures tended to be more strongly positive. The only correlations to reach significance (based on the one-tailed P value of the Pearson coefficients) were between fine-r and expressive language quotients obtained at the 1-year and 2-year postimplant intervals. In contrast, the correlations between gross-r and expressive language were weaker and nonsignificant. Scatterplots in Figures 3A, 3B, 4A, and 4B illustrate these divergent correlations.
Fig. 3.

(A and B) Expressive language quotient at 1 year postimplant as a function of preimplant Vineland motor subdomain score. (A) Preimplant gross-r scores were not positively related to postimplant RDLS-exp language quotient scores after 1 year of cochlear implant use. In contrast, (B) preimplant fine-r scores were positively related to postimplant RDLS-exp scores at this interval. Lines of best fit are shown in each scatterplot.
Fig. 4.

(A and B) Expressive language quotient at 2 years postimplant as a function of preimplant Vineland motor subdomain score. (A) Preimplant gross-r scores were not positively related to postimplant RDLS-exp language quotient scores after 2 years of cochlear implant use. In contrast, (B) preimplant fine-r scores were positively related to postimplant RDLS-exp scores at this interval. Lines of best fit are shown in each scatterplot.
It should be noted, however, that the significance of individual Pearson coefficients is questionable when a correlation matrix is large and when individual correlations have a small sample size. Therefore, HW tests were conducted to compare whether fine-r correlations were significantly different from the corresponding gross-r correlations. These data are shown in the last row of Table IV. For GAEL-P and PPVT scores, the corresponding cor-relations at each interval of CI use were not significantly different (one-tailed Ps > .05). However, fine-r was more strongly correlated than gross-r to RDLS-exp scores at postimplant years 1 and 2. In addition, the trend for fine-r to correlate more strongly than gross-r with RDLS-rec scores at postimplant year 2 approached significance.
DISCUSSION
Our findings suggest a developmental divergence between gross and fine motor skills in prelingually deaf children. Although there were no average differences between fine and gross motor skills in the sample tested, the two motor domains showed different, and opposite, relationships to chronologic age. For gross motor skills, we found a positive relationship between age and motor development: older deaf children tended to show more advanced gross motor behaviors relative to age than younger deaf children. However, the opposite trend was observed for fine motor skills: older deaf children tended to show less advanced motor behaviors relative to age than younger deaf children. These correlations were significantly different, indicating that auditory deprivation, and associated language delay, may impact development of fine motor skills differently than gross motor skills.
We also found preliminary evidence that preimplant fine motor skills, more than gross motor skills, are related to postimplant receptive and expressive language acquisition in deaf children with CIs. Infants and children with more advanced fine motor behaviors before implantation tended to show more advanced language skills after implantation than children with less advanced fine motor behaviors. In addition, the correlations between fine motor and language skills were significantly stronger (or approached significance) than corresponding gross motor correlations at three of four postimplant intervals. We did not find statistical support for a similar divergence in fine/gross motor relations to the speech perception scores (GAEL-P) or the vocabulary (PPVT) scores. However, for both GAEL-P scores and PPVT scores at postimplant year 2, the fine and gross motor correlations differed in the predicted direction. In fact, of the eight pairs of correlations shown in Table IV, the fine motor correlation was stronger (in the positive direction) than the gross motor correlation in all cases. Therefore, we believe that with larger sample sizes, we would also see fine motor scores to be more closely related than gross motor scores to the speech perception and vocabulary measures.
It is important to note several limitations to the present study. First, the data presented are correlational and cross-sectional and should be further investigated and confirmed with prospective, longitudinal designs. Second, the measure of motor development used in this study, although more refined than the overall measure reported by Horn et al.,10 is somewhat coarse. Future studies of links between motor development and spoken language development in CI users should use more detailed measures as discussed subsequently. Third, the Vineland is a parental/caregiver report and, therefore, is subject to bias on the part of the person who answers the items. Fourth, the small sample size, particularly for the correlations involving spoken language outcome measures, was a limiting factor in the power of our correlational analyses.
Despite these limitations, the present findings present evidence that fine motor development and spoken language acquisition are entwined processes in deaf infants and children with CIs. Recent findings in the field of embodied cognition suggest a process-oriented explanation to these findings. In particular, there is emerging evidence that there are common cortical mechanisms involved in both certain manual motor behaviors and spoken language processing. We review a subset of the relevant findings.
Prelinguistic links between motor and spoken language systems have been reported across several different fields of study. These studies suggest that brain areas responsible for rhythmic limb movement are also involved with prelinguistic babbling behavior of infants.18,19 Locke and colleagues observed rhythmic hand movements in typically developing infants seen either before or after the onset of canonic babbling.18 They found that righthanded rhythmic movements were more common in children who had begun to babble than in children who had not yet begun to babble. Locke and colleagues argued that a common area of left cerebral hemisphere is involved with rhythmic motor activity and prelinguistic speech.
Links have also been reported between motor skills and reading abilities in older children. For instance, children with developmental reading disorders have been shown to be slower and more error prone than agematched control children on a variety of tasks requiring manual coordination and rapid motor sequencing.20 Wolff has argued that motor and language processing deficits co-occur in these children because both reading and manual coordination require rapid and precise control over temporal sequences.21 For instance, reading involves rapid decoding of the visual words into accurate sequences of phonemes. Similarly, performing sequences of movements also involve rapid and accurate formation of motor sequences. In support of this hypothesis, Carello and her colleagues recently found that adults’ phonologic coding skills were strongly correlated with sequential fingertapping skills.22
Neuroimaging data has provided direct evidence that common cortical systems support motor behaviors and spoken language processing. A series of studies using transcranial magnetic stimulation (TMS) have shown that motor cortex is activated in a gesture-specific manner during speech listening.23,24 Fadiga and colleagues demonstrated activation of motor cortex controlling the anterior tongue muscles during listening to bisyllabic words and nonwords compared with nonspeech stimuli.24 They reported that tongue muscle facilitation was greater for words in which phonemic articulation would require greater use of the anterior tongue. More recent findings with TMS have replicated and expanded these results to other aspects of speech and language processing.23 These findings suggest that motor skills and language systems are closely linked as a result of the articulatory basis of speech encoding.
Other neuroimaging data lend further support to the hypothesis that motor and language systems share cortical processing resources.25,26 Wilson et al. used functional magnetic resonance imaging to measure brain activity during speech reading and found that premotor cortical areas were active during this activity.26 Stowe et al. also reported activation of motor areas of cortex during passive listening to sentences with clear or ambiguous meanings. Although the activation patterns differed, both types of sentences led to activation of multiple motor areas, including premotor cortex and basal ganglia. These findings suggest that the close links between language and motor systems may be the result of shared neural processing resources in the premotor cortex.
The wide range of variability in spoken language skills obtained by prelingually deaf children who use CIs presents a unique clinical opportunity to study relations between motor and language systems. Deaf children experience a delay in useful auditory input before implantation and, thus, are initially delayed in a range of spoken language skills. Furthermore, the present study suggests that prelingually deaf children who are older, and have experienced a longer period of auditory deprivation, may demonstrate atypical development of fine motor skills compared with younger deaf children with shorter periods of auditory deprivation. Further research is needed to determine precisely which types of motor skills are delayed in these deaf children. Longitudinal research is needed to determine whether access to sound by a CI has any effect on the development of fine motor skills in this population. Finally, more research is needed to determine whether tests of fine motor skills can be used as clinical predictors of benefit from a CI in prelingually deaf infants and children.
Acknowledgments
The authors thank Mary Sanders, PhD, for her assistance in collecting and scoring the Vineland data.
This work was supported by NIH-NIDCD Training Grant T32 DC00012 and NIH NIDCD Research Grant RO1 DC00064 to Indiana University.
Footnotes
Presented at the combined Middle/Western Triological Society Meeting on February 4, 2006, and the winner of the Walter Work Resident Research Award for Clinical Research.
BIBLIOGRAPHY
- 1.Lenneberg E. Biological Foundations of Language. John Wiley & Sons; New York: 1967. [Google Scholar]
- 2.Siegel L, Saigal S, Rosenbaum P, et al. Predictors of development in preterm and full-term infants: a model for detecting the at risk child. J Pediatr Psychol. 1982;7:135–148. doi: 10.1093/jpepsy/7.2.135. [DOI] [PubMed] [Google Scholar]
- 3.Gesell A, Thompson H. The Psychology of Early Growth Including Norms of Infant Behavior and a Method of Genetic Analysis. Macmillan; New York: 1938. [Google Scholar]
- 4.Wilson M. Six views of embodied cognition. Psychon Bull Rev. 2002;9:625–636. doi: 10.3758/bf03196322. [DOI] [PubMed] [Google Scholar]
- 5.Moeller M, Osberger M, Eccarius M. Language and learning skills of hearing-impaired students. Receptive language skills. ASHA Monogr. 1986;23:41–53. [PubMed] [Google Scholar]
- 6.Osberger M, Moeller M, Eccarius M, Robbins A, Johnson D. Language and learning skills of hearing-impaired students. Expressive language skills. ASHA Monogr. 1986;23:54–65. [PubMed] [Google Scholar]
- 7.Savelsbergh G, Netelenbos J, Whiting H. Auditory perception and the control of spatially coordinated action of deaf and hearing children. J Child Psychol Psychiatry. 1991;32:489–500. doi: 10.1111/j.1469-7610.1991.tb00326.x. [DOI] [PubMed] [Google Scholar]
- 8.Wiegersma P, Van der Velde A. Motor development of deaf children. J Child Psychol Psychiatry. 1983;24:103–111. doi: 10.1111/j.1469-7610.1983.tb00107.x. [DOI] [PubMed] [Google Scholar]
- 9.Kutz W, Wright C, Krull K, Manolidis S. Neuropsychological testing in the screening for cochlear implant candidacy. Laryngoscope. 2003;113:763–766. doi: 10.1097/00005537-200304000-00035. [DOI] [PubMed] [Google Scholar]
- 10.Horn D, Pisoni D, Sanders M, Miyamoto R. Behavioral assessment of pre-lingually deaf children prior to cochlear implantation. Laryngoscope. 2005;115:1603–1611. doi: 10.1097/01.mlg.0000171018.97692.c0. [DOI] [PMC free article] [PubMed] [Google Scholar]
- 11.Schlumberger E, Narbona J, Manrique M. Non-verbal development of children with deafness with and without cochlear implants. Dev Med Child Neurol. 2004;46:599–606. doi: 10.1017/s001216220400101x. [DOI] [PubMed] [Google Scholar]
- 12.Sparrow S, Balla D, Cicchetti D. Vineland Adaptive Behavioral Scales (Survey Form Manual) American Guidance Service; Circle Pines, MN: 1984. [Google Scholar]
- 13.Moog J, Kozak V, Geers A. Grammatical Analysis of Elicited Language—Presentence Level. Central Institute for the Deaf; St. Louis: 1983. [Google Scholar]
- 14.Reynell JK, Huntley M. Reynell Developmental Language Scales. NFER-Nelson; Windsor, UK: 1985. [Google Scholar]
- 15.Dunn L, Dunn L. Peabody Picture Vocabulary Test. 3rd ed. American Guidance Service; Circle Pines, MN: 1997. [Google Scholar]
- 16.Steiger J. Tests for comparing elements of a correlation matrix. Psychol Bull. 1980;87:245–251. [Google Scholar]
- 17.Bobko P. Correlation and Regression: Principles and Applications for Industrial/Organizational Psychology and Management. McGraw-Hill; New York: 1995. [Google Scholar]
- 18.Locke J, Bekken K, McMinn-Larson L, Wein D. Emergent control of manual and vocal-motor activity in relation to the development of speech. Brain Lang. 1995;51:498–508. doi: 10.1006/brln.1995.1073. [DOI] [PubMed] [Google Scholar]
- 19.Iverson J, Fagan M. Infant vocal-motor coordination: precursor to the gesture-speech system? Child Dev. 2004;75:1053–1066. doi: 10.1111/j.1467-8624.2004.00725.x. [DOI] [PubMed] [Google Scholar]
- 20.Wolff P, Michel G, Ovrut M, Drake C. Rate and timing precision of motor coordination in developmental dyslexia. Dev Psychol. 1990;26:349–359. [Google Scholar]
- 21.Wolff P. A candidate phenotype for familial dyslexia. Eur Child Adolesc Psychiatry. 1999;8:21–27. doi: 10.1007/s007870050123. [DOI] [PubMed] [Google Scholar]
- 22.Carello C, LeVasseur V, Schmidt R. Movement sequencing and phonological fluency in (putatively) nonimpaired readers. Psychol Sci. 2002;13:375–379. doi: 10.1111/1467-9280.00467. [DOI] [PubMed] [Google Scholar]
- 23.Floel A, Ellger T, Breitenstein C, Knecht S. Language perception activates the hand motor cortex: implications for motor theories of speech perception. Eur J Neurosci. 2003;18:704–708. doi: 10.1046/j.1460-9568.2003.02774.x. [DOI] [PubMed] [Google Scholar]
- 24.Fadiga L, Craighero L, Buccino G, Rizzolatti G. Speech listening specifically modulates the excitability of tongue muscles: a TMS study. Eur J Neurosci. 2002;15:399–402. doi: 10.1046/j.0953-816x.2001.01874.x. [DOI] [PubMed] [Google Scholar]
- 25.Stowe L, Paans A, Wijers A, Zwarts F. Activations of ‘motor’ and other non-language structures during sentence comprehension. Brain Lang. 2004;89:290–299. doi: 10.1016/S0093-934X(03)00359-6. [DOI] [PubMed] [Google Scholar]
- 26.Wilson S, Saygin A, Sereno M, Iacoboni M. Listening to speech activates motor areas involved in speech production. Nat Neurosci. 2004;7:701–702. doi: 10.1038/nn1263. [DOI] [PubMed] [Google Scholar]