Abstract
Glucagon-like peptide 1 (GLP-1) increases tissue glucose uptake and causes vasodilation independent of insulin. We examined the effect of GLP-1 on muscle microvasculature and glucose uptake. After confirming that GLP-1 potently stimulates nitric oxide (NO) synthase (NOS) phosphorylation in endothelial cells, overnight-fasted adult male rats received continuous GLP-1 infusion (30 pmol/kg/min) for 2 h plus or minus NOS inhibition. Muscle microvascular blood volume (MBV), microvascular blood flow velocity (MFV), and microvascular blood flow (MBF) were determined. Additional rats received GLP-1 or saline for 30 min and muscle insulin clearance/uptake was determined. GLP-1 infusion acutely increased muscle MBV (P < 0.04) within 30 min without altering MFV or femoral blood flow. This effect persisted throughout the 120-min infusion period, leading to a greater than twofold increase in muscle MBF (P < 0.02). These changes were paralleled with increases in plasma NO levels, muscle interstitial oxygen saturation, hind leg glucose extraction, and muscle insulin clearance/uptake. NOS inhibition blocked GLP-1–mediated increases in muscle MBV, glucose disposal, NO production, and muscle insulin clearance/uptake. In conclusion, GLP-1 acutely recruits microvasculature and increases basal glucose uptake in muscle via a NO-dependent mechanism. Thus, GLP-1 may afford potential to improve muscle insulin action by expanding microvascular endothelial surface area.
Glucagon-like peptide 1 (GLP-1), a major incretin hormone, is released from the gut in response to nutrients and potently stimulates glucose-induced insulin secretion. In patients with type 2 diabetes, its secretion is diminished (1–4), and incretin-based therapies have emerged as a major therapeutic option. Activation of the GLP-1 receptors regulates blood glucose concentration by mechanisms including enhanced insulin synthesis/secretion, suppressed glucagon secretion, slowed gastric emptying, and enhanced satiety (5).
Recent evidence confirms that GLP-1 increases muscle glucose uptake independent of its ability to enhance insulin secretion (6). In conscious dogs with dilated cardiomyopathy, both GLP-1 and its active metabolite are able to increase myocardial glucose uptake without altering plasma insulin concentrations (7,8). Intraportal GLP-1 infusion in dogs increases nonhepatic glucose utilization without changing pancreatic hormone levels (9). During low-flow ischemia, GLP-1 increases coronary blood flow and myocardial uptake of glucose in Langendorff-perfused rat heart preparation (10).
In addition to its well-characterized glycemic actions, studies in both animals and humans have repeatedly shown a beneficial action of GLP-1 on vasculature. Infusion of GLP-1 into Dahl salt-sensitive rats attenuated the development of hypertension, reduced proteinuria, and improved vasodilator response to acetylcholine (11). In healthy humans, infusion of GLP-1 increased acetylcholine-induced vasodilatation independent of alterations in blood levels of glucose and insulin without altering the vasorelaxant response to nitroprusside, possibly via the nitric oxide (NO) pathway involving ATP-sensitive K+ channels (12). In type 2 diabetic patients with stable coronary artery disease, infusion of GLP-1 ameliorated endothelial dysfunction as evidenced by improved flow-mediated dilatation (13).
The molecular pathways underlying these beneficial vascular actions of GLP-1 remain elusive. Studies done using rat arterial rings have shown a direct, dose-dependent vasorelaxant effect of GLP-1 that is abolished by the removal of the endothelium, confirming the necessity of endothelium in GLP-1–mediated vasodilation (14). In a similar manner, inhibition of endothelial NOS (eNOS) with NG-nitro-l-arginine methyl ester (l-NAME) abolishes the vasorelaxant effect of GLP-1 on rat pulmonary arteries (15).
Recent evidence suggests that altered muscle endothelial surface area profoundly affects insulin delivery and action in muscle (16,17). Many physiological factors regulate muscle microvascular perfusion in vivo, including insulin, mixed meal, angiotensin II receptor blocker, and muscle contraction (18–24), and muscle microvascular recruitment induced by contraction is associated with increased muscle insulin uptake (22). Because endothelial cells (ECs) express abundant GLP-1 receptors (13) and GLP-1 has been shown to increase coronary blood flow and myocardial glucose uptake independent of insulin (25), it is likely that GLP-1 may also enhance muscle microvascular recruitment and insulin delivery to muscle. This was assessed in the current study. Our results indicate that GLP-1 indeed potently recruits muscle microvasculature by increasing microvascular blood volume (MBV), increases insulin delivery, and enhances glucose uptake in muscle via a NO-dependent mechanism.
RESEARCH DESIGN AND METHODS
Culture of bovine aortic ECs and Western blotting.
Bovine aortic ECs (bAECs) in primary culture were purchased from Cambrex BioSciences (Walkersville, MD) and cultured as described previously (26,27). After serum starvation for 12 h, cells between passages 3 to 8 were exposed to GLP-1 (7-36) amide (Bachem Americas, Inc., Torrance, CA) (0.1, 0.3, 1.0, 10, and 100 ng/mL) or insulin (100 nmol/L) for 20 min in the absence or presence of a GLP-1 receptor antagonist, exendin (9-39) (10 nmol/L) (Bachem Americas, Inc.). Cells were then washed twice with ice-cold 1× PBS solution and lysed by sonication using a Fisher XL2020 sonicator (Fisher Scientific, Pittsburgh, PA) in ice-cold lysis buffer. Cell lysates were centrifuged for 10 min at 4°C (20,000g), and the supernatants were used for Western blotting. Proteins were transferred to nitrocellulose membranes, and the membranes were probed with antibodies against phospho-Akt1 (Ser473), Akt, phospho-eNOS (Ser1177), eNOS (Cell Signaling Technology, Beverly, MA), or phospho-eNOS (Ser635) (Upstate, Lake Placid, NY) overnight at 4°C. This was followed by a secondary antibody coupled to horseradish peroxidase, and the blots were developed using enhanced chemiluminescence (GE Healthcare Bio-Sciences Corp, Piscataway, NJ). Autoradiographic films were scanned densitometrically and quantified using ImageQuant 3.3 software. Both the total and phosphospecific densities were quantified and the ratios of phosphospecific to total density calculated.
Quantification of cAMP-dependent protein kinase activity.
bAEC cAMP-dependent protein kinase (PKA) activity was quantified using an assay kit (Promega Corporation), according to the manufacturer’s instructions. In brief, cells were plated in 10-cm plates, grown to 80% confluence, and then incubated with GLP-1 (1 ng/mL) for 20 min. Cells were then suspended in cold PKA extraction buffer and homogenized, and the lysate was centrifuged for 5 min at 4°C at 14,000g. The supernatant was mixed with assay mixture and incubated for 30 min at room temperature, and the reaction was stopped by heating the mixture to 95°C for 10 min. Samples were then separated on a 0.8% agarose gel at 100 V for 15 min. The densities of both the phosphorylated and nonphosphorylated peptides were quantified using ImageJ software, and the ratios of phosphospecific to total density were calculated.
Animal preparations and experimental protocols.
Adult male Sprague-Dawley rats (Charles River Laboratories, Wilmington, MA) weighing 220–320 g were studied after an overnight fast. Rats were housed at 22 ± 2°C, on a 12 h light-dark cycle and fed standard laboratory chow and water ad libitum before the study. After being anesthetized with pentobarbital sodium (50 mg/kg i.p.; Abbott Laboratories, North Chicago, IL), rats were placed in a supine position on a heating pad to ensure euthermia and intubated to maintain a patent airway. Polyethylene cannulae (PE-50; Fisher Scientific, Newark, DE) were inserted into the carotid artery and jugular vein for arterial blood pressure monitoring, arterial blood sampling, and various infusions.
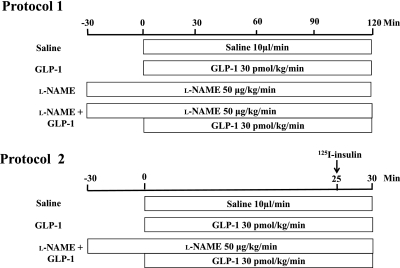
After a 30- to 45-min baseline period to ensure hemodynamic stability and a stable level of anesthesia, rats were studied using one of the following two protocols (Fig. 1): In protocol 1, rats received an intravenous infusion of saline (control) or GLP-1 (7-36) amide (30 pmol/kg/min; Bachem Americas, Inc.) for 120 min in the presence or absence of systemic infusion of l-NAME (50 μg/kg/min; Sigma-Aldrich, St. Louis, MO). l-NAME infusion was started 30 min before the commencement of GLP-1 infusion and at the dose selected, raises mean arterial blood pressure (MAP) by 20–30 mmHg above baseline without affecting the heart rate (24,28,29). Skeletal muscle MBV, microvascular blood flow velocity (MFV), and microvascular blood flow (MBF) were determined using contrast-enhanced ultrasound, and femoral artery blood flow (FBF) was measured using a flow probe (VB series 0.5 mm, Transonic Systems), as described previously (21,22,29,30). Hind leg glucose extraction, plasma NO levels, and muscle interstitial oxygen saturation were measured as described below. Rat gastrocnemius muscles were collected for measurement of eNOS (Ser1177) phosphorylation using Western blotting. In protocol 2, rats received a continuous infusion of either saline, GLP-1 (30 pmol/kg/min), or GLP-1 with l-NAME (50 μg/kg/min) for 30 min. At 25 min, each rat received a bolus intravenous injection of 1.5 μCi 125I-insulin (PerkinElmer, Boston, MA). At the end of the study, rats were killed, and plasma and gastrocnemius were obtained for determination of muscle 125I-insulin clearance/uptake.
FIG. 1.
Animal study protocols.
Throughout the study, MAP was monitored via a sensor connected to the carotid arterial catheter (Harvard Apparatus, Holliston, MA, and ADInstruments, Inc., Colorado Springs, CO). Pentobarbital sodium was infused at a variable rate to maintain steady levels of anesthesia and blood pressure throughout the study. GLP-1 was given as continuous infusion because of its shorter plasma half-life secondary to rapid degradation by enzyme dipeptidyl peptidase IV (5,31). The investigation conforms to the Guide for the Care and Use of Laboratory Animals published by the National Institutes of Health (Publication No. 85–23, revised 1996). The study protocols were approved by the animal care and use committee of the University of Virginia.
Determination of hind leg glucose uptake.
Carotid arterial and femoral venous blood glucose concentrations were determined using an Accu-Chek Advantage blood glucometer (Roche Diagnostics). Glucose levels were determined four to six times per time point, and the numbers were averaged. Hind leg glucose uptake (mg/dL) was calculated as the arterial-venous (A-V) glucose difference.
Measurement of plasma NO levels.
Plasma NO levels were measured using 280i Nitric Oxide Analyzer (GE Analytical Instruments), according to the manufacturer’s instructions. In brief, ice-cold ethanol was added into plasma samples at a ratio of 2:1. The mixture was kept at 0°C for 30 min and then centrifuged at ∼14,000 RPM for 5 min. The supernatant was then used for NO analysis based on a gas-phase chemiluminescent reaction between NO and ozone.
Quantification of muscle interstitial oxygen saturation.
Muscle interstitial oxygen saturation was measured using a fiber-optic oxygen measurement system (OXYMICRO; World Precision Instruments), based on the effect of dynamic luminescence quenching by molecular oxygen. In brief, a needle housing the fibro-optic oxygen microsensor was inserted into the right hind limb skeletal muscle, and the glass fiber with its oxygen-sensitive tip inside the needle was extended into muscle interstitium by carefully pressing the syringe plunger. Measurements were taken every 10 s, and 1-min average values were calculated.
Muscle 125I-insulin clearance/uptake.
Five minutes after a bolus injection of 1.5 μCi 125I-insulin, rats were killed. The dose and exposure time were selected because this tracer amount of 125I-insulin does not increase systemic insulin concentrations, and intact insulin has a short circulating half-life (<5 min) (32). Plasma sample was collected and each rat was then flushed with 120 mL ice-cold saline (10 mL/min) via the carotid artery catheter. Gastrocnemius muscle was dissected from right hind limb. Protein-bound 125I in plasma and muscle samples was precipitated with 30% trichloroacetic acid, and radioactivity was measured using a gamma-counter. Muscle 125I-insulin clearance rates were expressed as muscle 125I-insulin (DPM/g dry weight)/plasma 125I-insulin (DPM/mL)/5 min and 125I-insulin uptake as muscle 125I-insulin DPM/muscle dry weight (g)/5 min.
Statistic analysis.
All data are presented as mean ± SEM. Statistical analyses were performed with SigmaStat 3.1.1 software (Systat Software, Inc.) using either Student t test or ANOVA with post hoc analysis as appropriate. P < 0.05 was considered statistically significant.
RESULTS
GLP-1 effects on Akt, eNOS, and PKA in cultured bAECs.
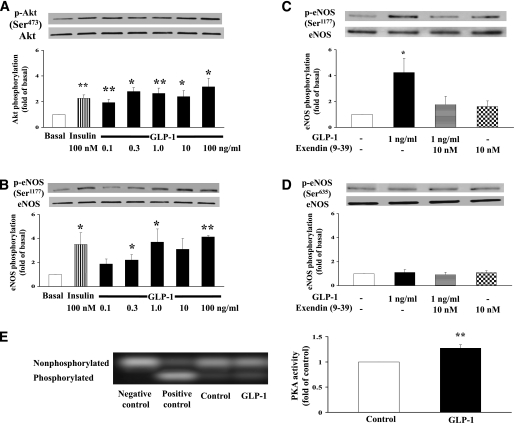
After confirming that ECs express abundant GLP-1 receptors, we first carried out a dose-response study examining whether GLP-1 exerts a direct effect on the vascular ECs in vitro prior to the animal studies (Fig. 1). As shown in Fig. 2A, incubation of bAECs with GLP-1 at concentrations ranging from 0.1 to 100 ng/mL (∼30 pmol/L to 30 nmol/L) for 20 min potently increased the phosphorylation of Akt (P = 0.007, ANOVA). Although GLP-1 at 100 ng/mL appeared to be more effective than insulin in stimulating Akt phosphorylation, the difference was not statistically significant (P = 0.26). In a similar manner, GLP-1 acutely stimulated the phosphorylation of eNOS at Ser1177 (P = 0.009, ANOVA) (Fig. 2B). Incubation of the cells with exendin (9-39) (10 nmol/L), a specific GLP-1 receptor antagonist, completely abolished GLP-1–induced eNOS phosphorylation at Ser1177, confirming that GLP-1 acted via its receptors (Fig. 2C). On the contrary, GLP-1 failed to increase eNOS phosphorylation at Ser635 (Fig. 2D). It appears that Akt was more responsive to GLP-1 stimulation than eNOS (Ser1177) because Akt phosphorylation increased with 0.1 ng/mL GLP-1 while eNOS (Ser1177) phosphorylation did not significantly increase until GLP-1 concentration reached 0.3 ng/mL (∼90 pmol/L). The lack of synchronicity between Akt and eNOS (Ser1177) phosphorylation suggests that factors other than Akt might have been involved in eNOS activation. Indeed, GLP-1 incubation significantly increased the activity of PKA, which is the main downstream signaling pathway of the GLP-1 receptor and capable of phosphorylating eNOS, in cultured ECs (Fig. 2E).
FIG. 2.
Effects of GLP-1 on Akt, eNOS, and PKA in cultured ECs. Representative gels and quantifications of Akt (Ser473) (A), eNOS (Ser1177) (B and C), eNOS (Ser635) (D), and PKA (E) phosphorylation. n = 4–9 each. Compared with basal, *P < 0.05, **P < 0.01. Insulin (100 nmol/L) was used as positive control.
GLP-1 potently recruits muscle microvasculature.
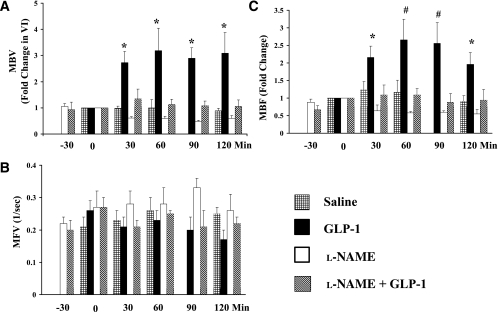
The above results from in vitro studies prompted us to examine whether GLP-1 recruits muscle microvasculature in vivo. Because in rats, plasma GLP-1 concentrations increase from ∼15 pmol/L to ∼80 pmol/L when GLP-1 is infused at 20 pmol/kg/min (33), and because our in vitro study demonstrated a stimulatory effect of GLP-1 on eNOS at a concentration of 0.3 ng/mL (∼90 pmol/L), in the current study, we used an infusion rate of 30 pmol/kg/min for all in vivo experiments. Muscle microvascular parameters were determined before and during 120 min of GLP-1 infusion (Fig. 3). Control rats received saline infusion only. Saline infusion did not significantly change muscle microvascular parameters (MBV, MFV, and MBF) during the entire course of the study. GLP-1 potently increased muscle MBV (by ∼2.5-fold) within 30 min, and this effect persisted throughout the 120-min experimental period (P < 0.04, ANOVA) (Fig. 3A). MFV did not change significantly during GLP-1 infusion (Fig. 3B). As a result, GLP-1 infusion led to a significant increase in MBF (∼2.5-fold, P < 0.02, ANOVA) (Fig. 3C). Both FBF and MAP remained stable during GLP-1 infusion (Table 1). The changes in MBV and MBF seen with GLP-1 infusion appear to be larger than those induced by insulin at physiologically relevant concentrations, which increased MBV and MBF by ∼1.7- and 2.1-fold, respectively, without altering MFV (34). Because plasma insulin concentrations trended higher at 30 min (though not statistically significant) (Fig. 4E), in additional experiments, we coinfused somatostatin at 1.3 μg/kg/min with GLP-1 to inhibit endogenous insulin secretion. In the presence of somatostatin, GLP-1 again potently increased skeletal muscle MBV by 2.3-fold (n = 8, P < 0.01) without altering MFV (P = 0.14) at 30 min. Somatostatin completely blocked GLP-1–induced insulin secretion at 30 min (173 ± 37 vs. 88 ± 33 pmol/L, baseline vs. 30 min, P > 0.05, n = 5) without changing blood glucose levels (89.9 ± 4.1 vs. 83 ± 3.4 mg/dL, baseline vs. 30 min, P > 0.05), confirming that the microvascular effects were secondary to GLP-1 action, not insulin.
FIG. 3.
Effects of GLP-1 on muscle microvascular recruitment. GLP-1 was infused continuously at 30 pmol/kg/min in the absence or presence of l-NAME, which was infused systemically starting 30 min before the initiation of GLP-1 infusion. A: Changes in MBV. B: Changes in MFV. C: Changes in MBF. Compared with 0 min, *P < 0.05, #P < 0.01. n = 4–8 each.
TABLE 1.
Changes in MAP and FBF
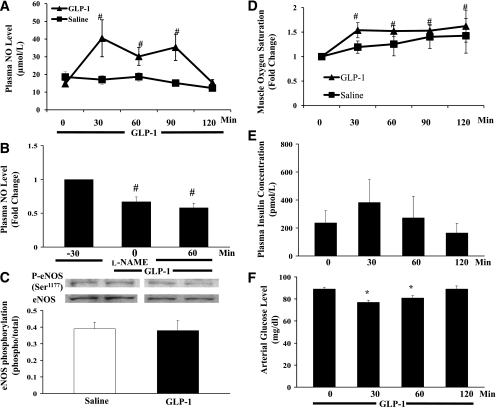
FIG. 4.
Effects of GLP-1 on plasma NO and insulin levels, muscle oxygenation, and eNOS phosphorylation. GLP-1 was infused continuously at 30 pmol/kg/min. A: Changes in plasma NO levels during GLP-1 infusion. #P < 0.01 vs. 0 min; P < 0.04 between the two groups (ANOVA). B: Changes in plasma NO levels during l-NAME + GLP-1 infusion. Compared with −30 min, #P < 0.01. C: Changes in muscle eNOS (Ser1177) phosphorylation. P = 0.8. D: Changes in muscle oxygen saturation over time. #P < 0.05 vs. 0 min; P < 0.02 between the two groups (ANOVA). E: Plasma insulin concentrations. P = 0.437 (ANOVA). F: Arterial glucose concentrations. *P < 0.01 vs. 0 min. n = 5–9 each.
GLP-1 increases plasma NO levels, muscle oxygenation, and muscle glucose extraction.
Because our in vitro study demonstrated a direct effect of GLP-1 on eNOS (Ser1177) phosphorylation, we next assessed whether GLP-1–induced changes in muscle microvascular perfusion was accompanied by increased plasma NO levels and whether it led to increased muscle oxygenation and substrate use. GLP-1 infusion increased plasma NO levels by greater than threefold within 30 min (Fig. 4A), which remained elevated for 90 min. At 120 min, plasma NO levels fell back to the control levels despite continued infusion of GLP-1. In saline-infused rats, plasma NO levels trended down by ∼30% during the 120-min study period (18.6 ± 3.0 vs. 12.3 ± 1.9 μmol/L, P > 0.05, ANOVA). Overall, plasma NO levels were significantly higher in the GLP-1 group than in the saline control rats (P = 0.028). GLP-1 infusion did not significantly change eNOS (Ser1177) phosphorylation in the rat skeletal muscle (Fig. 4C). Muscle interstitial oxygen saturation increased significantly within 30 min, which remained elevated for the entire 120 min (P = 0.014, ANOVA) (Fig. 4D).
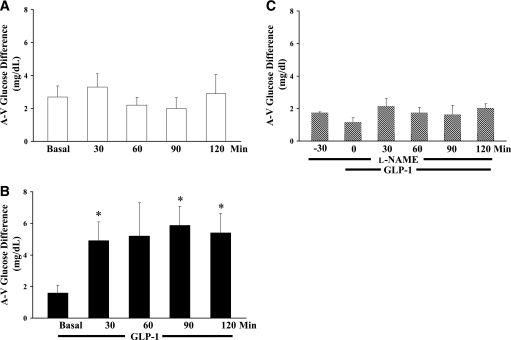
Muscle glucose utilization, as reflected by femoral A-V glucose difference, did not change during saline infusion (P = 0.8, ANOVA) (Fig. 5A). However, it increased by approximately threefold within 30 min of GLP-1 infusion, and this effect also persisted for the entire 120 min (Fig. 5B). This was associated with a small but significant decrease in arterial blood glucose levels at 30 and 60 min (Fig. 4F). Plasma insulin concentrations trended higher at 30 min, which was not statistically significant, and the levels at 60 and 120 min were comparable to the basal levels (P = 0.5, ANOVA) (Fig. 4E).
FIG. 5.
Effects of GLP-1 on muscle glucose extraction. A: Saline control. P > 0.05 (ANOVA); n = 5. B: GLP-1 group. Compared with basal, *P < 0.05, n = 6; P = 0.008 (ANOVA). C: l-NAME + GLP-1 group. P > 0.05 (ANOVA); n = 5. GLP-1 was infused continuously at 30 pmol/kg/min. l-NAME was infused systemically starting 30 min before the initiation of GLP-1 infusion.
NOS inhibition abolishes GLP-1–mediated muscle microvascular recruitment and glucose extraction.
To ascertain that NO production indeed played an essential role in GLP-1–induced increases in muscle MBV and glucose extraction, we infused l-NAME systemically starting 30 min before GLP-1 administration (Fig. 1). l-NAME infusion raised the average MAP by ∼10% (P < 0.05) without changing FBF (P > 0.05) (Table 1) and completely abolished GLP-1–induced changes in MBV (Fig. 3A) and MBF (Fig. 3C) without altering MFV (Fig. 3B). These were accompanied by markedly decreased plasma NO levels (Fig. 4B). In the presence of l-NAME, GLP-1 failed to increase muscle extraction of glucose from the plasma compartment (Fig. 5C). Inasmuch as there appeared to be a decreasing trend in both MBV and MBF during l-NAME infusion, there was no statistically significant difference in MBV, MFV, and MBF between the l-NAME group and the saline group (P > 0.05 for all, two-way repeated-measures ANOVA). On the contrary, the increases in both MBV and MBF induced by GLP-1 were highly significant compared with either the saline (P = 0.001 for MBV and 0.01 for MBF), l-NAME (P < 0.001 for both MBV and MBF), or l-NAME plus GLP-1 (P < 0.001 for both MBV and MBF) group (Fig. 3).
GLP-1 increases muscle insulin clearance/uptake.
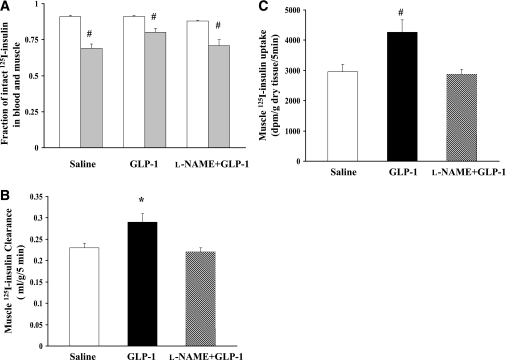
The prompt increase in muscle MBV and glucose extraction led us to assess the effect of GLP-1 on muscle insulin clearance/uptake. GLP-1 was infused for 30 min and 125I-insulin was given intravenously 5 min before the end of GLP-1 infusion (Fig. 1, protocol 2). As shown in Fig. 6A, the fractions of intact 125I-insulin were comparable among the saline control, GLP-1, and l-NAME plus GLP-1 groups in both blood and muscle, suggesting an equal rate of degradation of the injected radiotracer in blood or muscle. Infusion of GLP-1 significantly increased the amount of intact 125I-insulin in muscle, leading to significantly increased muscle insulin clearance (Fig. 6B) and uptake (Fig. 6C). Inhibition of NO production with l-NAME completely abolished these effects (Fig. 6B and C).
FIG. 6.
Effects of GLP-1 on muscle insulin clearance and uptake. A: Fraction of intact 125I-insulin in blood and muscle; blood (white bar), muscle (gray bar). Compared with blood, #P < 0.01. B: Muscle 125I-insulin clearance. Compared with saline, *P = 0.02 (ANOVA). C: Muscle 125I-insulin uptake. Compared with saline, #P < 0.01 (ANOVA). n = 5–9 each.
DISCUSSION
Using contrast-enhanced ultrasound technique, the current study demonstrates for the first time that GLP-1 potently recruits muscle microvasculature, which is associated with increased muscle glucose utilization, plasma concentrations of NO, muscle interstitial oxygenation, and muscle insulin clearance/uptake. That coinfusion of l-NAME, a potent inhibitor of NOS, abolishes GLP-1–mediated microvascular recruitment and glucose utilization in muscle strongly suggests that GLP-1 acts via a NO-dependent mechanism. The importance of GLP-1 recruiting muscle microvasculature cannot be overemphasized; in the resting state, only ∼30% of muscle capillaries are perfused (35), and it is in the microvasculature that substrate exchanges occur. The combination of a relatively low blood flow in the resting skeletal muscle and an increase in the endothelial exchange surface area would likely significantly increase hormone and substrate exchanges between the plasma compartment and muscle interstitium.
Our findings strongly suggest that GLP-1 plays a very important role in controlling postprandial plasma glucose levels via increasing microvascular recruitment in muscle. The observation that muscle microvascular recruitment was coupled with increased insulin uptake and glucose utilization in muscle during GLP-1 infusion is consistent with prior reports demonstrating that increasing muscle MBV by low frequency muscle contraction (22), angiotensin II type 1 receptor blocker losartan (24,34), or insulin (30) significantly increases muscle delivery of insulin and/or glucose utilization. This action is particularly important in the postprandial state. Thus, nutrient intake triggers the release of GLP-1, which would then not only mediate glucose-stimulated insulin secretion and inhibit glucagon secretion but also increase insulin delivery to and glucose extraction in muscle through microvascular recruitment. Whether this action contributes to the glucose lowering effect of incretin-based therapies in patients with type 2 diabetes remains to be studied.
We and others have previously observed that mixed meals potently recruit microvasculature in humans in both skeletal muscle (19,20,36) and myocardium (37). It is of interest to note in our previous study that mixed meal recruited more microvasculature than insulin infusion despite that plasma insulin concentrations were comparable between mixed meal challenged subjects and subjects who received insulin infusion (19). Given the current study findings, it is reasonable to speculate that GLP-1 secreted after meal ingestion may have contributed to this higher degree of muscle microvascular recruitment observed after meal feeding.
The observation of GLP-1 infusion acutely increasing plasma NO levels is consistent with our in vitro study demonstrating a direct stimulatory effect of GLP-1 on eNOS phosphorylation. In a similar manner, incubation of human umbilical vein ECs with GLP-1 analog liraglutide dose- and time-dependently increases NO production (38). The increase in plasma NO levels seen after GLP-1 infusion thus most likely reflects increased release of NO from the endothelium via a direct action of GLP-1 on the endothelium. That inhibition of NOS abolished GLP-1–induced increases in both plasma NO levels and microvascular recruitment strongly suggests that GLP-1 recruits muscle microvasculature via a NO-dependent mechanism. The lack of GLP-1–stimulated muscle glucose extraction in the presence of l-NAME also suggests that NO plays a major role in GLP-1–mediated muscle glucose extraction, either via direct actions on muscle or via microvascular recruitment. It is of interest to note that plasma NO levels fell back to the control levels at 120 min despite a continued GLP-1 infusion and sustained muscle microvascular recruitment and glucose extraction. This suggests that continued NO production is probably not necessary once the muscle microvasculature has already been recruited.
The current study suggests that both PKA and Akt may have been involved in the GLP-1–mediated microvascular action. In our in vivo study, PKA activity increased by ∼30%, whereas Akt phosphorylation increased by greater than twofold after GLP-1 stimulation. Given the semiquantitative nature of the Western blotting and that many factors are involved in the kinase activities, it would be difficult to ascertain which kinase plays a more important role in this process. In addition, the downstream signaling pathways remain to be explored.
Muscle interstitial oxygen saturation increased significantly after the initiation of GLP-1 infusion, which paralleled the changes in muscle MBV. Thus, increased muscle microvascular endothelial surface area not only increases substrate uptake but also facilitates oxygen delivery to the muscle as well. This finding is in line with our prior report demonstrating that increased muscle MBV after angiotensin II type 1 receptor blocker losartan administration is associated with increased muscle extraction of glucose and oxygen delivery (24). This finding is potentially significant because recent evidence suggests that tissue hypoxia plays an important role in the pathogenesis of insulin resistance and diabetes, possibly via increased inflammation (39–42). It is thus very likely that the increased substrate exchange and oxygen delivery may have contributed to the beneficial extrapancreatic effects of GLP-1, including improving heart failure, decreasing myocardial ischemic damage, and alleviating endothelial dysfunction (7–10,12,25).
Although both insulin and GLP-1 recruit muscle microvasculature via a NO-dependent mechanism, it is worth noting that GLP-1 appears to be more potent than insulin. This is of particular clinical significance in patients with insulin resistance and diabetes, considering that prior studies confirm that microvascular insulin resistance and dysfunction closely couple with metabolic insulin resistance (16,17,19,43–45). Insulin-mediated microvascular recruitment precedes insulin-stimulated glucose uptake in skeletal muscle (30), and blockade of insulin’s microvascular action with l-NAME decreases insulin-stimulated steady-state glucose disposal by ∼40% (28,30). Because GLP-1 signaling remains intact in patients with type 2 diabetes (46), it is likely that patients with diabetes have decreased microvascular response to insulin but remain responsive to GLP-1. In that case, GLP-1 could enhance muscle microvascular recruitment to increase substrate, oxygen, and insulin delivery to various tissues and improve insulin resistance and alleviate complications.
In conclusion, GLP-1 acutely increases microvascular recruitment and basal glucose uptake in muscle via a NO-dependent mechanism. Thus, GLP-1 may afford potential to improve muscle insulin action and decrease the cardiovascular complications associated with diabetes by expanding microvascular endothelial surface area, which is associated with increased tissue delivery of substrates, oxygen, and insulin.
ACKNOWLEDGMENTS
Z.L. has received American Diabetes Association grants 1-11-CR-30 and 9-09-NOVO-11 and National Institutes of Health grant R01-HL-094722.
No potential conflicts of interest relevant to this article were reported.
W.C., Z.D., and N.W. researched data. W.W., L.T., and W.C. contributed to discussion. Z.L. researched data and wrote the manuscript.
Z.L. is the guarantor of this work and, as such, had full access to all of the data in the study and takes responsibility for the integrity of the data and the accuracy of the data analysis.
REFERENCES
- 1.Vilsbøll T, Krarup T, Deacon CF, Madsbad S, Holst JJ. Reduced postprandial concentrations of intact biologically active glucagon-like peptide 1 in type 2 diabetic patients. Diabetes 2001;50:609–613 [DOI] [PubMed] [Google Scholar]
- 2.Toft-Nielsen M-B, Damholt MB, Madsbad S, et al. Determinants of the impaired secretion of glucagon-like peptide-1 in type 2 diabetic patients. J Clin Endocrinol Metab 2001;86:3717–3723 [DOI] [PubMed] [Google Scholar]
- 3.Vilsbøll T, Krarup T, Sonne J, et al. Incretin secretion in relation to meal size and body weight in healthy subjects and people with type 1 and type 2 diabetes mellitus. J Clin Endocrinol Metab 2003;88:2706–2713 [DOI] [PubMed] [Google Scholar]
- 4.Jones IR, Owens DR, Luzio S, Williams S, Hayes TM. The glucose dependent insulinotropic polypeptide response to oral glucose and mixed meals is increased in patients with type 2 (non-insulin-dependent) diabetes mellitus. Diabetologia 1989;32:668–677 [DOI] [PubMed] [Google Scholar]
- 5.Drucker DJ. The biology of incretin hormones. Cell Metab 2006;3:153–165 [DOI] [PubMed] [Google Scholar]
- 6.Ayala JE, Bracy DP, James FD, Julien BM, Wasserman DH, Drucker DJ. The glucagon-like peptide-1 receptor regulates endogenous glucose production and muscle glucose uptake independent of its incretin action. Endocrinology 2009;150:1155–1164 [DOI] [PMC free article] [PubMed] [Google Scholar]
- 7.Nikolaidis LA, Elahi D, Hentosz T, et al. Recombinant glucagon-like peptide-1 increases myocardial glucose uptake and improves left ventricular performance in conscious dogs with pacing-induced dilated cardiomyopathy. Circulation 2004;110:955–961 [DOI] [PubMed] [Google Scholar]
- 8.Nikolaidis LA, Elahi D, Shen Y-T, Shannon RP. Active metabolite of GLP-1 mediates myocardial glucose uptake and improves left ventricular performance in conscious dogs with dilated cardiomyopathy. Am J Physiol Heart Circ Physiol 2005;289:H2401–H2408 [DOI] [PubMed] [Google Scholar]
- 9.Johnson KMS, Edgerton DS, Rodewald T, et al. Intraportal GLP-1 infusion increases nonhepatic glucose utilization without changing pancreatic hormone levels. Am J Physiol Endocrinol Metab 2007;293:E1085–E1091 [DOI] [PubMed] [Google Scholar]
- 10.Zhao T, Parikh P, Bhashyam S, et al. Direct effects of glucagon-like peptide-1 on myocardial contractility and glucose uptake in normal and postischemic isolated rat hearts. J Pharmacol Exp Ther 2006;317:1106–1113 [DOI] [PubMed] [Google Scholar]
- 11.Yu M, Moreno C, Hoagland KM, et al. Antihypertensive effect of glucagon-like peptide 1 in Dahl salt-sensitive rats. J Hypertens 2003;21:1125–1135 [DOI] [PubMed] [Google Scholar]
- 12.Basu A, Charkoudian N, Schrage W, Rizza RA, Basu R, Joyner MJ. Beneficial effects of GLP-1 on endothelial function in humans: dampening by glyburide but not by glimepiride. Am J Physiol Endocrinol Metab 2007;293:E1289–E1295 [DOI] [PubMed] [Google Scholar]
- 13.Nyström T, Gutniak MK, Zhang Q, et al. Effects of glucagon-like peptide-1 on endothelial function in type 2 diabetes patients with stable coronary artery disease. Am J Physiol Endocrinol Metab 2004;287:E1209–E1215 [DOI] [PubMed] [Google Scholar]
- 14.Richter G, Feddersen O, Wagner U, Barth P, Göke R, Göke B. GLP-1 stimulates secretion of macromolecules from airways and relaxes pulmonary artery. Am J Physiol 1993;265:L374–L381 [DOI] [PubMed] [Google Scholar]
- 15.Golpon HA, Puechner A, Welte T, Wichert PV, Feddersen CO. Vasorelaxant effect of glucagon-like peptide-(7-36)amide and amylin on the pulmonary circulation of the rat. Regul Pept 2001;102:81–86 [DOI] [PubMed] [Google Scholar]
- 16.Barrett EJ, Eggleston EM, Inyard AC, et al. The vascular actions of insulin control its delivery to muscle and regulate the rate-limiting step in skeletal muscle insulin action. Diabetologia 2009;52:752–764 [DOI] [PMC free article] [PubMed] [Google Scholar]
- 17.Clark MG. Impaired microvascular perfusion: a consequence of vascular dysfunction and a potential cause of insulin resistance in muscle. Am J Physiol Endocrinol Metab 2008;295:E732–E750 [DOI] [PMC free article] [PubMed] [Google Scholar]
- 18.Ko S-H, Cao W, Liu Z. Hypertension management and microvascular insulin resistance in diabetes. Curr Hypertens Rep 2010;12:243–251 [DOI] [PMC free article] [PubMed] [Google Scholar]
- 19.Liu Z, Liu J, Jahn LA, Fowler DE, Barrett EJ. Infusing lipid raises plasma free fatty acids and induces insulin resistance in muscle microvasculature. J Clin Endocrinol Metab 2009;94:3543–3549 [DOI] [PMC free article] [PubMed] [Google Scholar]
- 20.Keske MA, Clerk LH, Price WJ, Jahn LA, Barrett EJ. Obesity blunts microvascular recruitment in human forearm muscle after a mixed meal. Diabetes Care 2009;32:1672–1677 [DOI] [PMC free article] [PubMed] [Google Scholar]
- 21.Inyard AC, Chong DG, Klibanov AL, Barrett EJ. Muscle contraction, but not insulin, increases microvascular blood volume in the presence of free fatty acid-induced insulin resistance. Diabetes 2009;58:2457–2463 [DOI] [PMC free article] [PubMed] [Google Scholar]
- 22.Inyard AC, Clerk LH, Vincent MA, Barrett EJ. Contraction stimulates nitric oxide independent microvascular recruitment and increases muscle insulin uptake. Diabetes 2007;56:2194–2200 [DOI] [PubMed] [Google Scholar]
- 23.Coggins M, Lindner J, Rattigan S, et al. Physiologic hyperinsulinemia enhances human skeletal muscle perfusion by capillary recruitment. Diabetes 2001;50:2682–2690 [DOI] [PubMed] [Google Scholar]
- 24.Chai W, Wang W, Liu J, et al. Angiotensin II type 1 and type 2 receptors regulate basal skeletal muscle microvascular volume and glucose use. Hypertension 2010;55:523–530 [DOI] [PMC free article] [PubMed] [Google Scholar]
- 25.Nyström T. The potential beneficial role of glucagon-like peptide-1 in endothelial dysfunction and heart failure associated with insulin resistance. Horm Metab Res 2008;40:593–606 [DOI] [PubMed] [Google Scholar]
- 26.Li G, Barrett EJ, Wang H, Chai W, Liu Z. Insulin at physiological concentrations selectively activates insulin but not insulin-like growth factor I (IGF-I) or insulin/IGF-I hybrid receptors in endothelial cells. Endocrinology 2005;146:4690–4696 [DOI] [PubMed] [Google Scholar]
- 27.Li G, Barrett EJ, Ko S-H, Cao W, Liu Z. Insulin and insulin-like growth factor-I receptors differentially mediate insulin-stimulated adhesion molecule production by endothelial cells. Endocrinology 2009;150:3475–3482 [DOI] [PMC free article] [PubMed] [Google Scholar]
- 28.Vincent MA, Barrett EJ, Lindner JR, Clark MG, Rattigan S. Inhibiting NOS blocks microvascular recruitment and blunts muscle glucose uptake in response to insulin. Am J Physiol Endocrinol Metab 2003;285:E123–E129 [DOI] [PubMed] [Google Scholar]
- 29.Wang N, Ko S-H, Chai W, et al. Resveratrol recruits rat muscle microvasculature via a nitric oxide-dependent mechanism that is blocked by TNFα. Am J Physiol Endocrinol Metab 2011;300:E195–E201 [DOI] [PMC free article] [PubMed] [Google Scholar]
- 30.Vincent MA, Clerk LH, Lindner JR, et al. Microvascular recruitment is an early insulin effect that regulates skeletal muscle glucose uptake in vivo. Diabetes 2004;53:1418–1423 [DOI] [PubMed] [Google Scholar]
- 31.Holst JJ. The physiology of glucagon-like peptide 1. Physiol Rev 2007;87:1409–1439 [DOI] [PubMed] [Google Scholar]
- 32.Zeleznik AJ, Roth J. Demonstration of the insulin receptor in vivo in rabbits and its possible role as a reservoir for the plasma hormone. J Clin Invest 1978;61:1363–1374 [DOI] [PMC free article] [PubMed] [Google Scholar]
- 33.Tolessa T, Gutniak M, Holst JJ, Efendic S, Hellström PM. Inhibitory effect of glucagon-like peptide-1 on small bowel motility. Fasting but not fed motility inhibited via nitric oxide independently of insulin and somatostatin. J Clin Invest 1998;102:764–774 [DOI] [PMC free article] [PubMed] [Google Scholar]
- 34.Chai W, Wang W, Dong Z, Cao W, Liu Z. Angiotensin II receptors modulate muscle microvascular and metabolic responses to insulin in vivo. Diabetes 2011;60:2939–2946 [DOI] [PMC free article] [PubMed]
- 35.Honig CR, Odoroff CL, Frierson JL. Active and passive capillary control in red muscle at rest and in exercise. Am J Physiol 1982;243:H196–H206 [DOI] [PubMed] [Google Scholar]
- 36.Vincent MA, Clerk LH, Lindner JR, et al. Mixed meal and light exercise each recruit muscle capillaries in healthy humans. Am J Physiol Endocrinol Metab 2006;290:E1191–E1197 [DOI] [PubMed] [Google Scholar]
- 37.Scognamiglio R, Negut C, De Kreutzenberg SV, Tiengo A, Avogaro A. Postprandial myocardial perfusion in healthy subjects and in type 2 diabetic patients. Circulation 2005;112:179–184 [DOI] [PubMed] [Google Scholar]
- 38.Hattori Y, Jojima T, Tomizawa A, et al. A glucagon-like peptide-1 (GLP-1) analogue, liraglutide, upregulates nitric oxide production and exerts anti-inflammatory action in endothelial cells. Diabetologia 2010;53:2256–2263 [DOI] [PubMed] [Google Scholar]
- 39.Ye J, Gao Z, Yin J, He Q. Hypoxia is a potential risk factor for chronic inflammation and adiponectin reduction in adipose tissue of ob/ob and dietary obese mice. Am J Physiol Endocrinol Metab 2007;293:E1118–E1128 [DOI] [PubMed] [Google Scholar]
- 40.Hosogai N, Fukuhara A, Oshima K, et al. Adipose tissue hypoxia in obesity and its impact on adipocytokine dysregulation. Diabetes 2007;56:901–911 [DOI] [PubMed] [Google Scholar]
- 41.Ye J. Emerging role of adipose tissue hypoxia in obesity and insulin resistance. Int J Obes (Lond) 2009;33:54–66 [DOI] [PMC free article] [PubMed] [Google Scholar]
- 42.Yin J, Gao Z, He Q, Zhou D, Guo Z, Ye J. Role of hypoxia in obesity-induced disorders of glucose and lipid metabolism in adipose tissue. Am J Physiol Endocrinol Metab 2009;296:E333–E342 [DOI] [PMC free article] [PubMed] [Google Scholar]
- 43.Kim JA, Koh KK, Quon MJ. The union of vascular and metabolic actions of insulin in sickness and in health. Arterioscler Thromb Vasc Biol 2005;25:889–891 [DOI] [PubMed] [Google Scholar]
- 44.Kim JA, Montagnani M, Koh KK, Quon MJ. Reciprocal relationships between insulin resistance and endothelial dysfunction: molecular and pathophysiological mechanisms. Circulation 2006;113:1888–1904 [DOI] [PubMed] [Google Scholar]
- 45.Liu J, Jahn LA, Fowler DE, Barrett EJ, Cao W, Liu Z. Free fatty acids induce insulin resistance in both cardiac and skeletal muscle microvasculature in humans. J Clin Endocrinol Metab 2011;96:438–446 [DOI] [PMC free article] [PubMed] [Google Scholar]
- 46.Holst JJ, Vilsbøll T, Deacon CF. The incretin system and its role in type 2 diabetes mellitus. Mol Cell Endocrinol 2009;297:127–136 [DOI] [PubMed] [Google Scholar]


