Abstract
We have applied image analysis methods in the assessment of human kidney perfusion based on 3D dynamic contrast-enhanced (DCE) MRI data. This approach consists of 3D non-rigid image registration of the kidneys and fuzzy C-mean classification of kidney tissues. The proposed registration method reduced motion artifacts in the dynamic images and improved the analysis of kidney compartments (cortex, medulla, and cavities). The dynamic intensity curves show the successive transition of the contrast agent through kidney compartments. The proposed method for motion correction and kidney compartment classification may be used to improve the validity and usefulness of further model-based pharmacokinetic analysis of kidney function.
Keywords: non-rigid image registration, dynamic contrast enhanced (DCE) MRI, kidney, image classification
1. INTRODUCTION
The kidneys maintain normal homeostasis by filtering and excreting metabolic waste products, by regulating acid base balance, and by moderating blood pressure and fluid volume [1]. Renal diseases can lead to kidney failure that requires life-long dialysis or renal transplantation. Early detection and treatment can prevent this progression towards end stage renal disease. Therefore, it is important to monitor renal function precisely for the assessment of disease progression and follow-up of therapy. Dynamic contrast enhanced (DCE) magnetic resonance imaging (DCE-MRI) provides a promising non-invasive technique for the assessment of physiological parameters such as renal blood flow or glomerular filtration rate without the need of ionizing radiation [2]. In DCE-MRI, contrast agent Gd-DTPA is injected into the bloodstream. As the agent perfuse into the organ, the kidneys are imaged rapidly and repeatedly. During the perfusion, Gd- DTPA causes a change in the relaxation time of the tissue and creates a contrast change in the images [3]. As a result, the patterns of the contrast change provide functional information, while MRI provides good anatomical information which helps in distinguishing the diseases that affect different regions of the kidneys [4]. One of the major advantages of DCE-MRI lies in the separable assessment of perfusion and filtration parameters for each kidney while blood tests just deliver global data [5].
A major problem in abdominal imaging is motion artifacts due to respiration [2, 6–9]. Various methods have been proposed to reduce the motion artifacts [6]. Various image registration methods have been applied to the abdominal images [10–15]. The goal of this study is to evaluate non-rigid registration and classification methods to improve DCE-MRI image quantification.
2. METHODS
DCE-MRI assesses the signal dynamics caused by contrast material transit through the renal cortex, medulla and the collecting system [16]. This technique implies the administration of gadolinium containing contrast agents, which enter the capillaries, are partly filtered in the glomeruli, then pass through the renal tubules or are evacuated by the veins. By analyzing the contrast enhancement as a function of time, several clinically relevant parameters such as blood flow, blood volume, mean transit times and glomerular filtration can be derived [17–19]. Our assessment method consists of four major steps: (1) Preprocess and select one 3D volume as the reference, and then register other volumes to this reference; (2) Manually segment left and right kidneys in the reference volume; (3) Classify segmented kidneys into three classes (cortex, medulla, and cavities). (4) Apply the three-class object maps to all registered volumes and perform assessment of time courses. Figure 1 shows typical DCE-MRI images at different time courses. The image intensity of the kidneys increase and then reduce along capturing time. The variety indicates perfusion and filtration function of the kidney.
Figure 1.

DCE-MRI images at different time points.
Motion correction of abdominal DCE-MRI time series is a challenge. Two types of motion and deformation present and are visible in the images. The first type is the motion and deformation of tissue as a result of respiration, while the second is the motion of the contrast agent. To correct motion resulting from breathing, the registration method needs to be unaffected by intensity changes caused by the accumulation and excretion of the contrast agent.
The demons algorithm is an automatic non-rigid image registration algorithm, accounting for non-rigid deformation of the subject by means of a diffusion model [20, 21]. Demons forces are estimated using the optical flow formula. An improved demon algorithm [22] with a much better efficiency was exploited in our study and it has an adaptive force strength adjustment during the iterative process. A slight adaptation of the algorithm makes the registration edge-emphasized by using the edge strength of the image to control the optical flow in different regions. By emphasizing the edges, the smoothing/noise-removing effect caused by the dataset estimation will minimize the effects of texture distortion in the registered images. A normalization factor proposed by [23] allows the force strength to be adjusted adaptively over different iterations to determine the scale of deformation.
For each voxel, The energy function to minimize in the case of the demons registration algorithm, between a registered image f (floating image) and a truth image r (reference image), is described as follows:
| (1) |
where Ir and If are the intensities of the same voxel in the respective images r and f, ∇ is the gradient operator and u is the estimated displacement (update velocity). β is the normalization factor. It is noted that the demons registration algorithm is a local approximation, thus it is performed for a certain number of iterations until the solution converges; the displacement vector u is updated in each iteration so that any deformation in the image are accounted for progressively. In our experiments, the number of iterations is set to be 100 to ensure convergence, but if the energy function falls below a certain threshold in any iteration, the algorithm is terminated immediately since an optimized solution is found. The similarity measure used here is the squared pixel distance, with squared gradient of the transformation field being set as the smoothness regularization.
The optical flow equation for finding small deformations is used as the basis for demons registration [24]. The optical flow equation defines how the registration forces act on the image to account for deformation. The estimated displacement u required for a point in the reference image r to match a point in the floating image f is given by:
| (2) |
The first term in (2) is derived directly from (1) given that the error gradient is zero where the error is at a minimum. In [25], the velocity formula contained only the first term in (2) without the constant, which uses only edges in the reference image as the passive internal force. It is based on pixel velocities caused by edge based forces. The term in the denominator serves to make the velocity equation more stable in image registration. To regularize the deformation field, Gaussian smoothing is performed on the velocity field since the estimated displacement obtained is local. The second term in (2) is then introduced in [22] to improve registration convergence efficiency and robustness. The resulting pixel velocity transformation field is filtered by a Gaussian kernel for global registration. The demons are responsible for applying force vectors on the deformable grid in moving images. Based on the location of the grid point in moving images with respect to the contours in fixed images, the demons decide the direction of the force vectors. Iteratively, the force created by the demons cause motion that is applied to the model. As the model draws closer to the contours, the forces applied decreases gradually after each iteration. At convergence, the determined deformation field in moving images is applied to warp into fixed images.
For the DCE-MRI images, each of the epochs provides a 3D volume which is registered to a pre-determined base 3D volume. For the fixed volume we first segment cavities manually and then use fuzzy C-mean classification methods [26–29] to class cortex and medulla. Finally we apply three classes object maps to all registered volumes and perform assessment of time courses. The conventional FCM algorithm is an iterative method that produces an optimal c partition for the image by minimizing the weighted intergroup sum of squared error objective function FCM
| (3) |
where is the characterized intensity center of the class k, and c is the number of underlying tissue types in the image which is given before classification. The uik represents the possibility of the voxel i belonging to the class k and it is required that uik ∈ [0,1] and for any voxel i.
3. RESULTS
Highly accelerated renal perfusion imaging was developed allowing high frequency imaging during the first-pass of 0.05 mmol/kg ProHance using a 3D spoiled gradient echo technique with fat saturation and centric-radial k-space acquisition using a 430 mm2 FOV, TR=3.7ms, TE=1.7ms, flip=30°, 30 slices at 2.8 mm slice thickness, TFE factor = 120, 0.9 second per dynamic scan volume, and iPAT factor=2. A phased array 4-element surface flexible body wrap coil is used. The Gd is infused at a constant rate over 20s.
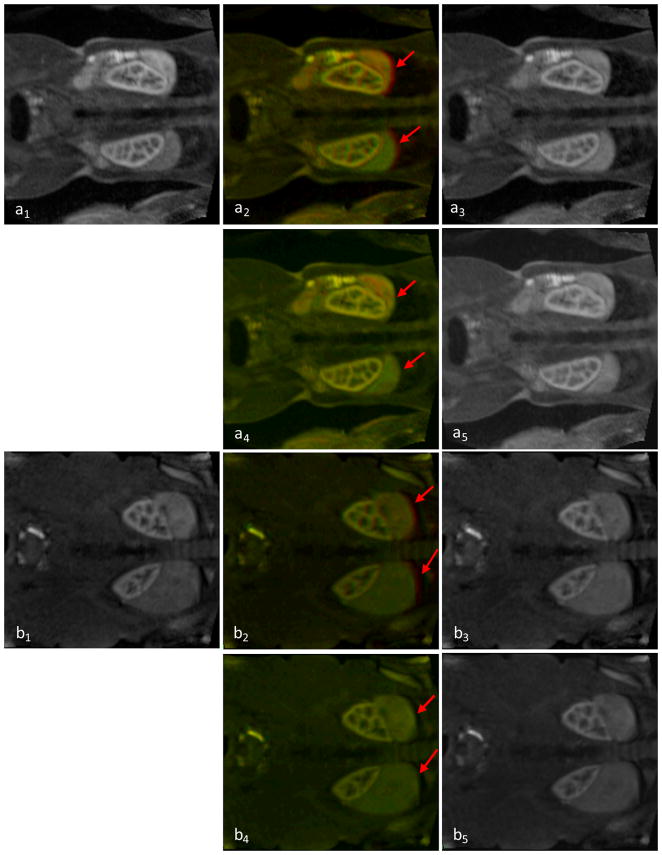
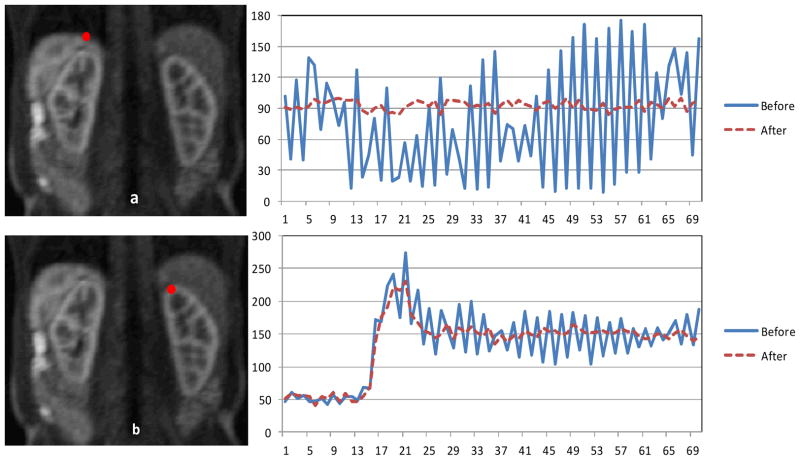
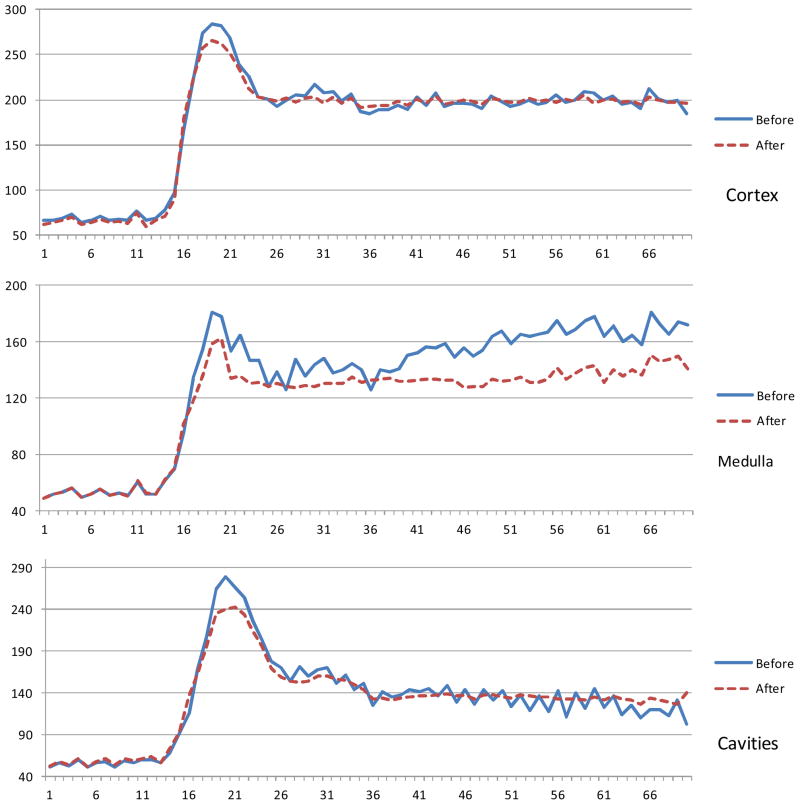
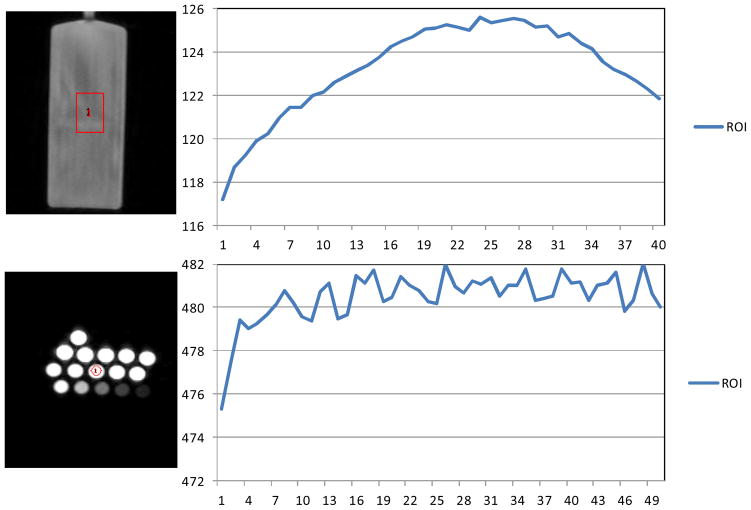
Figure 2 illustrates the visual assessment of the registration results at different time course. There is motion before registration, and if not corrected, the motion will introduce errors for the analysis of DCE-MR images. Figure 3 shows evaluation of the registration algorithm based on the comparison between the mean intensity time courses within a ROI before registration and after registration. Figure 4 indicates evaluation of the registration algorithm based on the comparison of the mean intensity time courses of cortex, medulla and cavities of the left kidney before and after registration. However, the curve is still not as smooth as we would expect. We first thought that registration may not be able to correct the motion. In order to explain this phenomenon we performed a phantom experiment without motion. We filled syringes and a bottle with Gd-DTPA and used them as phantoms. We used the same protocol to scan the phantoms. Figure 5 shows the intensity curves of two ROIs in two phantoms. There is still fluctuation in the time intensity curves even the phantoms did not have any motion. In MRI, signal-to-noise ratio (SNR) is trade-off with other image enhancements, such as higher resolution, shorter scan times [30, 31]. In our DCE-MRI, a 3D volume can be captured within one second and SNR in the images can be affected. MR intensity inhomogeneity affects the mean intensity in kidneys [24] [28]. Our phantom data show that motion may be one of the major factors but may not be the only factor that affect the quantification of DCE-MRI data.
Figure 2.
Visual assessment of DCE-MR images before and after registration. a1 and b1 are a slice of the original reference images from two patients. a2 and b2 are the fusion image before registration, a3 and b3 are the floating image before registration. a4 and b4 are the fusion image after registration, a5 and b5 are the registered image. Red arrows show that the motion before registration and the improvement after registration.
Figure 3.
Evaluation of the registration algorithm based on the comparison between the mean intensity time courses within a ROI before registration and after registration. ROI selection is depicted to the left of the time courses. The Y is the intensity and X is the time frame.
Figure 4.
Time intensity curves of the three classes () before and after registration. The curves become smooth because of registration. The Y is the intensity and X is the time frame.
Figure 5.
The time intensity curves (right) of the regions of interest (ROIs) in the phantoms without motion. The intensity curves are not as smooth as we would expect, indicating that motion may not be the only factor that affects the DEC-MRI data quantification. The Y is the intensity and X is the time frame.
4. DISCUSSION AND CONCLUSION
We applied a non-rigid image registration method to reduce motion artifacts in DCE-MRI data. We also applied a fuzzy C-mean classification to classify the kidney into three classes i.e. cortex, medulla, and cavities. The proposed image analysis approach can be used as a processing tool for kidney DCE-MRI quantification.
Acknowledgments
This research is supported in part by NIH grant R01CA156775 (PI: Fei), Georgia Cancer Coalition Distinguished Clinicians and Scientists Award (PI: Fei), Emory Molecular and Translational Imaging Center (NIH P50CA128301), and Atlanta Clinical and Translational Science Institute (ACTSI) that is supported by the PHS Grant UL1 RR025008 from the Clinical and Translational Science Award program.
References
- 1.Knoeppen SBBM. Renal Physiology - Mosby’s Physiology Monograph. 4. Elsevier; 2007. [Google Scholar]
- 2.Notohamiprodjo M, Sourbron S, Staehler M, et al. Measuring perfusion and permeability in renal cell carcinoma with dynamic contrast-enhanced MRI: a pilot study. Journal of Magnetic Resonance Imaging. 2010;31(2):490–501. doi: 10.1002/jmri.22028. [DOI] [PubMed] [Google Scholar]
- 3.Yuksel SE, El-Baz A, Farag AA, et al. Automatic detection of renal rejection after kidney transplantation. CARS 2005: Computer Assisted Radiology and Surgery. 2005;1281:773–778. [Google Scholar]
- 4.Yuksel SE, El-Baz A, Farag AA, et al. A kidney segmentation framework for Dynamic Contrast Enhanced Magnetic Resonance Imaging. Journal of Vibration and Control. 2007;13:1505–1516. [Google Scholar]
- 5.Notohamiprodjo M, Reiser MF, Sourbron SP. Diffusion and perfusion of the kidney. European Journal of Radiology. 2010;76(3):337–47. doi: 10.1016/j.ejrad.2010.05.033. [DOI] [PubMed] [Google Scholar]
- 6.de Senneville BD, Mendichovszky IA, Roujol S, et al. Improvement of MRI-functional measurement with automatic movement correction in native and transplanted kidneys. Journal of Magnetic Resonance Imaging. 2008;28(4):970–8. doi: 10.1002/jmri.21515. [DOI] [PubMed] [Google Scholar]
- 7.Attenberger UI, Sourbron SP, Michaely HJ, et al. Retrospective respiratory triggering renal perfusion MRI. Acta Radiologica. 2010;51(10):1163–71. doi: 10.3109/02841851.2010.519717. [DOI] [PubMed] [Google Scholar]
- 8.Li S, Zollner FG, Merrem AD, et al. Wavelet-based segmentation of renal compartments in DCE-MRI of human kidney: Initial results in patients and healthy volunteers. Comput Med Imaging Graph. 2011 doi: 10.1016/j.compmedimag.2011.06.005. (Epub ahead of print) [DOI] [PubMed] [Google Scholar]
- 9.Massoud C, Taourel P, Goze-Bac C, et al. Evaluation of glomerular filtration rate with magnetic resonance imaging. Journal De Radiologie. 2011;92(5):369–381. doi: 10.1016/j.jradio.2011.03.009. [DOI] [PubMed] [Google Scholar]
- 10.Fei BW, Duerk JL, Sodee DB, et al. Semiautomatic nonrigid registration for the prostate and pelvic MR volumes. Academic Radiology. 2005;12(7):815–824. doi: 10.1016/j.acra.2005.03.063. [DOI] [PubMed] [Google Scholar]
- 11.Fei B, Kemper C, Wilson DL. A comparative study of warping and rigid body registration for the prostate and pelvic MR volumes. Computerized Medical Imaging and Graphics. 2003;27(4):267–281. doi: 10.1016/s0895-6111(02)00093-9. [DOI] [PubMed] [Google Scholar]
- 12.Kaus MR, Brock KK, Pekar V, et al. Assessment of a model-based deformable image registration approach for radiation therapy planning. Int J Radiat Oncol Biol Phys. 2007;68(2):572–580. doi: 10.1016/j.ijrobp.2007.01.056. [DOI] [PubMed] [Google Scholar]
- 13.Fei B, Lee S, Boll D, et al. Image Registration and Fusion for Interventional MRI Guided Thermal Ablation of the Prostate Cancer. Medical Image Computing And Computer-Assisted Intervention (MICCAI 2003) - Lecture Notes in Computer Science. 2011;2879:364–372. [Google Scholar]
- 14.Fei B, Lee Z, Boll DT, et al. Registration and fusion of SPECT, high-resolution MRI, and interventional MRI for thermal ablation of prostate cancer. Ieee Transactions on Nuclear Science. 2004;51(1):177–183. [Google Scholar]
- 15.Fei B, Flask C, Wang H, et al. Image Segmentation, Registration and Visualization of Serial MR Images for Therapeutic Assessment of Polycystic Kidney Disease in Transgenic Mice. Conf Proc IEEE Eng Med Biol Soc. 2005;1:467–9. doi: 10.1109/IEMBS.2005.1616448. [DOI] [PubMed] [Google Scholar]
- 16.Grenier N, Basseau F, Ries M, et al. Functional MRI of the kidney. Abdom Imaging. 2003;28(2):164–75. doi: 10.1007/s00261-001-0183-8. [DOI] [PubMed] [Google Scholar]
- 17.Sourbron SP, Michaely HJ, Reiser MF, et al. MRI-measurement of perfusion and glomerular filtration in the human kidney with a separable compartment model. Investigative Radiology. 2008;43(1):40–48. doi: 10.1097/RLI.0b013e31815597c5. [DOI] [PubMed] [Google Scholar]
- 18.Bokacheva L, Rusinek H, Zhang JL, et al. Estimates of glomerular filtration rate from MR renography and tracer kinetic models. Journal of Magnetic Resonance Imaging. 2009;29(2):371–82. doi: 10.1002/jmri.21642. [DOI] [PMC free article] [PubMed] [Google Scholar]
- 19.Hackstein N, Kooijman H, Tomaselli S, et al. Glomerular filtration rate measured using the Patlak plot technique and contrast-enhanced dynamic MRI with different amounts of gadolinium-DTPA. Journal of Magnetic Resonance Imaging. 2005;22(3):406–414. doi: 10.1002/jmri.20401. [DOI] [PubMed] [Google Scholar]
- 20.Thirion JP. Non-Rigid Matching Using Demons. Proceedings of IEEE CVPR96. 1996;1:245–251. [Google Scholar]
- 21.Thirion JP, Subsol G, Dean D. Cross validation of three inter-patients matching methods. Visualization in Biomedical Computing. 1996;1131:327–336. [Google Scholar]
- 22.Wang H, Dong L, O’Daniel J, et al. Validation of an accelerated ‘demons’ algorithm for deformable image registration in radiation therapy. Phys Med Biol. 2005;50(12):2887–905. doi: 10.1088/0031-9155/50/12/011. [DOI] [PubMed] [Google Scholar]
- 23.Pennec X, Cachier P, Ayache N. Understanding the “Demon’s Algorithm”: 3D non-rigid registration by gradient descent. Medical Image Computing and Computer-Assisted Intervention, Miccai’99, Proceedings; 1999. pp. 597–605. [Google Scholar]
- 24.Yang X, Fei B. A MR Brain Classification Method Based on Multiscale and Multiblock Fuzzy C-Means. 2011; International Conference on Bioinformatics and Biomedical Engineering (iCBBE); 2011. pp. 1–4. [DOI] [PMC free article] [PubMed] [Google Scholar]
- 25.TJP Image matching as a diffusion process: an analogy with Maxwell’s demons. Medical Image Analysis. 1998;2(3):243–260. doi: 10.1016/s1361-8415(98)80022-4. [DOI] [PubMed] [Google Scholar]
- 26.Wang HS, Fei BW. A modified fuzzy C-means classification method using a multiscale diffusion filtering scheme. Medical Image Analysis. 2009;13(2):193–202. doi: 10.1016/j.media.2008.06.014. [DOI] [PMC free article] [PubMed] [Google Scholar]
- 27.Wang H, Feyes D, Mulvihil J, Fei B, et al. Multiscale fuzzy C-means image classification for multiple weighted MR images for the assessment of photodynamic therapy in mice. Proceedings of SPIE. 2007;6512:65122W. doi: 10.1117/12.710188. [DOI] [PMC free article] [PubMed] [Google Scholar]
- 28.Yang X, Fei B. A multiscale and multiblock fuzzy C-means classification method for brain MR images. Med Phys. 2011;38(6):2879–91. doi: 10.1118/1.3584199. [DOI] [PMC free article] [PubMed] [Google Scholar]
- 29.Kroon DJ, Slump CH. MRI modalitiy transformation in demon registration. IEEE International Symposium on Biomedical Imaging: From Nano to Macro; 2009. pp. 963–966. [Google Scholar]
- 30.Yang X, Fei B. A wavelet multiscale denoising algorithm for magnetic resonance (MR) images. Measurement Science and Technology. 2011;22(2):025803–15. doi: 10.1088/0957-0233/22/2/025803. [DOI] [PMC free article] [PubMed] [Google Scholar]
- 31.Moseley ME, Liu C, Rodriguez S, et al. Advances in magnetic resonance neuroimaging. Neurol Clin. 2009;27:1–19. 2009. doi: 10.1016/j.ncl.2008.09.006. [DOI] [PMC free article] [PubMed] [Google Scholar]


