Abstract
Patient-specific simulation of heart (dys)function aimed at personalizing cardiac therapy are hampered by the absence of in vivo imaging technology for clinically acquiring myocardial fiber orientations. In this research, we develop a methodology to predict ventricular fiber orientations of a patient heart, given the geometry of the heart and an atlas. We test the methodology by comparing the estimated fiber orientations with measured ones, and by quantifying the effect of the estimation error on outcomes of electrophysiological simulations, in normal and failing canine hearts. The new insights obtained from the project will pave the way for the development of patient-specific models of the heart that can aid physicians in personalized diagnosis and decisions regarding electrophysiological interventions.
I. INTRODUCTION
The computational approach is becoming an essential tool in the comprehensive understanding of the function of the heart in health and disease. Whole-heart simulations today are based on cardiac models that describe the geometry and fibrous structure derived from representative hearts [1]. However, for the computational approach to be directly applicable in the clinical environment, it is imperative that the models be patient-specific, i.e. the models must be based on the specific architecture and electrophysiological or electromechanical properties of the patient’s diseased heart. Simulation with such models will aid physicians to arrive at highly personalized decisions for electrophysiological interventions as well as prophylaxis, thereby dramatically improving cardiac health care.
Creation of realistic cardiac models requires the acquisition of the geometry and fiber structure of a patient heart. With recent advances in medical imaging, it is now feasible to acquire the geometry of a patient heart, including structural remodeling such as infarction, in vivo with high resolution using magnetic resonance imaging (MRI) and computed tomography (CT) technologies. However, there is no practical method for acquiring fiber structure of a patient heart in vivo. Diffusion tensor (DT) MRI, the only technique to acquire fiber orientations of the intact heart, is not widely available in vivo due to certain limitations [2]. Thus difficulties in acquiring cardiac fiber structure in vivo presently impede the application of electrophysiological and electromechanical cardiac simulations in clinical setting. The objective of this research was to directly address this need.
We hypothesize that ventricular fiber orientations of a heart can be accurately predicted given the geometry of the heart and an atlas, where the atlas is a heart whose geometry and fiber orientations are available. Accordingly, we use state of the art techniques to develop a methodology for estimation of cardiac fiber orientations in vivo, and test the hypothesis. We evaluate the performance of the proposed methodology by quantifying the estimation error, and measuring the effect of this error on local electrical activation maps obtained from simulations of sinus rhythm.
II. METHODS
A. Methodology for Myocardial Fiber Orientations Estimation
The central idea of our fiber estimation methodology is to exploit similarities in fiber orientations, relative to geometry, between different hearts in order to approximate the fiber structure of a heart for which only the geometry information is available. In the following subsections, we describe the proposed methodology by demonstrating how the estimation was performed for an example patient who was scanned using in vivo CT.
1) Atlas Ventricular Geometry and Fiber Orientations Reconstruction
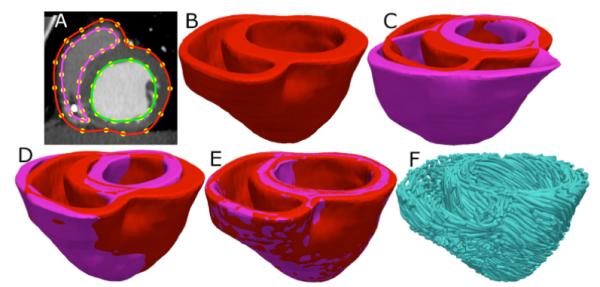
Geometry and fiber orientations of the atlas were extracted from raw data acquired ex vivo using high resolution (0.4297×0.4297×1mm3) structural MRI and DTMRI of a normal human heart, respectively [3]. From the acquired structural image, only the ventricular myocardium of the atlas was extracted by fitting, for each short-axis slice, closed splines through a set of landmark points placed semiautomatically along the epicardial and endocardial boundaries in the slice (Fig. 1A). The placement of landmark points was performed manually for a number of slices that are evenly distributed, with an inter-slice spacing of about 10mm in the image. The landmark points for the remaining slices were obtained automatically by linearly interpolating the manually identified points. A generic mathematical formulation of this interpolation technique has been reported elsewhere [3], where this technique was used for identifying the atrio-ventricular boundary in an ex-vivo structural MR heart image. Figs. 1B and 1C show the 3D geometry and fiber orientations of the extracted atlas ventricles
Fig. 1.

Geometry and fiber orientations of the atlas ventricles. (A) The epicardial (red) and endocardial (green and magenta) splines, and corresponding landmarks (yellow) overlaid on an examples slice of the atlas image. (B) The atlas ventricles in 3D. (C) The atlas fiber orientations.
2) Patient Ventricular Geometry Reconstruction
Ventricular geometry of the patient heart was reconstructed from an in vivo CT image using a segmentation method that is similar to the one used for the atlas. However, the patient image was re-sampled prior to reconstruction such that the in-plane resolution was 0.4297×0.4297mm3 as in the atlas. Similarly, the number of slices for which landmarks are manually picked, and the interval of out-of-plane interpolation were adjusted so that the segmented patient heart image had a slice thickness of 1mm. Fig. 2, panels A and B illustrate the patient ventricular geometry reconstruction.
Fig. 2.

Application of the fiber orientation estimation methodology to an example patient heart image. (A) The epicardial (red) and endocardial (green and magenta) splines, and corresponding landmarks (yellow) overlaid on an image slice. (B) patient ventricles in 3D. (C) Superimposition of ventricles of atlas (magenta, see Fig. 1B) and patient. (D) Patient ventricles and the affine transformed atlas ventricles. (E) Patient ventricles and LDDMM-transformed atlas ventricles. (F) Estimated patient ventricular fiber orientations.
3) Atlas Ventricular Geometry Deformation
Following the reconstruction of the patient ventricles, the atlas ventricular image was deformed to match the patient geometry image, in two steps. The first step was a 3D affine transformation based on a set of manually identified landmark points including the apex and RV insertion points, as illustrated in Fig. 2, C and D. In the second step, the affine-transformed atlas ventricles were further deformed to match the patient geometry, using large deformation diffeomorphic metric mapping (LDDMM). LDDMM is a non-linear image registration algorithm which computes diffeomorphic transformations between images [4]. Fig 2E illustrates the LDDMM transformation of the atlas to match the patient geometry; the match is remarkable.
4) Atlas Ventricular Fiber Orientations Deformation
In the final phase, the transformation matrix of the affine matching and the deformation field of the LDDMM transformation were applied in sequence to morph the DTMR image of the atlas to obtain an estimate of the patient ventricular fiber orientations. The morphing of the atlas DTMR image consisted of spatial re-positioning of image voxels in accordance with the spatial transformation of the geometry images, and re-orientation of the DTs. The re-orientation of the DTs was performed by using the preservation of principal directions method [5]. The estimate of the patient fiber orientations was obtained from the morphed atlas DTMR image by computing the primary eigenvector of the DTs. Fig. 2F illustrates a streamlined visualization of the estimated fiber orientations in the patient ventricles.
B. Measurement of Estimation Error and Its Effect on Predicting Electrophysiological Activity
We tested our methodology on several hearts whose baseline fiber orientations were acquired ex vivo with DTMRI. Due to the unavailability of human hearts, these tests were performed on canine hearts. Ventricles segmented from a total of six normal and three failing canine hearts, all of which were scanned with DTMRI at a resolution of 312.5×312.5×800μm3 were used. These datasets have been employed in a previous study [6] where the data acquisition techniques are also described. In the following, ventricales segmented from normal hearts are reffered to as hearts 1 through 6, and those segmented from failing hearts as hearts 7 through 9.
To determine if the estimation is accurate in the structurally normal ventricles, five differnet estimates of ventricular fiber orientations of heart 1 were obtained by using each of hearts 2 to 6 as an atlas. To test the accuracy of our methodology in the structurally remodeled ventricles, fiber orientations for each of the failing ventricles were estimated using heart 1 as the atlas.
1) Measurement of Fiber Orientation Estimation Error by Comparing Inclination Angles
Fiber orientations are typically characterized using inclination angles [7] following the tradition of histology, where angular measurements are performed on tissue sections that are cut parallel to epicardial surface. Accordingly, we computed the error in the estimated fiber orientations as the absolute difference between inclination angles of estimated orientations and DTMRI-derived orientations. The technique presented in Scollan et al. [7] was used to calculate inclination angles.
2) Quantification of Effects of Error on Outcomes of Electrophysiological Simulations
From heart 1, six computational meshes, one with the DTMRI-acquired fiber orientations of heart 1 (reffered to as model 1), and five with the five estimated fiber orientations datasets (models 2 to 6), were constructed. For each of the three failing heart geometries, two computational meshes, one with the DTMRI-acquired fiber orientations and the other with the estimated fiber orientatations were also constructed. The heart failure models with DTMRI-acquired fibers were denoted as models 7 to 9, and those with estimated fibers as models 10 to 12. Our methodology for construction of heart meshes given segmented geometry and fiber orientations has been reported in our previous publication [3].
Mathematical description of cardiac tissue in our simulations was based on the monodomain representation [8]. Passive tissue properties in the normal canine models were characterized with anisotropic conductivities using values by Roberts et al. [9]. The myocyte memberane kinetics was represented by the Greenstein-Winsslow (GW) ionic model of the canine ventricular myocyte [10]. In failing canine models, the GW ionic model was modified by downregulating the K channels Ito, IK1, and IKs by 66% 32%, and 66%, respectively, [11] and SERCA pump by 54% [12]. Electrical conductivities in failing models were also decreased by 30% following studies that show a 30% decrease in Cx43 expression which controls passage of current from one cell to the next [13].
Sinus rhythm was simulated in all generated models. To replicate activation originating from the Purkinje network during sinus rhythm, the ventricles were activated at multiple locations along the endocardial surfaces of the LV and RV free walls [14]. Appropriate timings and locations of the stimuli were chosen such that the resultant 3D electrical propagation matched with experimental data [15].
III. RESULTS
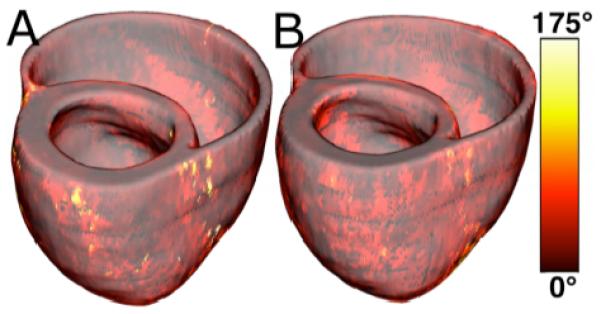
Fig. 3A illustrates, overlaid on the geometry of heart 1, the myocardial distribution of error in normal hearts’ inclination angles, averaged across all five esimates. Fig. 3B shows the mean distribution of error in failing hearts’ inclination angles, overlaid on the geometry of heart 1. Note that the averaging was performed based on the anatomical correspondence obtained from affine and LDDMM transformations. It was found that the mean error, averaged across all estimated datasets, and all image voxels thar belonged to the myocardium, were 14.4 ° and 16.9 ° in normal and failing cases, respectively. The mean error of normal and failing cases combined was 15.4 °.
Fig. 3.

Validation of the fiber orientation estimation methodology by comparing estimated fiber orientations with DTMR-derived orientations. (A) Distribution of mean estimation error in normal hearts. (B) Distribution of mean estimation error in failing hearts.
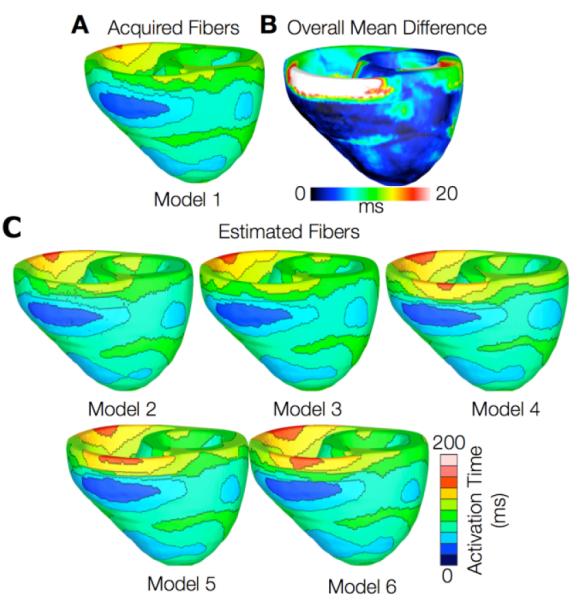
Figs. 4 and 5 present the simulated activation maps of one beat of the sinus rhythm ventricular activatition in normal and failing models, respectively. In both normal and failing hearts, the activation maps in models with acquired fiber orientations match well experimental activation maps [14], with the earliest epicardial activation at the anterior base, anterior apex, and LV free wall. Models with estimated fiber orientations produce activation maps very similar to those of models with acquired orientations; the earliest epicardial activations occur at the same sites, and the directions of propagation match as well. Among the normal ventricles, the total activation time of model 1 was 151ms, while for models 2 to 6, the mean total activation time was 154ms. The overall mean difference in total activation times between the acquired and estimated cases in the normal ventricular models was 5.7ms, which is a small fraction (3.7%) of the total activation time. Fig. 4B indicates that regions with highest differences in local activation times in normal hearts are near the base.
Fig. 4.

Results from one beat of simulations of sinus rhythm in normal canine hearts. (A) Simulated activation map with acquired fiber orientations (model 1). (B) Absolute difference between simulated activation map with acquired fiber orientations and that with estimated fiber orientations, averaged over the five estimates. (C) Simulated activation maps with estimated fiber orientations (models 2-6)
Fig. 5.

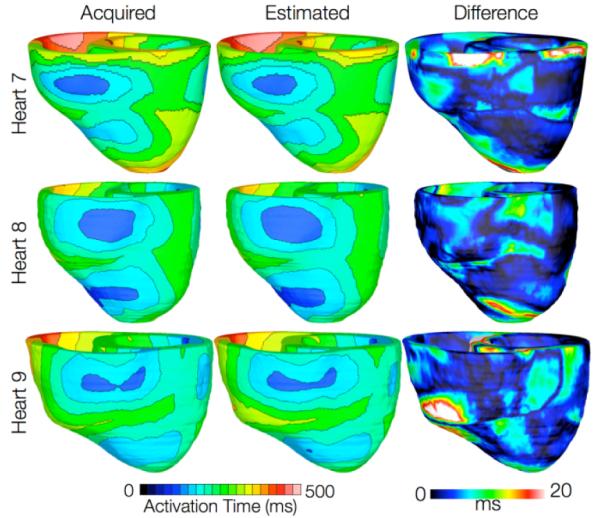
Results from simulations of one beat of sinus rhythm in failing heart models. In the first column, rows 1-3 show simulated activation maps with models 7-9, respectively. In the second column, rows 1-3 display results of simulations with models 10-12, respectively. Rows 1-3 in the third column illustrate the absolute difference between the activation maps shown in the first and second columns of the corresponding row.
In simulations of ventricular activation in sinus rhythm with failing heart models, total activation times for models 7-9 were 183, 144, and 166 ms, respectively, while for models 10-12, they were 187, 139, and 162ms, respectively. The total activation times in the failing heart models are longer than those in normal heart models due to the lower tissue conductivity values in heart failure. The failing hearts were also on average 29% larger than normal hearts by ventricular wall volume, resulting in longer paths for wavefront propagation and thus longer total activation times. The mean difference in total activation times between heart failure models with acquired and estimated fiber orientations was only 5.2ms (3.1%). These results indicate that the outcomes of simulation of ventricular activation in sinus rhythm in normal and failing canine heart models with fiber orientations estimated with the present methodology closely match those with acquired orientations.
IV. CONCLUSION
The goal of this project was to develop a methodology for estimating ventricular fiber orientations from in-vivo images of ventricular geometry, and to assess the accuracy of the estimation. Estimation was performed in normal and failing hearts. Our results show that predicted fiber orientations closely match those acquired by ex-vivo DTMR, the state-of-the-art technique, and that activation maps generated by simulations of sinus rhythm using estimated fiber orientations are not significantly different from those using acquired fiber orientations. This research demonstrates quantitatively that, in the absence of DTMR, myocardial fiber orientations can be estimated from in-vivo images of ventricular geometry for use in simulations of cardiac electrophysiology and electromechanics. The proposed methodology is applicable to both MR and CT clinical in vivo images of ventricular geometry, addressing the lack of ability to directly acquire patient fiber orientations.
In the past, rule-based methods, which predict fiber orientations using mathematical functions have been proposed [16]. But how well these idealized rules of myocyte orientation quantitatively correlate with true anatomy in normal and diseased hearts remains unknown. Also, Sundar et al. presented a technique to estimate fiber orientations via an elastic image transformation of an atlas heart [17]. However, they did not measure the effect of error in their estimated fiber orientations on simulations of cardiac function. Our research addresses the limitations of previous studies, and is thus an important step toward the development of personalized cardiac models for clinical applications. It must be noted, however, that the proposed methodology produces a nonnegligible amount of estimation error (~15°), and may not be applicable in the presence of diseases that cause fiber disarray, e.g. hypertrophy and ischemia.
ACKNOWLEDGMENT
We thank Drs. Raimond Winslow, Elliot McVeigh, and Patrick Helm at Johns Hopkins University for providing the human and the canine datasets.
This research was supported by NIH grants R01-HL091036 and R01-HL082729, and NSF grant CBET-0933029.
Contributor Information
Fijoy Vadakkumpadan, Department of Biomedical Engineering, Johns Hopkins University, Baltimore, MD 21218 USA (phone: 443-912-3241; fax: 410-502-9814;fijoy@jhu.edu).
Hermenegild Arevalo, Department of Biomedical Engineering, Johns Hopkins University, Baltimore, MD 21218 USA (hareval1@jhmi.edu).
Can Ceritoglu, Department of Biomedical Engineering, Johns Hopkins University, Baltimore, MD 21218 USA (can@cis.jhu.edu).
Michael Miller, Department of Biomedical Engineering, Johns Hopkins University, Baltimore, MD 21218 USA (mim@cis.jhu.edu).
Natalia Trayanova, Department of Biomedical Engineering, Johns Hopkins University, Baltimore, MD 21218 USA (ntrayanova@jhu.edu).
REFERENCES
- [1].Trayanova N. Whole heart modeling: Applications to cardiac electrophysiology and electromechanics. Circulation Research. 2011;108:113–128. doi: 10.1161/CIRCRESAHA.110.223610. [DOI] [PMC free article] [PubMed] [Google Scholar]
- [2].Sosnovik DE, Wang R, Dai G, Reese TG, Wedeen VJ. Diffusion mr tractography of the heart. Journal of Cardiovascular Magnetic Resonance. 2009;11:47–61. doi: 10.1186/1532-429X-11-47. [DOI] [PMC free article] [PubMed] [Google Scholar]
- [3].Vadakkumpadan F, Arevalo H, Prassl AJ, Chen J, Kickinger F, et al. Image-based models of cardiac structure in health and disease. Wiley Interdisciplinary Reviews: Systems Biology and Medicine. 2010;2:489–506. doi: 10.1002/wsbm.76. [DOI] [PMC free article] [PubMed] [Google Scholar]
- [4].Beg MF, Miller MI, Trouve A. Computing large deformation metric mappings via geodesic flows of diffeomorphisms. International Journal of Computer Vision. 2005;61:139–157. [Google Scholar]
- [5].Alexander DC, Pierpaoli C, Basser PJ, Gee JC. Spatial transformations of diffusion tensor magnetic resonance images. IEEE Transactions on Medical Imaging. 2001;20:1131–1139. doi: 10.1109/42.963816. [DOI] [PubMed] [Google Scholar]
- [6].Helm PA, Younes L, Beg MF, Ennis DB, Leclercq C, et al. Evidence of structural remodeling in the dyssynchronous failing heart. Circulation Research. 2006;98:125–132. doi: 10.1161/01.RES.0000199396.30688.eb. [DOI] [PubMed] [Google Scholar]
- [7].Scollan DF, Holmes A, Winslow R, Forder J. Histological validation of myocardial microstructure obtained from DTMRI. American Journal of Physiology - Heart and Circulatory Physiology. 1998;275:H2308–H2318. doi: 10.1152/ajpheart.1998.275.6.H2308. [DOI] [PubMed] [Google Scholar]
- [8].Plank G, Zhou L, Greenstein JL, Plank G, Zhou L, et al. From mitochondrial ion channels to arrhythmias in the heart: Computational techniques to bridge the spatio-temporal scales. Philosophical Transactions Series A, Mathematical, Physical, and Engineering Sciences. 2008;366:3381–3409. doi: 10.1098/rsta.2008.0112. [DOI] [PMC free article] [PubMed] [Google Scholar]
- [9].Roberts DE, Scher AM. Effect of tissue anisotropy on extracellular potential fields in canine myocardium in situ. Circulation Research. 1982;50:342–351. doi: 10.1161/01.res.50.3.342. [DOI] [PubMed] [Google Scholar]
- [10].Greenstein J, Wu R, Po S, Tomaselli GF, Winslow RL. Role of the calcium-independent transient outward current i(to1) in shaping action potential morphology and duration. Circulation Research. 2000;87:1026–1033. doi: 10.1161/01.res.87.11.1026. [DOI] [PubMed] [Google Scholar]
- [11].Li GR, Lau CP, Ducharme A, Tardif JC, Nattel S. Transmural action potential and ionic current remodeling in ventricles of failing canine hearts. American Journal of Physiology - Heart and Circulatory Physiology. 2002;283:H1031–H1041. doi: 10.1152/ajpheart.00105.2002. [DOI] [PubMed] [Google Scholar]
- [12].O’Rourke B, Kass D, Tomaselli G, Kaab S, Tunin R, et al. Mechanisms of altered excitation-contraction coupling in canine tachycardi-induced heart failure, i: Experimental studies. Circulation Research. 1999;84:562–570. doi: 10.1161/01.res.84.5.562. [DOI] [PubMed] [Google Scholar]
- [13].Akar F, Nass R, Hahn S, Cingolani E, Shah M, et al. Dynamic changes in conduction velocity and gap junction properties during development of pacing-induced heart failure. American Journal of Physiology - Heart and Circulatory Physiology. 2007;293:H1223–H1230. doi: 10.1152/ajpheart.00079.2007. [DOI] [PubMed] [Google Scholar]
- [14].Gurev V, Constantino J, Rice JJ, Trayanova N. Distribution of electromechanical delay in the ventricles:Insights from a 3d electromechanical model of the heart. Biophysical Journal. 2010;99:745–754. doi: 10.1016/j.bpj.2010.05.028. [DOI] [PMC free article] [PubMed] [Google Scholar]
- [15].Spach MS, Barr RC. Ventricular intramural and epicardial potential distributions during ventricular activation and repolarization in the intact dog. Circulation Research. 1975;37:243–257. doi: 10.1161/01.res.37.2.243. [DOI] [PubMed] [Google Scholar]
- [16].Plank G, Burton RA, Hales P, Bishop M, Mansoori T, et al. Generation of histo-anatomically representative models of the individual heart: Tools and application. Philosophical Transactions Series A, Mathematical, Physical, and Engineering Sciences. 2009;367:2257–2292. doi: 10.1098/rsta.2009.0056. [DOI] [PMC free article] [PubMed] [Google Scholar]
- [17].Sundar H, Shen D, Biros G, Litt H, Davatzikos C. Estimating myocardial fiber orientations by template warping; IEEE International Symposium on Biomedical Imaging; Arlington, VA. 2006.pp. 73–76. [Google Scholar]


