

Abstract
We have used radioligand binding to synaptic membranes from distinct rat brain regions and quantitative autoradiography to investigate the postnatal evolution of acetylcholinesterase (AChE)-evoked up-regulation of α-amino-3-hydroxy-5-methylisoxazole-4-propionic acid (AMPA) receptors in CNS areas undergoing synaptogenesis. Incubation of synaptosomal membranes or brain sections with purified AChE caused a developmentally modulated enhancement in the binding of [3H]-(S)–AMPA and the specific AMPA receptor ligand [3H]-(S)-5–fluorowillardiine, but did not modify binding to kainate neither N-methyl-D-aspartate receptors. In all postnatal ages investigated (4, 7, 14, 20, 27, 40 days-old and adult rats), AChE effect on binding was concentration-dependent and blocked by propidium, BW 284c51, diisopropylfluorophosphonate and eserine, therefore requiring indemnity of both peripheral and active sites of the enzyme. AChE-mediated enhancement of [3H]-fluorowillardiine binding was measurable in all major CNS areas, but displayed remarkable anatomical selectivity and developmental regulation. Autoradiograph densitometry exhibited distinct temporal profiles and peaks of treated/control binding ratios for different cortices, cortical layers, and nuclei. Within the parietal, occipital and temporal neocortices, hippocampal CA1 field and cerebellum, AChE-potentiated binding ratios peaked in chronological correspondence with synaptogenesis periods of the respective AMPA-receptor containing targets. This modulation of AMPA receptors by AChE is a molecular mechanism able to transduce localized neural activity into durable modifications of synaptic molecular structure and function. It might also contribute to AChE-mediated neurotoxicity, as postulated in Alzheimer’s disease and other CNS disorders.
Keywords: Acetylcholinesterase, AChE, AMPA receptors, CNS development, Fluorowillardiine, Glutamate receptors, Neural plasticity, Quantitative autoradiography, Receptor modulation, Synapse formation, Synaptogenesis
1. Introduction
Glutamate receptors (GluRs) are crucial for nervous system function and development, synaptogenesis and neural plasticity. Their overactivity and/or malfunctioning lead to acute neurotoxicity and chronic neurodegenerative diseases. The α-amino-3-hydroxy-5-methylisoxazole-4-propionic acid (AMPA) receptor subclass of GluRs plays a capital role in the formation and stabilization of brain synapses and circuits (for reviews see Dev and Henley, 1998; Dingledine et al., 1999). Insertion of GluR subunits in the postsynaptic membrane is involved in the fine-tuning of enduring neural connections modulated by synaptic activity (Zhao et al., 1998; Petralia et al., 1999; Lüscher et al., 2000). Activity-dependent changes in the surface insertion and functional expression of AMPA receptors are strictly regulated by proteins located at the intracellular, but also at the outer side of the membrane (for reviews see Dev and Henley, 1998; Braithwaite et al., 2000). Extracellular proteins that might play such a role include cell-adhesion-molecules (CAM, Brose, 1999; Song et al., 1999), phospholipase A2 (PLA2, Dev et al., 1995) neuronal activity-regulated pentraxin (Narp, O’Brien et al., 1999) and acetylcholinesterase (AChE, Olivera et al., 1999).
An ever-growing body of evidence shows that, besides hydrolyzing the neurotransmitter acetylcholine at synapses, AChE possess a number of “non-classical” functions, some of which fit the criteria to be termed as morphogenetic (Koenigsberger et al., 1997) or even trophic (Day and Greenfield, 2002). Many well-documented studies showed a spatio-temporal correlation between the transient developmental expression of AChE by neurons and periods of axonal outgrowth (Anderson and Key, 1999;for a review, see Soreq and Seidman, 2001). A variety of experimental paradigms of AChE inhibition evoked significant reductions in neurite outgrowth (Sharma and Bigbee, 1998; Day and Greenfield, 2002) suggesting that AChE has consistent facilitating effects on neural development. Behra et al. (2002) provided genetic evidence for AChE non-classical functions, showing that a mutation in the zebrafish ache gene that abolishes ACh hydrolysis impaired the innervation of muscle fibers and caused a premature death of embryonic primary sensory neurons. Some AChE non-traditional roles rest on adhesive properties, whereas other actions depend on catalytic capacities of the protein. Its neuritogenic activity is not dependent on catalysis (for reviews see Anderson and Key, 1999; Grisaru et al., 1999; Soreq and Seidman, 2001) while its role in synaptogenesis requires an enzymatic activity and is related to its homology to the neuroligins (Sternfeld et al., 1998; Grifman et al., 1998; Villalobos et al., 2001). This structural homology with molecules that are firmly established as morphogenetic and that participate in synapse formation, such as neuroligins and neurexins, suggest that AChE synaptogenic effects may depend both on protein–protein interactions and on enzymatic mechanisms (Grifman et al., 1998; Soreq and Seidman, 2001). We have previously found an up-regulation of AMPA receptors by AChE that seems to be catalytic in nature and possibly attributable to a protein–protein interaction occurring on the synaptic membrane (Olivera et al., 1999).
Here, we have used radioligand-binding to synaptic membranes from discrete regions and quantitative autoradiography performed in the coronal, horizontal and parasagital planes, to study the postnatal profile of AChE-evoked up-regulation of AMPA receptors. As compared to our previous studies—essentially focused on limbic structures (Olivera et al., 2001)—we have increased the structural and temporal resolution of the investigation, and extended our measurements to a number of important cortical and nuclear areas.
2. Experimental procedures
2.1. Preparation of synaptosomal membranes
Postnatal (P0: first 24 h postbirth) immature (P4, P7, P14, P20, P27, P40) and adult male Wistar rats (200–250 g) were halothane/O2 anaesthetized and decapitated. Each experiment was carried out 3–5 times, and at least 7 rats were used in each experimental condition. Whole brains were removed and frozen (for autoradiography) or CNS regions were dissected out and homogenized in a glass–Teflon homogenizer in 10 volumes of ice-cold 50 mM Tris–citrate buffer (pH 7.4) containing 32 mM sucrose, 1 mM EDTA and 1 mM EGTA. Each homogenate was spun at 1000 × gfor 10 min and the supernatant centrifuged at 40,000 × g for 30 min (4 °C). Pellet was resuspended in 5 ml of 50 mM Tris–citrate buffer (pH 7.4) containing 1 mM Ca2+, 1 mM EDTA and 1 mM EGTA, frozen in liquid N2 for 5 min and thawed 20 min at 20 °C. Suspension was spun 30 min (4 °C) at 40,000 × g. Three cycles of centrifugation–freezing–thawing were carried out for eliminating endogenous glutamate (Dev et al., 1995). The final pellet was resuspended, protein concentration assayed (Pierce kit, Pierce Chem. Co., Rockford, IL, USA) and aliquots stored at −80 °C. Before assay, membranes were washed two times at 40,000 × g (10 min, 4 °C) to get rid of any remnant glutamate.
2.2. AChE pretreatment
Synaptosomal membranes from each region were incubated 20–45 min at 37 °C with one of the three following enzyme preparations of AChE, purified in our laboratory as described by Karlsson et al. (1985): (1) globular (G) form G2, purified from bovine erythrocyte Sigma type XII–S AChE; (2) G4 form, purified from electric eel Sigma type V–S; and (3) G2 form, isolated from human erythrocyte, lyophilized in our laboratory. Membranes or sections were incubated in solutions of the enzyme in 50 mM Tris–acetate buffer containing 1 mM EGTA, 1 mM EDTA, and 5 mM CaCl2 (final pH 7.4) presenting enzyme activities (final concentrations) between10−6 and 5 U ml−1 (1 U = 1 unit of AChE will hydrolyze 1 μmole of acetylcholine per min at pH 8.0 and 37 °C). Since the type and amount of changes evoked in binding were only dependent on enzyme activity irrespective of the enzyme source, most experiments were performed with electric eel AChE unless otherwise indicated. After incubation, membranes were cooled in ice water and spun at 40,000×g for 10 min. The pellet was washed two times with 50 mM Tris–citrate buffer to eliminate AChE, which was never in contact with radioligand. AChE inhibition experiments were performed as above but in the presence of 1,5-bis (4-allyl-dimethylammoniumphenyl)pentan-3-one dibromide (BW284c51) as described (Olivera et al., 1999). AChE (1 or 5 U ml−1) was preincubated with 10−13-10−3 M BW284c51 for 30 min at room temperature. Then, membranes or sections were treated with the mixture AChE– BW284c51 for 45 min at 37 °C or room temperature, respec- tively, and the binding assay performed. In other experiments, the AChE inhibitors propidium iodide, eserine or DFP—at final concentrations (μM) of 20, 10, and 1, respectively (Karlsson et al., 1985)—were used instead of BW284c51.
2.3. Membrane binding assays
After pretreatment, synaptosomal membranes were submitted to centrifugation binding assays as reported (Olivera et al., 1999). Briefly, 100 μl of membrane suspension containing 10–50 μg protein were incubated with GluR agonists or antagonists for 1 h at 0 °C. In AMPA receptor assay, 10 nM [3H]-(S)-5–fluorowillardiine ([3H]–FW) (Tocris Cookson Inc., Ballwin, MO, USA), and 25 nM [3H]-(S)–AMPA in presence of 100 mM KSCN were employed and 1 mM glutamate was added to determine non-specific binding. Working concentrations were previously determined performing saturation experiments with 0–3000 nM [3H]–FW and 0–5000 nM [3H]–AMPA. For [3H]–kainate (100 nM) assay, 100 μM kainate was used to determine non-specific binding (Olivera et al., 2001). 25 nM 6,cyano-7-nitroquinoxaline-2,3-dione ([3H]–CNQX) and 5 nM 2,3-dihydroxy-6-nitro-7-sulfamoyl-benzo[f]quinoxaline ([3H]–NBQX) were utilized as antagonists of non-NMDA ionotropic GluR (Dev et al., 1995). In the binding assay for NMDA receptors, 25 nM [3H]-MK-801 was used (2 h at 37 °C in a buffer containing glutamate and glycine) and 1 mM glutamate included to estimate non-specific binding. Reactions were stopped by 10,000 × g centrifugation for 5 min. Pellets were washed three times in 1 ml of Tris–citrate buffer and resuspended overnight in 200 μl 2% SDS. Final suspension was diluted in 4 ml of universal scintillant liquid (Packard Bioscience, Downers Grove, IL, USA) and radioactivity measured in a Beckman LS 6500 scintillation counter after 8 h.
2.4. Autoradiography, image acquisition and quantitative analysis
Brains were frozen in −40 °C isopentane and stored at −80 °C. Cryostat sections (15 μm, coronal, horizontal or parasagital) obtained in a OTF cryostat with a Bright 5030 microtome were mounted onto microscope slides with 0.1 mg ml−1 poly-L-lysine and stored desiccated at −80 °C for 24 h. Before each experiment, sections were thawed at room temperature in wet-free containers and washed 15 min with ice-cold 50 mM Tris–HCl buffer (pH 7.4) to remove endogenous glutamate. After incubation (30 min, 22 °C) with 1–5 U ml−1 AChE in 50 mM Tris–HCl buffer plus 5 mM CaCl2·5H2O (final pH 7.4), two washes with ice-cold buffer ensured complete removal of AChE. Control sections were simultaneously incubated in buffer without AChE. Each slide was then incubated in 1 ml of Tris–HCl buffer containing [3H]–FW (2–10 nM) for 60 min at 0 °C and then washed six times for 10 s in ice-cold buffer, rinsed in bi-distilled water and dried 1 s in acetone. Non-specific binding was defined by inclusion of 1 mM L-glutamate. Dry sections were exposed to 3H-Hyperfilm (Amersham, Little Chalfont, Buckinghamshire, UK) alongside 3H-microscale standards for 30 days, and then 3H-Hyperfilm developed in D-19, fixed and dried. Pictures were digitized using an EPSON Perfection 1200U Scanner (EPSON UK Ltd., Hemel Hemp-stead, Herts, UK) and Adobe Photoshop 4 (Adobe Systems Inc., San Jose, CA, USA). Images were analyzed with Scion Image Beta Release 3b, the NIH (National Institutes for Health, Bethesda, MD, USA) Image Software for Windows (Microsoft Co.). Using the rectangular option of the selection tool, we defined precise areas (6 × 6 pixels) from different regions, representing minus than 1% of the entire image. Density values were calculated by software from a gray scale calibrated in the range 0 (white)–256 (black) against 3H-microscales standards (Amersham). An exponential non-linear fitting curve best fit the density of the microscales and was used in all subsequent experimental analyses. Corresponding areas from control and AChE treated sections exposed to the same sheet of 3H-hyperfilm were directly compared. Film background was determined by sampling three different areas surrounding the section, the mean value calculated and subtracted from each measurement. Data shown in Table 1 represent the ratio between the density of a brain area in an AChE-treated slice and the corresponding brain area in an adjacent control slice (A:C ratio). At least 15 slides from each experimental situation were measured.
Table 1.
Quantitative analysis of AChE actions on [3H]–FW brain autoradiography
| Rat postnatal age |
P7 |
P14 |
P27 |
Adult |
|||||||
|---|---|---|---|---|---|---|---|---|---|---|---|
| AChE concentration | 1Uml−1 | 5Uml−1 | 1Uml−1 | 5Uml−1 | 1Uml−1 | 5Uml−1 | 1Uml−1 | 2Uml−1 | 5Uml−1 | 10Uml−1 | |
| CNS regions | Abbr. | ||||||||||
| CA1 | CA1 | 1.52 ± 0.19 NSI | 1.81 ± 0.14 NSI | 1.24 ± 0.07 NSI | 1.22 ± 0.08 | 1.19 ± 0.07 | 1.23 ± 0.06 | 1.15 ± 0.08 NSI | 1.21 ± 0.10 | 1.39 ± 0.07 | 1.52 ± 0.05 |
| Retrosplenial granular cortex | RsGCx | NSI | NSI | NSI | 1.23 ± 0.15 | 1.58 ± 0.10 | 1.38 ± 0.09 | NSI | 1.19 ± 0.20 | 1.24 ± 0.07 | 1.51 ± 0.12 |
| Occipital cortex, mediomedial | Oc2 MMCx | 1.64 ± 0.14 | 1.48 ± 0.24 | 1.16 ± 0.07 | 1.22 ± 0.08 | 1.49 ± 0.14 | 1.39 ± 0.06 | 1.26 ± 0.15 | 1.17 ± 0.08 | 1.61 ± 0.12 | 1.94 ± 0.09 |
| Parietal cortex | Par1Cx | 1.47 ± 0.20 | 1.49 ± 0.19 | 1.33 ± 0.12 | 1.30 ± 0.13 | 1.39 ± 0.12 | 1.53 ± 0.17 | 1.19 ± 0.09 | 1.21 ± 0.11 | 1.38 ± 0.08 | 1.43 ± 0.2 |
| Temporal cortex | Te3Cx | 1.46 ± 0.21 | 2.27 ± 0.40 | 1.37 ± 0.15 | 1.22 ± 0.15 | 1.39 ± 0.17 | 1.47 ± 0.09 | 1.15 ± 0.05 | 1.18 ± 0.03 | 1.15 ± 0.07 | 1.21 ± 0.06 |
| Perirhinal cortex | PRhCx | 1.90 ± 0.10 | 2.17 ± 0.40 | 1.33 ± 0.08 | 1.33 ± 0.09 | 1.43 ± 0.17 | 1.57 ± 0.13 | NSI | NSI | 1.31 ± 0.09 | 1.74 ± 0.19 |
| Piriform cortex | PirCx | 1.18 ± 0.10 | 1.74 ± 0.18 | 1.40 ± 0.15 | 1.27 ± 0.14 | 1.51 ± 0.19 | 1.62 ± 0.12 | NSI | 1.18 ± 0.09 | 1.15 ± 0.08 | 1.13 ± 0.08 |
| Paraventricular posterior nucleus | PVP | NSI | 1.41 ± 0.22 | NSI | 1.10 ± 0.04 | 1.44 ± 0.23 | 2.14 ± 0.17 | NSI | 1.74 ± 0.27 | NSI | NSI |
| Lateral Hypothalamic Area | LH | NSI | NSI | 1.14 ± 0.03 | 1.29 ± 0.18 | 1.69 ± 0.25 | 1.70 ± 0.30 | NSI | NSI | NSI | NSI |
| Posterolateral Cortical Amygdaloid nucleus | PLCo Amy | NSI | 1.50 ± 0.28 | 1.21 ± 0.09 | 1.18 ± 0.07 | 1.28 ± 0.12 | 1.57 ± 0.20 | 1.25 ± 0.07 | 1.27 ± 0.12 | 1.54 ± 0.12 | 1.50 ± 0.15 |
| Lateral Amygdaloid nucleus | LAmy | 1.26 ± 0.07 NSI | 1.42 ± 0.16 | 1.33 ± 0.12 | 1.17 ± 0.09 | 1.37 ± 0.16 | 1.41 ± 0.08 | 1.12 ± 0.06 | 1.17 ± 0.08 | 1.14 ± 0.06 | 1.07 ± 0.03 |
| Cerebellar cortex | CbCx | NSI | ND | NSI | 2.40 ± 1.0 | NSI | 1.75 ± 0.09 | NSI | NSI | 2.10 ± 0.8 | 2.50 ± 1.1 |
Upon pretreatment with either buffer (control) or AChE (concentrations indicated below), sections were thoroughly washed and incubated with 10nM [3H]-FW, dried and opposed to [3H]-Hyperfilm for 30 days. ScionImage-Beta Relase 3b quantification analysis software was used to compare digitized autoradiographs. Upon subtracting non-specific binding to each condition, results were expressed as the ratio between AChE treated sections and respective non-treated controls. Results represent means + S.E.M. of 15 similar fields. Statistical significance was P < 0.05. ND, non-determined, NSI, non-significant increase.
2.5. Anatomical co-ordinates, structure names, AChE histochemistry, immunohistochemistry and histology
Sections immediately adjacent to those submitted to autoradiography were stained with cresyl violet for precise histological determination of nuclei and layers in autoradiographs according to cytoarchitectural and morphological criteria, using stereotaxic co-ordinates and abbreviations as in Paxinos and Watson (1986). Other adjacent sections where processed for histochemistry of cholinesterases, employing either physostigmine (2 × 10⁻⁵ M) as AChE inhibitor and/or ethopropazine (2 × 10⁻⁵ M) as butyrylcholinesterase inhibitor as described (Rodríguez-Ithurralde et al., 1983). In order to correlate changes in binding with synapse formation, in approximately half of the animals from each age processed for autoradiography every fourth section was reserved for immunostaining, and later processed to localize synapses using a specific monoclonal antibody against synaptophysin (Boheringer Mannheim, Mannheim, Germany) a well-established presynaptic marker (Pickard et al., 2001).
2.6. Radioligand binding assays to sections
Part of control and AChE-treated sections submitted to autoradiography experiments were kept wet and not rinsed in acetone. Then, each section was blotted to Whatman GF/C filters employing 50 μl of cold Tris–HCl buffer, transferred into vials containing 4 ml of Emulsifier-Safe scintillation fluid (Packard) and radioactivity measured in a Beckman LS6500 scintillation counter.
2.7. Statistical analysis
Values shown in figures and tables represent means of triplicates or quintuplicates from each experimental condition and each experiment was carried out at least three separate times. Data sets were analyzed using unpaired Student’s t-test. Statistical significance was calculated per animal and differences between animal groups were considered significant when P < 0.05 unless otherwise stated.
2.8. Materials
[3H]–kainate was from New England Nuclear (NEN Co., Boston, MA, USA). [3H]–NBQX, [3H]-MK-801, [3H]–glutamate, [3H]-Hyperfilm and [3H]-microscale standards were from Amersham. [3H]–FW and cold ligands were from Tocris-Cookson Inc. (Ballwin, MO, USA). All other chemicals from commercial sources (Sigma, Amersham and BDH Ind. Inc., Poole, Dorset, UK) were of the highest purity available.
3. Results
3.1. Comparative effects of AChE on binding to ionotropic glutamate receptor subtypes
In previous series of saturation binding experiments using a wide range of [3H]–FW and [3H]–AMPA concentrations we demonstrated that the augmentation in AMPA receptor agonist binding that occurs upon treatment with AChE is mostly due to an increase in the number of receptors available for radioligand binding (Olivera et al., 1999). Upon carrying out a set of comparative experiments using a similar range of [3H]–FW (0–3000 nM) and [3H]–AMPA (0–5000 nM) concentrations as in Olivera et al. (1999) we confirmed these data and, in addition, found no significant differences between the potentiation effects evoked by G2 mammalian isoforms (bovine and human) and binding changes caused by the G4 molecular form purified from Electrophorus electricus. As shown in Fig. 1, even 0.1 U ml−1 AChE (0.5 U AChE per mg of membrane protein) evoked increases of 50% in 10 nM [3H]–FW and 25 nM [3H]–AMPA binding, whereas binding of [3H]–MK801, [3H]–kainate, [3H]–glutamate and [3H]–CNQX were unaffected even by 0.1–5 U ml−1 AChE (0.5–25 U of AChE per mg of membrane protein. Maximal evoked increases in binding of [3H]–FW and 25 nM [3H]–AMPA receptors were obtained with 0.5 and 15 U of AChE (G4, E electricus) per mg of membrane protein for P14 and adult rats, respectively. Treatment evoked significant decreases in specific [3H]–NBQX binding, but non-specific binding to AMPA receptors was not changed.
Fig. 1.

AChE effects on radioligand binding to ionotropic glutamate receptors. Cerebral cortex membranes from adult male rats were exposed to 0.1 U ml−1 AChE (0.5 U mg−1 of membrane protein) for 30 min at 37 °C. After 2 washes to ensure complete AChE removal, samples were submitted to binding assays with agonists and antagonists of AMPA, kainate or NMDA receptors. Data represent percent ratios between disintegrations per minute (dpm) of AChE-treated samples and dpm of control (buffer-treated) samples for each agonist/antagonist. Results are the mean ± S.D. of three experiments, each one performed by triplicate. The level of statistical significance was P < 0.01.
3.2. Anatomical distribution of AChE-enhanced [3H]–FW binding to adult membranes and sections
We next examined whether the selective augmentation in binding elicited by treatment was present in all AMPA receptor-containing regions (Monaghan et al., 1984; Hawkins et al., 1995). [3H]–AMPA binding to adult membranes displayed remarkable regional variation in response to treatment (Fig. 2A). Neocortical membrane binding augmented to 180% of control values, whereas those from spinal cord showed no changes, and hippocampal ones increased to 115–140%. Table 1 summarizes the distribution and intensity (T/C ratios) of AChE effects on [3H]–FW autoradiography throughout the adult brain. Although all major CNS regions displayed binding enhancement in at least one structure upon treatment, each region also contains AMPA receptor-containing nuclei or layers that do not respond with significantly enhanced T/C ratios after AChE action. For example, adult posterolateral cortical and lateral amygdaloid nuclei displayed significant AChE-evoked increases in [3H]–FW binding, whereas the lateral hypothalamic area remained unaffected (Table 1).
Fig. 2.

AChE potentiation of [3H]–AMPA binding to membranes from different CNS regions. Synaptosomal membranes from neocortex (Cx), hippocampus (Hp), whole brain (WB), and spinal cord (SC) from either adult (A) or P14 (B) rats were exposed either to 0.1–1.5 U ml−1 (0.5–7.5 U mg−1 of membrane protein) (A) or to 0.01 U ml−1 (0.05 U mg−1 of membrane protein) (B) AChE for 30 min at 37 °C. Upon standardised washing, AChE pretreated and control membranes were submitted to binding assay using 25 nM [3H]–AMPA for 60 min. Results shown represent the mean ±S.D. from three separate experiments. The level of statistical significance was P < 0.01.
3.3. Age-dependence of AChE effects on [3H]–AMPA and [3H]–FW binding
Synaptic membranes from whole brain, cortex, hippocampus and spinal cord of P14 rats exhibited significant AChE-evoked increases in [3H]–AMPA binding in all structures, including the spinal cord (Fig. 2B) which was unresponsive in adults (Fig. 2A). In addition, immature animals showed significant AChE effects at concentrations as low as 0.01 U ml−1, while similar effects in older animals required 1–5 U ml−1 AChE to occur. Age-dependent modulation of AChE effects was also demonstrated by scintillation counting of autoradiographic sections (see Section 2) taken at comparable antero-posterior planes from brains of P7, P14, P27 and adult rats (Fig. 3). For any given AChE concentration, highest rises in [3H]–FW binding were seen in P7 rats and lowest effects in mature rats. Adult sections required higher AChE concentrations (5 U ml−1) than immature ones to show significant enhancements.
Fig. 3.
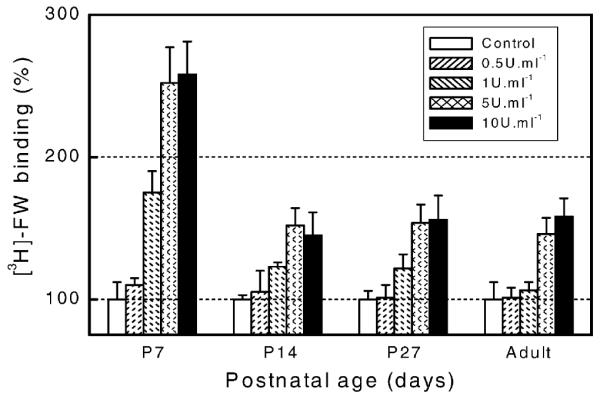
Postnatal evolution of AChE-evoked increases on [3H]–FW binding to sections. Cryostat coronal brain sections from immature (P7, P14, P27) and adult rats (corresponding to adult stereotaxic co-ordinates from Bregma −3.60 to −4.30) were pretreated with 0.0, 0.5, 1.0, 5.0, and 10 U ml−1 AChE during 30 min at room temperature. After washing, binding assay with 10 nM [3H]–FW for 60 min, and postbinding washing, wet sections were blotted to Whatman GF/C filters and immersed in scintillant liquid. Changes in specific radioactivity of AChE-treated samples were expressed as percent ratio respect to control (0.0 AChE) sections. Data are the mean±S.D. from five experiments with P < 0.05.
3.4. Developmental regulation of AChE effects as determined from brain autoradiograph densitometry
Densitometry of horizontal (Fig. 4A), parasagital (B) and coronal (C) autoradiographic sections from immature (P4, P7, P14, P20, P27, P40) and adult rats displayed dramatic age- and region-dependent changes (Table 1) in AChE-enhanced [3H]–FW binding. Here we confirm results reported earlier on the hippocampal formation (Olivera et al., 2001) and extend these densitometric findings to most neocortical areas (see Table 1).
Fig. 4.


[3H]–FW autoradiography experiments. Brains from immature (P4, P14, P20, P27, P40) and adult rats were frozen in −40 °C isopentane for 30 sec, and sectioned (15 μm) in either the parasagital (4,A), horizontal (4,B) or coronal (4,C) planes. Stored desiccated −80 °C, 24 h) sections were slowly defrosted and submitted to AChE treatment (1–5 U ml−1) for 30 min at room temperature. Adjacent control sections were incubated in buffer without AChE. All sections were thoroughly washed and submitted to autoradiography experiments with [3H]–FW, fixed, and developed as described in Section 2. Abbreviations: Acb, accumbens nucleus; Amy, amygdala; Arc, arcuatus nucleus; CA1–CA3, fields CA1-CA3 of hippocampus proper (Cornu Ammonis); Cb, cerebellum; CbCx, cerebellar cortex; Cc, corpus callosum; CPu, caudate putamen; Cx, cortex; DG, dentate gyrus; ec, external capsule; EntCx, entorhinal cortex; H, hypothalamus; HF, hippocampal formation; hil, hilus of dentate gyrus; Hp, hippocampus; IC, inferior colliculus; LSp, lateral septum; LSD, lateral septal nucleus; NeoCx, neocortex; OB, olfactory bulb; OcCx, occipital cortex; ParCx, parietal cortex; PirCx, piriform cortex; PRhCx, perirhinal cortex; rf, rhinal fissure; RsgCx, retrosplenial granular cortex; S, subiculum; Sp, Septum; TeCx, temporal cortex; Th, thalamus.
Forebrain, hippocampus and diencephalic structures
In the normal, untreated brain of the P4 rat, the lateral septum, caudate-putamen, and hippocampal CA1 field (Fig. 4A), accumbens, islands of Calleja and olfactory bulb (Fig. 4B), depict early significant [3H]–FW binding when compared to neighbor structures. Already at this stage, AChE treatment clearly potentiates [3H]–FW binding. The effect not only increases binding density, but also delineates structures not well defined in control autorads. Hippocampal CA1 field exhibits maximal T/C ratios at P7 (Table 1), stage in which the septo-hippocampal pathway is establishing synapses on pyramidal cells (Matthews et al., 1974). At the diencephalic level, the paraventricular posterior nucleus of thalamus, lateral hypothalamic area and posterolateral cortical amygdaloid nucleus peak at P27 (Fig. 4C, Table 1).
Perirhinal cortex depicts an early peak at P7, whereas the piriform cortex shows its highest responses both at P7 and P27, and the retrosplenial granular cortex undergoes maximum enhancement at P27. Interestingly, occipital, parietal, and temporal neocortices show a bi-peaked profile: their T/C ratios rise at the P7 stage, then decrease by P14, to recover by P27. Cerebellar cortex starts undergoing AChE-evoked [3H]–FW binding enhancements by P14, and maintain high rates until adult age, but this is detected solely upon application AChE concentrations (5 U ml−1) higher than those required for cerebral cortices to show the effect.
3.5. Effects of different AChE inhibitors and anticholinergic drugs on AMPA binding
Eserine, DFP, BW284c51 and propidium iodide fully blocked AChE-evoked changes in [3H]–FW and [3H]–AMPA binding both to membranes and to autoradiographic sections in a concentration-dependent manner (Fig. 5). AChE-evoked potentiation was more sensitive to BW284c51 and other anti-cholinesterases in immature than in adult rats. To test whether acetylcholine depletion—which might be caused by either locally released or experimentally added AChE—is able to elicit the changes found in binding to AMPA receptors, five adult and five P14 rat brain coronal sections (located between coordinates Bregma −3.3 and Bregma −4.16 of Paxinos and Watson atlas) from each age analysed were exposed to either 0.1–50 μM atropine (a muscarinic receptor antagonist), 1–100 μM mecamylamine (a neuronal nicotinic receptor antagonist) or to the cholinergic neurotoxin, 0.1–5 μM hemicholinium-3. Incubation of sections for 45 min at room temperature with each tested drug did not affect significantly binding of 2-10 nM [3H]–FW nor 25 nM [3H]–AMPA to hippocampal or neocortical regions.
Fig. 5.

Blockade by anticholinesterase agents of AChE-evoked potentiation of [3H]–FW and [3H]–AMPA binding. Synaptosomal cortical membranes (A, C) and 15 μm brain sections (B) from adult male rats were exposed to different concentrations of AChE–BW284c51 for 30 min at 37 °C (synaptosomal membranes) or room temperature (sections). After this pretreatment, samples were extensively washed and submitted to either centrifugation binding assays (A) or autoradiography (B) experiments using 10 nM [3H]–FW. Fig. 5C shows inhibition by anticholinesterase agents of [3H]–AMPA binding potentiation on adult membranes. Cortical membranes were exposed to a mixture of 1 U ml−1 AChE plus either buffer or 20 μM propidium iodide, 10 μM eserine or 1 μM DFP (final concentrations in the same buffer) for 30 min at 37 °C. After 2 washes, 25 nM [3H]–AMPA binding assay was carried out. Plots represent means±S.D. of specific radioactivities from three separate experiments, each one performed by triplicate. Significance level was P < 0.01.
3.6. Correlation between AChE-evoked AMPA receptors binding increases and AChE developmental expression
To ascertain whether the descendent sensitivity of AMPA receptor binding to treatment that occurs throughout postnatal maturation was due or not to a desensitization evoked by developmentally increased levels of AChE, we calculated ΔB:A and ΔB:S ratios. They represent, for a given region, the ratio between the change in binding respect to control sections (ΔB = (T – C)/C) divided by the AChE activity measured at the same age in the immediately adjacent section. ΔB/A and ΔB/S ratios are calculated by dividing ΔB, by either the absolute (in AChE units) or the specific enzyme activitiy (in units per mg of protein), respectively, for a given region and age. For sections from CA1 region incubated with 1 U ml−1 AChE, ΔB/S ratios were: 13.8 ± 0.5 for animals aged P7; 4.36 ± 0.03 for P14, 2.53 ± 0.02 for P27 and 2.15 ± 0.03 for adult rats. A similar profile was depicted by ΔB/A ratios: 3.71 × 10⁻³ ± 4 × 10⁻⁵ for P7; 5.5 × 10⁻³ ± 1 × 10⁻⁵ for P14; 2.7 × 10⁻⁴ ± 2 × 10⁻⁵ for P27, and 1.2 × 10⁻⁴ ± 1 × 10⁻⁵ for adult rats. No significant changes were found in sections treated with higher AChE concentrations, as illustrated by data corresponding to 5Uml−1 AChE. The ΔB/S ratios were: 21.49 ± 0.03; 4.00 ± 0.02; 3.07 ± 0.02 and 3.52 ± 0.02 for P4, P7, P14 and adult rats, respectively, whereas ΔB/A ratios for the same ages were: 5.79 × 10⁻³ ± 4 × 10⁻⁵ for P7; 5.1 × 10⁻⁴±2 × 10⁻⁵ for P14, 3.2 × 10⁻⁴±7 × 10⁻⁶ for P27 and 3.1 × 10⁻⁵ ±5 × 10⁻⁶ for adult rats. Most other main CNS regions were studied, but the corresponding results will not be including in this article.
4. Discussion
4.1. AChE selectively increases binding to AMPA receptors
In previous series of saturation binding experiments to rat brain membranes (Olivera et al., 1999) we encountered two receptor binding sites and demonstrated that the increase in agonist binding to AMPA receptors occurring after AChE treatment is mostly due to an augmentation in the number of receptors available for radioligand binding (Bmax) rather than a conformational shift to a higher affinity state (KD). Here we confirm these data and show, in addition, that AChE binding potentiating effect is selective for the AMPA receptor subtype within the ionotropic GluR family, since binding of [3H]–kainate and [3H]–MK801 were unaffected upon incubation with the enzyme.
A set of our experiments (Section 3.5) was devoted to throw some light on the mechanisms how AChE may induce increases in AMPA binding. It has been reported that lesions of rat cholinergic basal forebrain resulted in enhanced binding of AMPA and kainate in cortical cholinoceptive target regions (Rossner et al., 1995a,b). Thus, acetylcholine depletion may be a possible explanation of AChE-evoked binding increases. However, our experiments with anticholinergic drugs suggest that AChE effects, are direct and related to its non-classical actions (Soreq and Seidman, 2001) and not due to classical cholinolytic effects.
4.2. Technical and specialized aspects
The finding that rises in binding to AMPA receptors were not reflected in increases of total [3H]–glutamate binding, is possibly due to the low selectivity and high non-specific binding of this ligand. More difficult to understand is that AChE, which elicits increases in the binding of agonists, decreased binding of one antagonist ([3H]–NBQX) and leaves the other ([3H]–CNQX) unmodified. However, it is well known that these antagonists can be affected differently by factors that modulate receptor conformation (Dev and Henley, 1998). Moreover, PLA2, another extracellular modulator of AMPA receptors, also increased agonist binding to them, while decreasing [3H]–CNQX binding (Tocco et al., 1992; Dev et al., 1995). On the other hand, differences between [3H]–NBQX and [3H]–CNQX binding may reflect the fact that [3H]–NBQX binds preferentially to AMPA receptors and displays a 20–150-fold greater selectivity for AMPA receptors than for kainate receptors, whereas CNQX is relatively non-selective between non-NMDA receptors (Sheardown et al., 1990; Dev and Henley, 1998). Consistent with those findings, the concentration-inhibition curves for AMPA and NBQX on [3H]–AMPA binding to control and AChE-incubated membranes show that NBQX is a less effective displacer in membranes incubated with AChE than in control membranes (data not shown). These data represent additional support to the view that AChE could alter the conformation of the receptor, although more experimental data aimed to answer that question must be developed.
4.3. Anatomical distribution and developmental modulation of AChE-induced changes
Both binding to membranes purified from distinct CNS regions and autoradiograph densitometry demonstrated that the [3H]–FW and [3H]–AMPA binding sites that were potentiated by AChE are non-homogeneously distributed throughout the adult CNS. They were generally located in cortical layers or brain nuclei previously known as bearing a high density of AMPA receptor-enriched excitatory synapses, as, for instance, radiatum and lacunosum-moleculare layers of hippocampal CA1 field (Monaghan et al., 1984; Tönnes et al., 1999). In cortical areas, AChE-facilitated [3H]–FW binding adopt a layered, stratified distribution, as do synapses enriched in AMPA receptors (Olivera et al., 2001).
Developmental changes in [3H]–FW and [3H]–AMPA binding in response to AChE evidenced a defined pattern of descendent sensitivity to the treatment as postnatal development progresses. P7 rats responded with increased binding to AChE concentrations as low as 10−13 M, whereas adult responses were significant only upon concentrations higher than 10−10 M. The higher sensitivity found at early postnatal key periods is typical of phenomena that are critical for development. However, reasons for the marked descendent sensitivity of AMPA receptor binding to both AChE and BW are not clear. The experimentally found ΔB/A and ΔB/S ratios reported in (Section 3.6), as they increase with developmental age, appear to indicate that more enzyme is needed to get a given change in binding. Therefore, it is possible that a component of the descendent receptor sensitivity to AChE occurring with maturation that may be due to AMPA receptor desensitization imputable to higher AChE expression. However, this cannot be the exclusive reason, for sensitivity is not recovered upon AChE inhibition, as found in our BW284c51 experiments. A more feasible explanation is that a part, at least, of the change in sensitivity is attributable to developmental changes in AMPA receptor subunit composition and to posttranscriptional modifications that these subunits undergo (Dev and Henley, 1998).
4.4. Maximal AChE effects on binding occur in sites undergoing synaptogenesis
During development, treated versus control (T/C) binding ratios quantify the enhanced-binding response to AChE. They evolve in a regionally-specific fashion, and thus, distinct areas exhibit peaks at different developmental times (Table 1). Analysis of the occurrence of T:C ratio peaks throughout postnatal development shows that binding peaks occur in topographical and chronological correspondence with synaptogenesis of afferent systems on these structures. At the P7 stage hippocampus, for instance, AChE effects peak simultaneously with the arrival of the septo-hippocampal system (see Matthews et al., 1974 for chronology). The layer of enhanced-binding found beneath the CA1–CA3 pyramidal cell layer parallels the localization of that afferent system, which at P7 is establishing synapses with pyramidal cells (Matthews et al., 1974). The subsequent elevation of T/C ratios occurring between P14 and P27 corresponds with the period of formation of most apical axodendritic synapses on hippocampal pyramidal and granular cells (Ceranik et al., 2000). These phenomena exhibit considerable synchrony with the period of maximal AMPA receptor insertion at the pyramidal dendritic spine membrane, i.e. from P10 to P35 (Petralia et al., 1999). Optical densitometry of immunohistochemically-demonstrated synaptophysin performed in sections adjacent to those submitted to autoradiography revealed that maximal synaptophysin expression was correlated with peaks of AChE-evoked potentiation of AMPA receptors binding.
Postnatal development of most neocortices displayed a first maximal T:C ratio at P7 and a second elevation by P27 (Table 1). This behavior correlates well with the timing of the first and final phases of synaptogenesis (as defined in Section 4.4) at parietal (Micheva and Beaulieu, 1996; White et al., 1997), temporal (Schierle et al., 1997), and occipital (Miller, 1986; Bahr and Wolff, 1985) neocortices. Maximal AChE effect on binding to the cerebellar cortex occurs by P14, a period of great synaptic formation and remodeling activity in Purkinje cells. The stage is marked by dendritic arbor differentiation, proliferation of parallel fiber synapses (Robain et al., 1981), formation of climbing fiber synapses, loss of multiple climbing fiber innervation (Zhao et al., 1998) and transient changes in GluR subunit expression in granule and Purkinje cell remodeling synapses (Martin et al., 1998; Ripellino et al., 1998). Therefore, T/C ratios and maximal synaptogenesis peak remarkably synchronically in the cerebellum. An unexpected finding was that in some hormone-responsive nuclei—the lateral hypothalamic area, the posterolateral cortical and the lateral amygdaloid nuclei-maximal AChE effects occur by P27, in temporal correspondence with the peri-puberal stage, pointing to a possible hormonal modulation of the AChE action (Lustig et al., 1993).
4.5. Possible cellular mechanisms and molecular interaction involved in new AChE effects
Our finding of a precise spatio-temporal correlation between AChE-enhanced AMPA receptor binding sites and structures undergoing intensive synapse formation, indirectly supports the view that AChE is involved in synaptogenesis, as previously suggested (Sternfeld et al., 1998; Olivera et al., 2001; Soreq and Seidman, 2001). Synaptogenesis takes place in three consecutive steps that are most likely mediated by CAMs (Brose, 1999). First, an arriving axonal growth cone identifies its appropriate partner cell, creating an initial contact (Song et al., 1999). Second, specific axonal and dendritic protein components are recruited to this initial contact site, forming a functional synapse (Brose, 1999). And third, the presynaptic and postsynaptic molecules specialized for signal transmission and transduction achieve a mature stequiometry, distribution, morphometry (Martin et al., 1998) and local regulation. While AChE morphogenetic actions have been demonstrated in so many experimental systems and laboratories that they must be considered firmly established (Grisaru et al., 1999; Soreq and Seidman, 2001), and it is accepted that AChE promotes an increase in surface area and structural organization of synapses (Sternfeld et al., 1998; Grifman et al., 1998) the intimate mechanisms of these actions are subjects of speculation. Our finding that synaptogenesis membranes show increased AChE-mediated AMPA receptor upregulation is consistent with the view that this regulatory action is relevant to the synaptogenetic process.
At prospective synaptic sites, the extracellular AChE-homology domain of neuroligin 1 forms a trans-synaptic cell adhesion system with the extracellular domain of β-neurexin, and works as a recognition mechanism able of initiate the recruitment of presynaptic and postsynaptic proteins (Brose, 1999; Song et al., 1999; Scheiffele et al., 2000). AChE synaptogenetic role would require a bipolar, bi-functional action, as its neuroligin-like domain would operate the recognition of neurexin-like synaptic proteins (Rao et al., 2000; Scheiffele et al., 2000) while a catalytic (non-proteolytic, Olivera et al., 1999) domain would prompt changes in the surface exposition of proteins (Grifman et al., 1998; Grisaru et al., 1999) including increased availability of binding AMPA receptors. It is worth noting that AChE inhibitors aimed at both peripheral- (propidium) and active site- (eserine) abolish the enzyme potentiating effect on AMPA receptors, supporting the view that both a catalytic action as well as a capacity to recognize molecules different from acetylcholine, are involved in the AChE modulation of AMPA receptors that we are reporting. Other extracellular proteins seem to regulate AMPA receptors from the external side of the membrane, including phospholipase A2 (Dev et al., 1995), and Narp, which interacts with the extracellular N-terminal domain of AMPA receptors leading to their aggregation (O’Brien et al., 1999).
4.6. Developmental, physiological and pathological significance of AChE action
Neural activity plays crucial roles in the stabilization of synaptic connections: a certain type, level, and rate of functioning is necessary for synapses to achieve a definite degree of stability (Wu et al., 1996). It is thus remarkable that many CNS regions that undergo age-modulated changes in AChE potentiation of AMPA receptors have also been shown to exhibit developmentally regulated AChE content (Lassiter et al., 1998) and/or release in response to neuronal activation (Rodríguez-Ithurralde et al., 1997). This may indicate that AChE released in response to neuronal activity may play a role, during a particular period of synaptogenesis, by modifying AMPA receptor properties at postsynaptic membranes. It is remarkable that synaptic activation of hippocampal neurons can lead to movement and insertion of native AMPA receptors at postsynaptic membrane sites that initially lack them (Shi et al., 1999; Pickard et al., 2001). As AChE is released from neurons to the extracellular milieu as a consequence of neuronal activation (Rodríguez-Ithurralde et al., 1997), its effects in promoting an increase in available AMPA receptors at the postsynaptic membrane may contribute to the alleged morphogenetic properties of this protein. This mechanism appears as ideally suited to transduce neural activity into structural organization of synapses that permit changes in receptor function. The biological importance of AChE-mediated potentiation of AMPA receptors is supported by the recent demonstration of cholinergic–glutamatergic interactions that have been associated with higher brain functions as long-term potentiation, memory, and behavior (Meshorer et al., 2002). The paper of Behra et al. (2002) also strongly support the conclusion that potentiation of AMPA receptors by AChE is developmentally essential and physiologically relevant, since they demonstrated that genomic disruption of the zebrafish AChE (upon ache gene mutations) leads to serious nervous system malformations, including impaired muscle fiber innervation and premature death of embryonic sensory neurons.
Our findings may have pathological significance in the adult brain as well, since is has been recently demonstrated that stress-induced AChE overproduction can trigger glutamatergic hyperactivation (Meshorer et al., 2002). AChE levels and isoforms of both CNS and cerebrospinal fluid show significant changes in some clinically important diseases, including Alzheimer’s (Grisaru et al., 1999) where is highly concentrated in amyloid plaques and in amyothrophic lateral sclerosis (Soreq and Seidman, 2001). Identification of the molecular mechanisms underlying AChE modulation of AMPA receptors, together with studies designed to characterize its effects on AMPA receptor-mediated synaptic transmission should provide useful information to modulate synaptic plasticity and connections re-growth.
Acknowledgements
We are grateful to PEDECIBA (Biología) of Uruguay, the MRC and the Wellcome Trust for financial support. S.O. was supported by a PEDECIBA (Biología) travel fellowship.
Abbreviations
- AChE
acetylcholinesterase
- AMPA
α-Amino-3-hydroxy-5-methylisoxazolepropionate
- BW284c51
1,5-bis(4-allyl-dimethylammoniumphenyl)pentan-3-one dibromide
- CA1
CA1 field of hippocampus proper
- CAM
cell-adhesion-molecule
- CNQX
6,cyano-7-nitroquinoxaline-2,3-dione
- DFP
diisopropylfluorophosphonate
- [3H]–FW
[3H]-(S)-5–fluorowillardiine
- GluR
glutamate receptor
- KSCN
potassium thiocyanate
- MK801
(+)-5-methyl-10,11-dihydro-5H-dibenzo[a,d] cyclohepten-5,10-imine
- Narp
neuronal activity-regulated pentraxin
- NBQX
2,3-dihydroxy-6-nitro-7-sulfamoyl-benzo[f]quinoxaline
- P
postnatal day (P 0 = first 24 h of extrauterine life)
- PLA2
phospholipase A2
- T/C ratios
treated/control ratios
References
- Anderson RB, Key B. Role of acetylcholinesterase in the development of axon tracts within the embryonic vertebrate brain. Int. J. Dev. Neurosci. 1999;17:787–793. doi: 10.1016/s0736-5748(99)00064-7. [DOI] [PubMed] [Google Scholar]
- Bahr S, Wolff JR. Postnatal development of axosomatic synapses in the rat visual cortex: morphogenesis and quantitative evaluation. J. Comp. Neurol. 1985;233:405–420. doi: 10.1002/cne.902330309. [DOI] [PubMed] [Google Scholar]
- Behra M, Cousin X, Bertrand C, Vonesch JL, Biellmann D, Chatonnet A, Strahle U. Acetylcholinesterase is required for neuronal and muscular development in the zebrafish embryo. Nat. Neurosci. 2002;5:111–118. doi: 10.1038/nn788. [DOI] [PubMed] [Google Scholar]
- Braithwaite SP, Meyer G, Henley JM. Interactions between AMPA receptors and intracellular proteins. Neuropharmacology. 2000;39:919–930. doi: 10.1016/s0028-3908(99)00171-9. [DOI] [PubMed] [Google Scholar]
- Brose N. Synaptic cell adhesion proteins and synaptogenesis in the mammalian central nervous system. Naturwissenschaften. 1999;86:516–524. doi: 10.1007/s001140050666. [DOI] [PubMed] [Google Scholar]
- Ceranik K, Zhao S, Frotscher M. Development of the entorhino-hippocampal projection: guidance by Cajal-Retzius cell axons. Ann. N.Y. Acad. Sci. U.S.A. 2000;911:43–54. doi: 10.1111/j.1749-6632.2000.tb06718.x. [DOI] [PubMed] [Google Scholar]
- Day T, Greenfield SA. A non-cholinergic, trophic action of acetylcholinesterase on hippocampal neurones in vitro: molecular mechanisms. Neuroscience. 2002;111:649–656. doi: 10.1016/s0306-4522(02)00031-3. [DOI] [PubMed] [Google Scholar]
- Dev KK, Honoré T, Henley JM. Phospholipase A2 down-regulates the affinity of [3H]-AMPA binding to rat cortical membranes. J. Neurochem. 1995;65:184–191. doi: 10.1046/j.1471-4159.1995.65010184.x. [DOI] [PubMed] [Google Scholar]
- Dev KK, Henley JM. Modulation of agonist binding to AMPA receptors. Mol. Neurobiol. 1998;17:33–58. doi: 10.1007/BF02802023. [DOI] [PubMed] [Google Scholar]
- Dingledine R, Borges K, Bowie D, Traynelis S. The glutamate receptor ion channels. Pharmacol. Rev. 1999;51:7–61. [PubMed] [Google Scholar]
- Grifman M, Galyam N, Seidman S, Soreq H. Functional redundancy of acetylcholinesterase and neuroligin in mammalian neuritogenesis. Proc. Natl. Acad. Sci. U.S.A. 1998;95:13935–13940. doi: 10.1073/pnas.95.23.13935. [DOI] [PMC free article] [PubMed] [Google Scholar]
- Grisaru D, Sternfeld M, Eldor A, Glick D, Soreq H. Structural roles of acetylcholinesterase variants in biology and pathology. Eur. J. Biochem. 1999;264:672–686. doi: 10.1046/j.1432-1327.1999.00693.x. [DOI] [PubMed] [Google Scholar]
- Hawkins LM, Beaver KM, Jane DE, Taylor PM, Sunter DC, Roberts PJ. Characterisation of the pharmacology and regional distribution of (S)-[3H]-5-fluorowillardiine binding in rat brain. Br. J. Pharmacol. 1995;116:2033–2039. doi: 10.1111/j.1476-5381.1995.tb16408.x. [DOI] [PMC free article] [PubMed] [Google Scholar]
- Karlsson E, Mbugua P, Rodríguez-Ithurralde D. Anticholinesterase toxins. Pharmacol. Ther. 1985;30:259–276. doi: 10.1016/0163-7258(85)90051-8. [DOI] [PubMed] [Google Scholar]
- Koenigsberger C, Chiappa S, Brimijoin S. Neurite differentiation is modulated in neuroblastoma cells engineered for acetylcholinesterase expression. J. Neurochem. 1997;69:1389–1397. doi: 10.1046/j.1471-4159.1997.69041389.x. [DOI] [PubMed] [Google Scholar]
- Lassiter TL, Barone S, Padilla S. Ontogenetic differences in the regional and cellular acetylcholinesterase and butyrylcholinesterase activity in the rat brain. Dev. Brain Res. 1998;105:109–123. [PubMed] [Google Scholar]
- Lüscher C, Nicoll RA, Malenka RC, Muller D. Synaptic plasticity and dynamic modulation of the postsynaptic membrane. Nature. 2000;3:545–550. doi: 10.1038/75714. [DOI] [PubMed] [Google Scholar]
- Lustig RH, Wilson MC, Federoff HJ. Ontogeny, sex dimorphism, and neonatal sex hormone determination of synapse-associated messenger RNAs in rat brain. Brain Res. Mol. Brain Res. 1993;20:101–110. doi: 10.1016/0169-328x(93)90114-5. [DOI] [PubMed] [Google Scholar]
- Martin LJ, Furuta A, Blackstone CD. AMPA receptor protein in developing rat brain: glutamate receptor-1 expression and localization change at regional, cellular and subcellular levels with maturation. Neuroscience. 1998;83:917–928. doi: 10.1016/s0306-4522(97)00411-9. [DOI] [PubMed] [Google Scholar]
- Matthews DA, Nadler JV, Lynch GS, Cotman CW. Development of cholinergic innervation in the hippocampal formation of the rat. I. Histochemical demonstration of acetylcholinesterase activity. Deve. Biol. 1974;36:130–141. doi: 10.1016/0012-1606(74)90196-1. [DOI] [PubMed] [Google Scholar]
- Meshorer E, Erb C, Gazit R, Pavlovsky L, Kaufer D, Friedman A, Glick D, Ben-Arie N, Soreq H. Alternative splicing and neuritic mRNA translocation under long-term neuronal hypersensitivity. Science. 2002;295:508–512. doi: 10.1126/science.1066752. [DOI] [PubMed] [Google Scholar]
- Micheva KD, Beaulieu C. Quantitative aspects of synaptogenesis in the rat barrel field cortex with special reference to GABA circuitry. J. Comp. Neurol. 1996;373:340–354. doi: 10.1002/(SICI)1096-9861(19960923)373:3<340::AID-CNE3>3.0.CO;2-2. [DOI] [PubMed] [Google Scholar]
- Miller MW. Maturation of rat visual cortex. III. Postnatal synaptogenesis of local circuit neurons. Brain Res. 1986;390:271–285. doi: 10.1016/s0006-8993(86)80236-0. [DOI] [PubMed] [Google Scholar]
- Monaghan DT, Yao D, Cotman CW. Distribution of [3H]-AMPA binding sites in rat brain as determined by quantitative autoradiography. Brain Res. 1984;324:160–164. doi: 10.1016/0006-8993(84)90636-x. [DOI] [PubMed] [Google Scholar]
- Olivera S, Rodriguez-Ithurralde D, Henley JM. Acetylcholin-esterase potentiates [3H]-fluorowillardiine and [3H]-AMPA binding to rat cortical membranes. Neuropharmacology. 1999;38:505–512. doi: 10.1016/s0028-3908(98)00214-7. [DOI] [PubMed] [Google Scholar]
- Olivera S, Rodriguez-Ithurralde D, Henley JM. Regional localisation and developmental profile of acetylcholinesterase-evoked increase in [3H]S-fluorowillardiine binding to AMPA receptors in rat brain. Br. J. Pharmacol. 2001;133:1055–1062. doi: 10.1038/sj.bjp.0704167. [DOI] [PMC free article] [PubMed] [Google Scholar]
- O’Brien R, Xu D, Petralia R, Steward O, Huganir R, Worley P. Synaptic clustering of AMPA receptors by the extracellular immediate-early gene product Narp. Neuron. 1999;23:309–323. doi: 10.1016/s0896-6273(00)80782-5. [DOI] [PubMed] [Google Scholar]
- Paxinos G, Watson C. The Rat Brain in Stereotaxic Co-Ordinates. 2nd ed Academic Press; London: 1986. [Google Scholar]
- Petralia RS, Esteban JA, Wang Y-X, Partridge JG, Zhao H-M-, Wenthold RJ, Malinow R. Selective acquisition of AMPA receptors over postnatal development suggests a molecular basis for silent synapses. Nat. Neurosci. 1999;2:31–36. doi: 10.1038/4532. [DOI] [PubMed] [Google Scholar]
- Pickard L, Noel J, Duckworth JK, Fitzjohn SM, Henley JM, Collingridge GL, Molnar E. Transient synaptic activation of NMDA receptors leads to the insertion of native AMPA receptors at hippocampal neuronal plasma membranes. Neuropharmacology. 2001;41:700–713. doi: 10.1016/s0028-3908(01)00127-7. [DOI] [PubMed] [Google Scholar]
- Rao A, Harms KJ, Craig AM. Neuroligation: building synapses around the neurexin-neuroligin link. Nat. Neurosci. 2000;3:747–749. doi: 10.1038/77636. [DOI] [PubMed] [Google Scholar]
- Ripellino JA, Neve RL, Howe JR. Expression and heteromeric interactions of non-NMDA glutamate receptor subunits in the developing and adult cerebellum. Neuroscience. 1998;82:485–497. doi: 10.1016/s0306-4522(97)00296-0. [DOI] [PubMed] [Google Scholar]
- Robain O, Bideau I, Farkas E. developmental changes of synapses in the cerebellar cortex of the rat. A quantitative analysis. Brain Res. 1981 doi: 10.1016/0006-8993(81)90095-0. [DOI] [PubMed] [Google Scholar]
- Rodríguez-Ithurralde D, Silveira R, Barbeito B, Dajas F. Fasciculin, a powerful anticholinesterase polypeptide from Dendroaspis angusticeps venom. Neurochem. Int. 1983;5:267–274. doi: 10.1016/0197-0186(83)90028-1. [DOI] [PubMed] [Google Scholar]
- Rodríguez-Ithurralde D, Olivera S, Vincent O, Maruri-Pigni A. In vivo and in vitro studies of glycine- and glutamate-evoked acetylcholinesterase release from spinal motor neurones: implications for ALS/MND pathogenesis. J. Neurol. Sci. 1997;152(S.1):S54–S61. doi: 10.1016/s0022-510x(97)00245-1. [DOI] [PubMed] [Google Scholar]
- Rossner S, Schliebs R, Perez-Polo JR, Wiley RG, Bigl V. Differential changes in cholinergic markers fron selected brain regions after specific immunolesions of the rat cholinergic basal forebrain system. J. Neurosci. Res. 1995a;40:31–43. doi: 10.1002/jnr.490400105. [DOI] [PubMed] [Google Scholar]
- Rossner S, Schliebs R, Bigl V. 192IgG-saporin-induced immunotoxic lesions of cholinergic basal forebrain system differentially affect glutamatergic and GABAergic markers in cortical rat brain regions. Brain Res. 1995b;696:165–176. doi: 10.1016/0006-8993(95)00844-g. [DOI] [PubMed] [Google Scholar]
- Scheiffele P, Fan J, Choih J, Fetter R, Serafini T. Neuroligin expressed in non-neuronal cells triggers presynaptic development in contacting axons. Cell. 2000;101:657–669. doi: 10.1016/s0092-8674(00)80877-6. [DOI] [PubMed] [Google Scholar]
- Schierle GS, Gander JC, D’Orlando C, Ceilo MR, Vogt Weisenhorn DM. Calretinin-immunoreactivity during postnatal development of the rat isocortex: a qualitative and quantitative study. Cereb. Cortex. 1997;7:130–142. doi: 10.1093/cercor/7.2.130. [DOI] [PubMed] [Google Scholar]
- Sharma KV, Bigbee JW. Acetylcholinesterse-antibody treatment results in neurite detachmnet and reduced outgrowth from cultured neurons: further evidence for a cell-adhesive role for neuronal acetylcholinesterase. J. Neurosci. Res. 1998;53:454–464. doi: 10.1002/(SICI)1097-4547(19980815)53:4<454::AID-JNR7>3.0.CO;2-5. [DOI] [PubMed] [Google Scholar]
- Sheardown MJ, Nielsen EØ, Hansen AJ, Jacobsen P, Honoré T. 2,3-Dihydroxy-6-nitro-7-sulfamoyl-benzo[f]quinoxaline: a neuroprotectant for cerebral ischemia. Science. 1990;247:571–574. doi: 10.1126/science.2154034. [DOI] [PubMed] [Google Scholar]
- Shi SH, Hayashi Y, Petralia RS, Zaman SH, Wenthold RJ, Svoboda K, Malinow R. Rapid spine delivery and redistribution of AMPA receptors after synaptic NMDA receptor activation. Science. 1999;284:1811–1816. doi: 10.1126/science.284.5421.1811. [DOI] [PubMed] [Google Scholar]
- Song JY, Ichtchenko K, Südhof TC, Brose N. Neuroligin 1 is a postsynaptic cell-adhesion molecule of excitatory synapses. Proc. Natl. Acad. Sci. U.S.A. 1999;96:1100–1105. doi: 10.1073/pnas.96.3.1100. [DOI] [PMC free article] [PubMed] [Google Scholar]
- Soreq H, Seidman S. Acetylcholinesterase—new roles for an old actor. Nat. Rev. Neurosci. 2001;2:294–302. doi: 10.1038/35067589. [DOI] [PubMed] [Google Scholar]
- Sternfeld M, Ming G-L, Song H-J, Sela K, Timberg R, Poo M-M, Soreq H. Acetylcholinesterase enhances neurite growth and synapse development through contributions of its hydrolytic capacity, core protein and variable C termini. J. Neurosci. 1998;185:1240–1249. doi: 10.1523/JNEUROSCI.18-04-01240.1998. [DOI] [PMC free article] [PubMed] [Google Scholar]
- Tocco G, Massicotte G, Standley S, Thompson RR, Baudry M. Phospholipase A2-induced changes in AMPA receptor: an autoradiographic study. Neuroreport. 1992;3:515–518. [PubMed] [Google Scholar]
- Tönnes J, Stierli B, Cerletti C, Behrmann JT, Molnar E, Streit P. Regional distribution and developmental changes of GluR1-flop protein revealed by monoclonal antibody in rat brain. J. Neurochem. 1999;73:2195–2205. [PubMed] [Google Scholar]
- Villalobos J, Rios O, Barbosa M. Postnatal development of cholinergic system in mouse basal forebrain: acetylcholinesterase histochemistry and choline-acetyltransferase immunoreactivity. Int. J. Dev. Neurosci. 2001;19:495–502. doi: 10.1016/s0736-5748(01)00034-x. [DOI] [PubMed] [Google Scholar]
- White EL, Weinfeld L, Lev DL. A survey of morphogenesis during the early postnatal period in PMBSF barrel of mouse SmI cortex with emphasis on barrel D4. Somatosens. Mot. Res. 1997;14:34–55. doi: 10.1080/08990229771204. [DOI] [PubMed] [Google Scholar]
- Wu GY, Malinow R, Cline HT. Maturation of a central glutamatergic synapse. Science. 1996;274:972–976. doi: 10.1126/science.274.5289.972. [DOI] [PubMed] [Google Scholar]
- Zhao M, Wenthold RD, Petralia RS. Glutamate receptor targeting to synaptic populations on Purkinje cells is developmentally regulated. J. Neurosci. 1998;18:5517–5528. doi: 10.1523/JNEUROSCI.18-14-05517.1998. [DOI] [PMC free article] [PubMed] [Google Scholar]