

Abstract
Little is known about the dynamics of the dendritic transport of α-amino-3-hydroxy-5-methyl-4-isoxazole propionic acid receptors (AMPARs) to synapses. Here, using virally expressed green fluorescent protein (GFP)-GluR1 and GFP-GluR2 and confocal photobleach techniques we show near real-time movement of these subunits in living cultured hippocampal neurons. GFP-GluR1 fluorescence was widely distributed throughout the extranuclear compartment with no evidence for discrete intracellular stores. GFP-GluR1 transport was predominantly proximal to distal at rates of 0.2-0.4 μm·s−1. GFP-GluR2 fluorescence was more punctate and localized at or close to the plasma membrane. Overall, GFP-GluR2 movement was less dynamic with distinct mobile and immobile pools. Neither activation nor inhibition of surface-expressed N-methyl-D-aspartate receptors or AMPARs had any significant effect on the rates of GFP-GluR1 or GFP-GluR2 dendritic transport. These results demonstrate that GluR1 is constitutively and rapidly transported throughout the neuron. GluR2, on the other hand, is less mobile, with a majority retained in relatively immobile membrane-associated clusters, with ~40% showing synaptic co-localization. Furthermore, the transport of both subunits is activity-independent, suggesting that the regulated delivery of AMPARs to the vicinity of synapses is not a mechanism that is involved in processes such as synaptic plasticity.
AMPARs1 mediate the overwhelming majority of fast excitatory neurotransmission in the mammalian central nervous system, and their involvement in the mechanisms underlying synaptic stabilization and plasticity is well established (1-3). However, immunocytochemical studies demonstrate that only 30–50% of AMPARs are surface-expressed in neurons (4, 5) and that a significant proportion of the intracellular receptors are located within dendrites (6, 7). Until recently synapses were considered to be comparatively stable structures, and the receptor population within the postsynaptic membrane was thought to be relatively static, with a constitutive turnover of surface-expressed receptors on the order of hours to days (5, 8, 9). More recent results, however, have demonstrated that dendritic spines are highly mobile under basal conditions (10, 11).
Significant advances have been achieved toward understanding the exocytosis and endocytosis of AMPARs at synapses. For example, in hippocampal slice cultures virally expressed AMPAR subunits tagged with green fluorescent protein (GFP) have been used to suggest that GluR1/GluR2 receptors are added to synapses during plasticity via a process that requires interactions with PDZ domain proteins. In contrast, GluR2/GluR3 receptors replace existing synaptic receptors in a constitutive manner dependent in part on interactions of GluR2 with N-ethylmaleimide-sensitive factor. This combination of regulated addition and continuous replacement of synaptic receptors has been proposed as one mechanism for long term changes in synaptic efficacy (12).
By comparison to the regulation of endocytosis/exocytosis at the synapse, far less information is available about the intracellular transport of AMPARs. Therefore, here we have focused on the mechanisms of AMPAR delivery to the vicinity of the postsynaptic membrane. The current consensus is that most, but most likely not all, AMPAR subunits are translated and assembled into complexes in the cell body and are then packaged into vesicles that are transported to appropriate synaptic destinations along dendritic microtubules by motor proteins. For example, it has been shown recently that inhibition of the microtubule motors dynein or kinesin by monoclonal antibodies substantially reduced synaptic AMPAR- but not N-methyl-D-aspartate receptors-mediated responses (13).
In this study we have directly visualized the intracellular transport of AMPARs using virally transfected GFP-GluR1 or GFP-GluR2 in dispersed cultures of hippocampal neurons. Consistent with previous immunocytochemical data for native GluR1 from our cell cultures (7), we demonstrate that intracellular GFP-GluR1 is widely distributed throughout the somatodendritic compartment. By contrast GFP-GluR2 shows a more punctate and largely membrane-associated distribution. Both GFP-GluR1-containing and GFP-GluR2-containing receptors are surface-expressed, with a synaptic distribution indistinguishable from native AMPARs. Our imaging experiments indicate that the majority of GFP-GluR1s and GFP-GluR2s form homomeric assemblies, although interestingly, co-immunoprecipitation results suggest a small proportion of the recombinant subunits can assemble with native subunits to form heteromeric receptors. We assessed the rates and directions of AMPAR movement using fluorescence recovery after photobleach (FRAP) and fluorescence loss in photobleach (FLIP) techniques. GFP-GluR1 is transported in dendrites at rates comparable with fast axonal transport (0.2–0.4 μm·s−1) and moves in a predominantly, but not exclusively, proximal to distal anterograde direction. Most GFP-GluR2 is less mobile and appears to be largely retained at membrane-associated clusters, with 44 ± 6% showing synaptic colocalization.
EXPERIMENTAL PROCEDURES
DNA Constructs
The fusion of enhanced GFP (EGFP; Clontech) and rat GluR1(flop) was generated by overlapping PCR and standard molecular biology techniques. The construct was assembled in pcDNA1/Amp vector (Invitrogen) and then introduced into pSinRep5 Sindbis virus vector (Invitrogen (14).
Cell Culture
Primary hippocampal cultures were prepared from embryonic day-18 rat pups. Briefly, hippocampi were dissected in Hepes-buffered saline solution and dissociated by15 min of incubation in 10% trypsin-EDTA solution (Invitrogen) and trituration. Neurons were plated at a density of 15–25000 cells/cm2 on poly-l-lysine-treated 22-mm-diameter coverslips (BDH, borosilicate glass) in Neurobasal™ medium with B-27 supplement (Invitrogen) and 2% fetal calf serum (Sigma). Cultures were maintained at 37 °C in 5% CO2. One-quarter of the growth medium without serum was exchanged 3 days after plating and twice a week thereafter. Neurons with developed dendritic arbors (16–36 days in culture) were used for the experiments.
Western Blots
Neurons were scraped into solubilization mixture (1.5% sodium deoxycholate, phosphate-buffered saline (pH 7.4), 10 mM EDTA, Complete™ protease inhibitor mixture (Roche Applied Science), sonicated 6 × 10 s on ice, and incubated for 1 h at 4 °C. The supernatant was cleared by centrifugation, subjected to SDS-PAGE, and blotted onto polyvinylidene difluoride membranes. Blots were probed with antibodies as indicated in the Fig. 1 legend. Detection was by horseradish peroxidase-conjugated secondary antibodies (Sigma) and ECL (Amersham Biosciences).
FIG. 1. Expression of GFP-GluR1 and GFP-GluR2 in cultured neurons.

A1, immunoblots of neurons infected with GFP-GluR1 (lanes 1, 4, and 7), GFP-GluR2 (lanes 2, 5, and 8), or GFP (lanes 3, 6, and 9). Lanes 1–3 were probed with anti-GluR1 antibody, lanes 4–6 were probed with anti-GluR2 antibody, and lanes 7–9 were probed with anti-GFP antibody. The blots are representative of three separate experiments. A2, low levels of GFP-GluR1 co-immunoprecipitate with GluR2 (probed with anti-GFP antibody (lanes 1–3)) and GFP-GluR2 with GluR1 (probed with anti-GluR2 antibody (lanes 4 and 5). Lane 1, GFP-GluR1 co-immunoprecipitate with anti-GluR2 antibody in GFP-GluR1 infected neurons; lane 2, lack of co-immunoprecipitate with anti-GluR2 antibody in non-infected neurons; lane 3, supernatant of infected neurons; lane 4, lack of co-immunoprecipitate with anti-GluR1 antibody in non-infected neurons; lane 5, GFP-GluR2 and GluR2 coimmunoprecipitate with anti-GluR1 antibody in GFP-GluR2 infected neurons. B, dendritic and spine morphology of representative hippocampal neurons infected with GFP-GluR1. Scale bars, 30 μm. B1, whole cell image of typical 21 DIV neuron displaying dendritic spines; B2, higher magnification of spiny dendrites; B3, cell typical of 21 DIV neurons that do not have spines; B4, enlargement of part of dendritic tree from a non-spiny neuron. C, representative example of photobleaching in a neuron displaying immobile granulated fluorescence. Typically, cells with this phenotype accounted for less than 51% of neurons in any given field. No recovery in fluorescence was observed in any experiments, demonstrating that once bleached, individual GFP molecules do not recover. Scale bar = 7.5 μm.
Co-immunoprecipitation Assays
5 μg of mouse anti-GluR2 monoclonal (MAB397-Chemicon) or rabbi anti-GluR1antibody (AB1504-Chemicon) antibody was incubated for 2 h with 500 μl of 1% Triton X-100-solubilized P2 extract from cultured neurons (0.5 mg total protein). The antibodies were bound to 20 mg of pre-washed protein-A-Sepharose beads (CL-4B, Sigma P-3391). After incubation for 1 h at 4 °C the beads were washed 5 times with NETN buffer (20 mM Tris-Cl, 1 mM EDTA, 100 mM NaCl, and 1% IGEPAL CA-630 (Sigma) plus 900 mM NaCl) and then once with NETN. The retained protein was eluted with 2× loading buffer and subjected to SDS-PAGE and Western blotting.
Immunocytochemistry
For intracellular localization neurons were fixed in 4% paraformaldehyde in Hepes-buffered saline (pH 7.4) for 10 min and where appropriate permeabilized with 0.1% Triton X-100 for 10 min. The cultures were incubated with 3% bovine serum albumin for 30 min at 37 °C to block nonspecific staining. All incubations with antibodies were performed in 3% bovine serum albumin. Enhanced GFP was detected with anti-GFP rabbit polyclonal antibodies (Chemicon, 10 μg·ml−1), and surface-expressed GluR1 was stained with anti-GluR1 (N-terminal) rabbit polyclonal antibody (Oncogene, 10 μg·ml−1). Synapses were labeled with anti-SV2A rabbit polyclonal antibody (Calbiochem, 5 μg·ml−1) and surface-expressed GluR2 with anti-GluR2 (N-terminal) monoclonal antibody (Chemicon, 10 μg·ml−1). For live staining neurons were incubated in primary antibodies for 30 min at room temperature. Appropriate secondary antibodies were applied for 60 min. Secondary antibodies were conjugated to Alexa Fluor® 594 (Molecular Probes, 2 μg·ml−1), fluorescein isothiocyanate (Sigma, 2 μg·ml−1), or Cy5.5 (Abcam, 2 μg·ml−1). Images were obtained by confocal scanning using Leica TCS NT microscope. Randomly selected neurons were analyzed to determine the degree of colocalization. Clusters were considered colocalized if greater than 50% of their pixels were shared.
Live Cell Imaging and Data Analysis
Neurons were equilibrated for 15 min in Hepes-buffered saline. During all experiments cells were kept in Hepes-buffered saline at 37 °C. The glycine LTP induction protocol was performed exactly as described previously (15) with 200 μM glycine for 3 min. The neurons were used for bleaching experiments 15–20 min after the glycine was washed off. In experiments where all glutamatergic synaptic transmission was blocked 100 μM dl-aminophosphonovaleric acid, 100 μM NBQX, and 0.5 μM tetrodotoxin were included in the Hepes-buffered saline.
Fluorescence imaging was performed with a Leica TCS SP2 system with 40× oil immersion lens. Excitation was at 488 nM, and detection was between 500 and 575 nm. Normally a single confocal slice was taken at each time point. In FRAP experiments a pre-bleach image was acquired, and then a rectangular area was bleached with high power (800 microwatts) laser light for 15–20 scans at 1 s per scan. In FLIP experiments an area with diameter ~2–5 μm was repeatedly bleached with a focused laser beam (peak intensity 800 microwatts) for 0.5-1 s with subsequent imaging after each bleaching pulse. Images (not more than 30) were collected as appropriate with time intervals ranging from 1 frame every 5 s to 1 frame every 2 min. For quantification of fluorescence loss/recovery in FLIP or FRAP experiments fluorescence levels from designated areas of a dendrite were determined. Data from each frame was saved to a Microsoft Excel spreadsheet file and compiled and analyzed using Scion Image program (Scion Corp.). To quantify changes of fluorescence in a dendritic region of interest, levels were directly compared with corresponding control regions of equal size from unbleached segments of the same dendrite. Pre-bleach fluorescence in selected areas was normalized to 100%, and background fluorescence of the image was set as 0%. To equalize the initial levels of fluorescence dendritic shafts we used a coefficient (k) that relates the fluorescence level to the shaft diameter at the point of measurement (F1 = kF2, where k = D12/D22, F1 and F2 are fluorescence levels, and D1 and D2 are the diameters of the dendritic shaft at the measurement point).
RESULTS
Characterization of GFP-GluR1 and GFP-GluR2 Expressed in Neurons
We constructed fusion proteins of GluR1 and GluR2 tagged at the extracellular N terminus, with GFP inserted four residues downstream of the end of the signal peptide sequence. GFP-GluR1 and GFP-GluR2 were then cloned into the pSinRep5 Sindbis virus expression vector. The integrity of the GFP-GluR fusions expressed in neurons was confirmed by Western blots. When probed with an anti-GluR1 or anti-GluR2 antibody, respectively, GFP-GluR1 or GFP-GluR2-infected cells showed a band that corresponded to the predicted size of the GFP-GluR fusion protein. Bands of identical mass were detected using an anti-GFP antibody. No free GFP immunoreactivity was detected in these cells, indicating that all of the GFP fluorescence could be attributed solely to the GFP-GluR fusions. In GFP only or non-infected cells, a less intensely stained band of lower molecular weight was detected with anti-GluR1 and anti-GluR2 antibodies corresponding to the native subunits. Anti-GFP antibody detected a strong immunoreactive band in GFP-infected cells with the correct Mr value for free EGFP. No GFP immunoreactivity was detected in non-infected cells (Fig. 1A1).
To determine whether the virally expressed GFP subunits could co-assemble with endogenous native subunits we performed co-immunoprecipitation assays. Because of technical limitations due to the species in which the anti-GFP, anti-GluR1, and anti-GluR2 antibodies were raised, experiments had to be carried out in different ways for GluR1 and GluR2. As shown in Fig. 1A2, low levels of GFP-GluR1 were detected in anti-GluR2 immunoprecipitate, and low levels of GFP-GluR2 were present in anti-GluR1 immunoprecipitate. However, these heteromeric receptors account for only a minor proportion of the total GFP-GluR1 or GFP-GluR2 expressed.
We next investigated the overall integrity of the virally infected neurons. For imaging experiments the Sindbis viruses were titrated such that ~30% of neurons expressed GFP, GFP-GluR1, or GFP-GluR2. Over the time scale of our experiments, up to 72 h, the morphology of the cells was unchanged. Neurons infected with GFP alone exhibited strong fluorescence throughout the entire cell including the nucleus. GFP-GluR1-infected neurons displayed a relatively uniform distribution of GFP-GluR1 with fluorescence present throughout the extranuclear somatodendritic compartments. As described below, GFP-GluR2-infected neurons showed a different distribution of somatodendritic fluorescence. The absence of nuclear fluorescence in the GFP-GluR1- or GFP-GluR2-expressing neurons confirms the immunoblot data, indicating that no free GFP is present in GFP-GluR1/GluR2-infected neurons. In many older neurons (20–30 days in vitro) dendritic spines were clearly defined (Fig. 1, B1 and B2).
Photobleaching of GFP
In a small proportion (<1%) of cells very bright, completely immobile granules of GFP fluorescence were observed throughout the dendrites. These granulated cells were not permeable to trypan blue or ethidium bromide, suggesting they were not dead. However, it is likely that the granulated appearance was indicative of unhealthy, possibly dying cells. These neurons provided a convenient assay system to investigate the characteristics of GFP photobleaching. Repetitive illumination of defined areas of these cells resulted in the very rapid and complete loss of fluorescence from the granules. Importantly, the fluorescence did not return over time, indicating that once bleached individual GFP molecules did not recover their fluorescence (Fig. 1, C1–3). Therefore, in our experiments the reappearance of fluorescence in bleached areas of healthy neurons can be attributed solely to the translocation of new GFP molecules into the bleached area.
Localization of GFP-GluR1 and GFP-GluR2 in Neurons
To establish that the GFP-GluR1 and GFP-GluR2 constructs are handled by neurons similarly to native receptor subunits we investigated the immunocytochemical localization and surface expression of native AMPARs and GFP-GluR1 and GFP-GluR2 (Fig. 2, A–E). The distributions of GFP-GluR1 and endogenous GluR1/GluR2 puncta were similar. 93 ± 3% of GFP puncta colocalized with endogenous GluR2 (35 dendritic segments from 16 neurons in 3 separate culture preparations). As expected, surface-expressed endogenous GluR1 and GluR2 were highly colocalized (98 ± 2%, n = 200 randomly selected GluR1 clusters analyzed). Furthermore, 91 ± 4% of surface GluR2 puncta were at synapses, identified with the synaptic marker SV2a (n = 200 randomly selected GluR2 clusters analyzed). Because the anti-GFP and anti-SV2a antibodies were raised in the same species it was not possible to directly compare surface GFP-GluR1 to SV2a, but the high degree of colocalization of GFP immunoreactivity with GluR2 indicates that surface-expressed GFP-GluR1s were also predominantly synaptic. Similarly for GFP-GluR2, there was 92 ± 4% colocalization with native GluR1 puncta and 44 ± 6% colocalization with the synaptic marker synaptotagmin (20 dendritic segments from 5 neurons in 2 separate culture preparations; n = 200 randomly selected GluR2 clusters analyzed for each comparison).
FIG. 2. Distribution of GFP-GluR1 and GFP-GluR2 in neurons.

Immunostaining of embryonic hippocampal neurons, 22–36 DIC (days in culture). A, triple labeled non-permeabilized neurons using anti-GFP antibody (red channel), anti-GluR2-N-terminal (blue channel), and intrinsic GFP-GluR1 fluorescence (green channel). Pink reflects colocalization of surface-expressed GFP-GluR1 and -GluR2. In most cases the intrinsic GFP-GluR1 fluorescence was not sufficiently intense in comparison to the antibody signals to produce white (triple colocalization) puncta. B, mainly synaptic localization of AMPARs in non-infected neurons. Anti-SV2a antibody (green channel) and anti-GluR2-N-terminal antibody (red channel) colocalization is seen as yellow puncta. C, colocalization of GluR1 and GluR2 in non-infected neurons. These images are representative of multiple fields from at least three separate experiments. D, punctate distribution of intrinsic GFP-GluR2 fluorescence (green channel) and surface staining with anti-GFP antibody (red channel). E, triple-labeled neurons using anti-GluR1 (red channel) and anti-synaptotagmin antibodies (blue channel) and intrinsic GFP-GluR2 fluorescence (green channel). White reflects colocalization of GFP-GluR2, GluR1 in synaptic area. F, GFP-GluR2 displays a punctate largely membrane-associated distribution in dendrites: 1, 12 h; 2, 18 h, and 3) 24 h after infection. G, labeling of surface-expressed GFP-GluR1 and GFP-GluR2 in live neurons with anti-GFP antibodies. Green channel, intrinsic GFP fluorescence; red channel, anti-GFP antibodies. In all panels the scale bars = 30 or 5 μm for the higher magnification insets.
Compared with GFP-GluR1, GFP-GluR2 imaged in living neurons exhibited a much less evenly distributed, more granulated pattern of fluorescence. 12–20 h after infection GFPGluR2 partitioned in to the membrane and submembrane areas (Fig. 2F). At later expression time points (18–26 h) the GFP-GluR2 fluorescence in the perimembrane area formed distinct puncta in 68 ± 12% (n = 600) of the dendrite sections sampled. As described below, repeated photobleaching of a defined area of dendrite resulted in the relatively rapid loss of diffused fluorescence, whereas the membrane-associated puncta were comparatively resistant to FLIP. Therefore, to check if these clusters corresponded to surface-expressed receptors, we labeled live neurons with anti-GFP antibody (Fig. 2G). The GFP-GluR1 fluorescence was diffuse throughout the cell, whereas 44 ± 8% of the GFP-GluR2 clusters colocalized with surface-expressed GFP-GluR2s, indicating that more than half of the clusters observed represent intracellular pools of GluR2 (30 dendritic segments analyzed in 3 separate experiments). Our immunolocalization experiments suggested that GFP-GluR1- and GFP-GluR2-expressing neurons are indistinguishable from non-infected neurons in terms of AMPAR processing. For example, the distribution of GluR2 was identical in both GFP-GluR1-expressing and non-infected cells. However, we further considered the possibility that viral expression of GFP-GluR1 or GFP-GluR2 could interfere with the normal protein processing in the Golgi and/or trafficking. We, therefore, performed Western blots to determine the level of GFP-GluR1 or GFP-GluR2 as a proportion of the corresponding endogenous subunit in neurons. In these experiments the level of GFP-GluR1 expression was 60 ± 20% of native GluR1 and the level of GFP-GluR2 expression was 80 ± 30% of native GluR2 (n = 3).
To evaluate the ratio of GFP-GluR1 or GFP-GluR2 expression to endogenous subunit levels in live cell imaging experiments the maximum fluorescence intensity from the cell body of 40 neurons (4 separate experiments infected with the same viral titer for each construct) was measured. The fluorescence value for each neuron was categorized into one of n (usually 7–8) groups, each with a mean relative fluorescence level (Fi). If mi neurons have a relative fluorescence intensity ranging from Fi−1 to Fi, then for a neuron with relative fluorescence level F the ratio of the amount of GFP-GluR (Af) and endogenous GluR (A) can be calculated from the equation,
| (Eq. 1) |
where K is the ratio of overall expression levels of GFP fusion and endogenous protein (60 ± 20% for GFP-GluR1 and 80 ± 30% for GFP-GluR2). In all of our experiments we used neurons displaying 20–25% of maximal fluorescence, corresponding to a 0.25–0.35 Af/A ratio. This calculation allowed us to determine the relative levels of expression of GFP-GluR1 and GFP-GluR2 from fluorescence measurements alone. Our results demonstrate comparatively modest levels expression. This calculation was performed for every newly amplified stock of the virus, whenever the amount of virus added to neurons was altered, and whenever there were differences in the density of neurons plated per coverslip.
Direction of GFP-GluR1 Transport in Dendrites
We next determined the direction of AMPAR movement in dendrites by photobleaching a defined section of dendrite and monitoring the fluorescence recovery (FRAP). We hypothesized that the reappearance of fluorescence in the bleached areas would occur incrementally, moving in a proximal to distal direction. To our surprise, very different results were obtained for GFP-GluR1 and GFP-GluR2.
GFP-GluR1 FRAP occurred in a predominantly proximal to distal direction but also with a slower recovery in a distal to proximal direction. In most experiments the initial fluorescence recovery was rapid, with levels returning to 70–80% of the original within 1–2 min of bleaching. Complete recovery to original pre-bleach levels of fluorescence took 20–40 min. Recovery of GFP-GluR2 fluorescence was also bidirectional but slower with ~36 ± 8% (in proximal point of bleached segments) and 22 ± 6% (in distal points) recovery of pre-bleach fluorescence levels after 1 min compared with 66 ± 12 and 44 ± 7% for GFP-GluR1 (Fig. 3) Mann-Whitney confidence U-tests confirm the significance of the difference in recovery between GFP-GluR1 and GFP-GluR2 FRAP (UG2 = 3 << Ust = 114 for p = 0.01, proximal points; UG2 = 8 << Ust = 114 for p = 0.01, distal points).
FIG. 3. FRAP of GFP-GluR1 and GFP-GluR2 in living neurons.

A, examples of GFP-GluR1 (1) and GFP-GluR2 (2) FRAP in 24 DIC (days in culture) neurons. The boxed areas were photobleached. Time stamp: min:s after bleaching. Scale bar = 10 μm. In all cases the left of the dendrite is proximal (p), and the right is distal (d). B, quantification of the fluorescence intensity at points p and d as a function of time (1, GFP-GluR1; 2, GFP-GluR2). C, percentage of initial fluorescence recovery in FRAP experiments 1 min after photobleach. 40-μm segments were bleached in neurons infected with GFP-GluR1 or GFP-GluR2 (20 dendrites each in 3 separate experiments). Fluorescence was measured at proximal (p) and distal (d) points of bleached dendrite segments.
A complementary technique to FRAP is fluorescence loss in photobleaching (FLIP). In this procedure a defined area of the cell is repeatedly photobleached so that GFP molecules are inactivated as they pass through. Transport of the bleached molecules elsewhere in the neuron results in fluorescence loss. The example images in Fig. 4A show that repeated bleaching of an area of GFP-GluR1-expressing dendritic shaft caused a marked loss of GFP-GluR1 fluorescence in the soma and other dendrites of the same cell. These data are consistent with movement of receptors from the dendrite back to the soma and then out again to different dendrites. Therefore, our results suggest the rapid, widespread and bi-directional movement of GluR1 throughout the neuron. Consistent with the FRAP data indicating slower, more restricted movement of GFP-GluR2, the FLIP protocol in GFP-GluR2-expressing neurons did not result in detectable fluorescence loss in regions of the cell remote from the bleaching point (data not shown).
FIG. 4. Properties of GFP-GluR1 and GFP-GluR2 transport.

A, effects of repeated photobleaching at a single point on the fluorescence intensity at regions distant from the bleaching point. Repeated bleaching at point b on a dendrite of a neuron (18 DIC (days in culture)) expressing GFP-GluR1 caused a marked loss of fluorescence in other dendrites and the soma of the same cell. 1, before photobleaching; 2, 6 min after the start of the bleaching protocol. The darker the image the brighter the fluorescence. Scale bar = 10 μm. B, comparison of the average times of FRAP to 70% (GFP-GluR1) or 30% (GFP-GluR2) of the initial level measured in spines and in the equal size-adjoined area of dendritic shaft. 5–7 spines per dendrite segment were bleached in 5 neurons in 4 independent experiments. The data are taken from 18 spines in 3 neurons for each condition. The shaded columns show the mean recovery times in spines, and the unshaded columns show recovery in the adjoined segments of dendritic shaft. There was no difference between speed of recovery for GFP-GluR1, but FRAP for GFP-GluR2 took ~34% longer in spines than in the dendritic shaft (p < 0.01). C, dendritic spines undergo FRAP in GFP-GluR1-infected neurons at the same rate as the dendritic shaft (left set of panels). GFP-GluR2 displays a different rate of recovery in the spine to the shaft (right set of panels). FRAP in spines after a single photobleach of the entire area shown. Time stamp: min·s. Scale bar = 2 μm. The color scale was set such that all fluorescence values (in arbitrary units) greater than 60% are shown as red. In all cases the left of the dendrite is proximal, and the right is distal. D, uniform fluorescence loss of GFP-GluR1 but not GFP-GluR2. High resolution images showing that after repeated photobleaching (area of bleaching is circled) there was progressive and uniform fluorescence loss of GFP-GluR1 in adjoining areas to the bleached point (b). In contrast, there was less GFP-GluR2 fluorescence loss, and clusters of fluorescence were resistant to FLIP, indicating less diffusible pools of GFP-GluR2. Time stamp: min·s. Scale bar = 2.5 μm.
Transport to Dendritic Spines
The transport of GFP subunits to the immediate post-synaptic region was investigated in the cells that displayed prominent dendritic spines. Both the dendritic shaft and spines recover fluorescence at similar rates under basal, non-stimulated conditions (Fig. 4B and left-hand panels of Fig. 4C). These results suggest that in dispersed cultured hippocampal neurons GFP-GluR1 has free access to the dendritic spines.
For GFP-GluR2, FRAP in the dendritic shaft and spines was slightly different. The mean time of FRAP to 30% of pre-bleach levels in spines was 34% longer (145 ± 26 s) than in dendritic shaft (108 ± 10 s) (p < 0.01). Given that GFP-GluR2 shows a more clustered, perimembrane distribution than GFP-GluR1, these results suggest the presence of an increased proportion of immobile receptors in spines that are less freely exchangeable with the mobile pool (Fig. 4B and Fig. 4C, right panels).
In a separate set of experiments we tested the hypothesis that the rapid GFP-GluR1 and/or the slower GFP-GluR2 movements may be punctuated by periods of immobility at specific locations within the neuron. For example, there could be localized stores of receptors awaiting rapid insertion into the postsynaptic membrane in response to appropriate stimulation. To address this question we analyzed individual dendrites (Fig. 4D, left panels). Repeated bleaching of an area of dendritic shaft resulted in uniform fluorescence loss of GFP-GluR1 in adjoining areas to the bleached point. We saw no evidence in these higher resolution images or any other FLIP experiments for fluorescence loss-resistant regions that would be expected if there were pools of relatively immobile GFP-GluR1 receptors.
Rates of Transport in Dendrites under Basal Conditions
To determine the rates of anterograde GFP-GluR1 and GFP-GluR2 movement in dendrites more accurately we performed a series of experiments in which we monitored the loss of fluorescence at a defined location distal to the bleaching point (Fig. 5A). The delay in fluorescence loss is a function of the distance between the two points and gives a measure of rate of movement of the subunits. The measured rate of movement of GFP-GluR1 (Fig. 5B) varied from 0.03 to 0.53 μm·s−1 (n = 28) with more rapid rates of up to ~0.8 μm·s−1 (n = 4) detected in some experiments. To profile the speeds of distribution for GFP-GluR1 we used first derivative of Lagrange interpolation polynome for f(v) = (F − Fmin)/(F0 − Fmin), where F is the fluorescence change in FLIP, F0 is maximal fluorescence at the beginning of bleaching, and Fmin is the minimal fluorescence reached in FLIP. As shown in Fig. 5C, up to 50% of GFP-GluR1 molecules trafficked with speeds in the range 0.03–0.2 μm·s−1, and less than 5% trafficked with speeds higher than 0.5 μm·s−1.
FIG. 5. Rates of basal AMPAR transport determined by FLIP.

A, the fluorescence at point m was measured after repeated photobleaching at point b. Data are representative of data obtained from 24 neurons in 5–8 separate experiments each for GFP-GluR1 (1) and GFP-GluR2 (2) (only one dendrite per neuron was bleached). Time stamp: min:s. The color scale was set such that all fluorescence values (in arbitrary units) greater than 80% are shown as red. Scale bar = 50 μm. B, relative fluorescence intensity loss at point m as a function of time. C, speed distribution profile for GFP-GluR1. D, representative examples of different patterns of fluorescence loss in GFP-GluR1 (1) and GFP-GluR2 (2). Note faster moving lumenal and slower membraneassociated components of fluorescence loss in GFP-GluR2. Scale bar = 5 μm. In all cases the left of the dendrite is proximal, and the right is distal.
Because only a small percentage of the GFP-GluR2 fluorescence was bleached in FLIP it was not technically possible to detect fluorescence loss at sites remote to the bleaching point (100–200 μm; e.g. Fig. 5A2). Nevertheless, loss of diffused GFP-GluR2 fluorescence component in dendritic shafts was similar to GFP-GluR1 FLIP (Fig. 5, D1 and D2) and indicates the existence of a small rapidly trafficking pool of GluR2 molecules with speeds similar to GFP-GluR1 ones. We gained an estimation of the maximum speed of receptor trafficking from FRAP experiments by analyzing the beginning of FRAP in the middle of the bleached dendritic segment. These data indicate a maximum transport rate of 2.2 ± 0.6 μm·s−1 (n = 12) and were similar for both GFP-GluR1 and GFP-GluR2.
GFP-GluR1 and GFP-GluR2 Transport Rates Are Not Altered by AMPAR Activation
To determine whether the dendritic transport and/or spine delivery rates of GFP-GluR1 or GFP-GluR2 were altered by receptor activity, we monitored the mean percentage of initial fluorescence recovery in FRAP within 1 min after photobleach in dendritic shafts and spines in the presence of specific agonists or antagonists (Fig. 6A). Glutamate at concentrations ranging from 10 to 100 μM or AMPA at concentrations ranging from 1 to 100 μM before and during the imaging experiments (either in the presence or absence of 100 μM cyclothiazide to prevent AMPAR desensitization) had no significant effect on the rate of transport of either subunit.
FIG. 6. Activity independence of GFP-GluR1 and GFP-GluR2 transport.
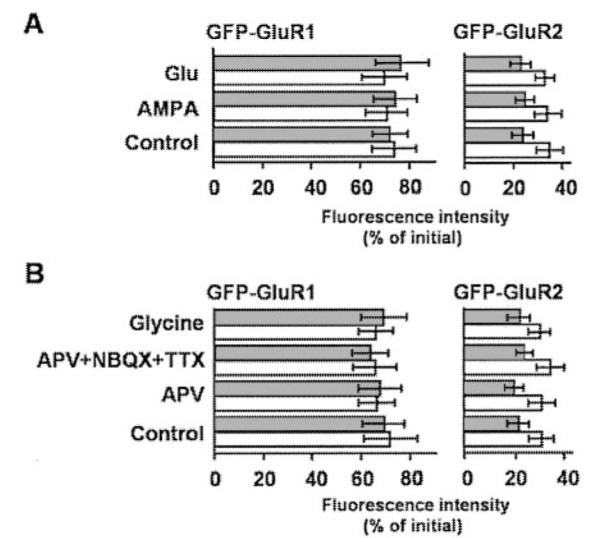
A, effects of agonists on GFP-GluR1 and GFP-GluR2 FRAP. The data are expressed as the percentage of initial fluorescence 1 min after photobleach in spines (shaded columns) and dendritic shafts (unshaded columns). Experiments were performed in the presence of glutamate (10 μM) or AMPA (2 μM) with or without 100 μM cyclothiazide to prevent AMPAR desensitization. Cyclothiazide had no effect, therefore, the data were pooled. The data are from 12 sections of separate dendrites from at least 4 neurons for each condition. B, glycine or AMPA and N-methyl-D-aspartate receptors antagonists have no effect on the rates of GFP-GluR1 or GFP-GluR2 FRAP in spines and shaft segments adjacent to the spine base. The data are taken from 18 spines on 3 neurons for each condition and are the percentage of initial fluorescence 1 min after photobleach in spines (shaded columns) and adjoined segments of dendritic shaft (unshaded columns). Aminophosphonovaleric acid (APV), 100 μM NBQX, and 0.5 μM tetrodotoxin (TTX).
Transport Rates Are Synaptic Activity-independent
Because dispersed cultures of hippocampal neurons display relatively high levels of spontaneous excitatory synaptic activity (16), we also investigated whether inhibiting synaptic activity with DL-aminophosphonovaleric acid (100 μM), NBQX (100 μM), and tetrodotoxin (0.5 μM) altered subunit transport (Fig. 6B). There was no effect on transport either in the dendritic shaft or delivery into spines.
Treatment with 200 μM glycine has previously been shown to evoke LTP and an increase in post-synaptic membrane insertion of AMPARs in cultured hippocampal neurons (15). We, therefore, investigated whether this glycine protocol influenced GFP-GluR1 and GFP-GluR2 transport in dendrites. As observed for both activation and blockade of AMPARs, the glycine treatment had no effect on FRAP recovery times determined within 30 min of the glycine treatment.
DISCUSSION
There has been significant recent progress toward understanding the exocytosis and endocytosis events involved in AMPAR surface expression at the postsynaptic membrane, but much less is known about the AMPAR delivery mechanisms to the vicinity synapse. In large part this has been due to the lack of suitable techniques to monitor protein movement inside neurons since immunocytochemical staining techniques are not well suited for the study of the transport intracellular proteins. The advent of GFP and efficient viral infection technologies, however, now provide powerful tools to study protein movement in near real time. Here we have used viral expression of GFP-GluR1 and GFP-GluR2 combined with the confocal microscopy techniques of FLIP and FRAP to begin to study AMPAR transport in cultured hippocampal neurons.
It has been proposed that GluR1 is the dominant subunit for regulating activity-dependent increases in the surface expression of AMPARs, whereas endocytosis and exocytosis of GluR2 subunits are constitutive (12). Furthermore, the PDZ protein synapse-associated protein 97 (SAP97) has recently been reported to interact with GluR1 mainly at early stages in the secretory pathway (17). In contrast to proteins that interact with GluR2, which have been shown to exert their main actions at the level of postsynaptic membrane insertion (for review, see Ref. 18), the SAP97-GluR1 interaction may be involved in activity-dependent targeting and/or trafficking of GluR1-containing AMPARs. Based on these models we, therefore, chose to investigate the dendritic transport of GluR1 and GluR2 since, if changes in transport rates are important determinants of receptor availability at the synapse, it might be expected that GluR1 would be the most tightly regulated, whereas movement of GluR2 might be more permissive. Surprisingly, in our experiments the reverse was observed. Overall GFP-GluR1 movement was rapid and extensive throughout the neuron, whereas GFP-GluR2 movement was less pronounced and showed a much more defined punctate pattern of distribution.
GFP-GluR1 and GFP-GluR2 as Markers for AMPAR Movement in Living Cells
Under our experimental conditions the level of GFP-GluR1 or GFP-GluR2 expressed in dispersed hippocampal cultures were at levels equivalent to the endogenous subunit levels. Co-immunoprecipitation experiments demonstrated that a fraction of the recombinant GFP-GluR1 and GFP-GluR2 subunits was capable of forming heteromeric receptor assemblies with endogenous subunits. However, the relative proportion of GFP-GluR1:endogenous GluR2 or GFP-GluR2:endogenous GluR1 assemblies was very low because in the imaging experiments GFP-GluR1 behaved markedly differently from GFP-GluR2. We, therefore, conclude that our imaging tracked the movement of either individual GFP-GluR1 or GFP-GluR2 subunits or, more likely, homomeric receptor assemblies of the recombinant subunits.
Both GFP-GluR1 and GFP-GluR2 displayed distributions consistent with native AMPARs, and their expression did not alter endogenous subunit levels or distributions. Immunolocalization experiments on living neurons demonstrated that both GFP-GluR1 and GFP-GluR2 were surface-expressed at synapses that also contained native AMPAR subunits. We did not detect GFP subunit-only synapses or extrasynaptic surface-expressed GFP subunit puncta. Taken together these data indicate that GFP-GluR1 was trafficked normally by neurons.
Transport of GFP-GluR1 and GFP-GluR2 in Dendrites
Both FLIP and FRAP experiments showed wide-ranging GFP-GluR1 movement in neurons, suggesting significant constitutive transport back and forth between different dendrites via the soma. For example, photobleaching a small area of one dendrite led to rapid fluorescence loss in the cell body and other dendrites of the same cell. Although these observations do not preclude a model where a proportion of homomeric GFP-GluR1 receptors are targeted to individual dendrites or even specific synaptic addresses, our data strongly support a synaptic capture system for the recruitment of these receptors. In this model GluR1 AMPARs migrate up and down dendrites awaiting “capture” by a synapse, similar to the proposal put forward for synaptic tagging and LTP (19). In marked contrast to GFP-GluR1, up to 80% of GFP-GluR2 (Fig. 3C) was comparatively immobile and preferentially located in the vicinity of membrane or submembrane area of dendritic shafts. The remaining GFP-GluR2 fluorescence exhibited the same diffuse pattern as GFP-GluR1 and behaved similarly in FRAP and FLIP experiments.
It was notable that we did not observe intracellular GFP-GluR1 or GFP-GluR2 fluorescence that appeared to correspond to specific trafficking vesicles in FRAP experiments. These results are consistent with antibody-staining approaches that have also shown high levels of AMPAR immunoreactivity in neurons, which in many cases is widely and relatively evenly distributed throughout the soma and dendrites (Refs. 7, 16, and 20-22; but see also Refs. 23 and 24). The simplest explanation for our results is that AMPAR-containing vesicles may be very numerous and too small to be resolved by our imaging system. Interestingly, however, data from immunogold electron microscopy studies have as yet also failed to reveal the presence of clusters of AMPARs inside the dendrite with very few nonsynaptic gold particles detected (25-28).
Intracellular Pools of AMPARs
If relatively stable aggregations of GFP-GluR1 or GFP-GluR2 occur they should be observed as bright spots of GFP-GluR1 fluorescence in FLIP experiments. For example, such clusters of fluorescence would be expected if stores of relatively immobile receptors were held at points for rapid synaptic insertion, as has been proposed in several models (29-32). In fact, in FLIP experiments GFP-GluR1 fluorescence was lost uniformly in all areas of the dendrite at the same rate within the temporal resolution of our experiments. Possible explanations for these findings include: 1) there are no intracellular aggregations (“pools”) of GFP-GluR1 AMPARs, 2) intracellular pools of receptors were not detected because the rate of exchange of GFP-GluR1 with surrounding mobile GFP-GluR1 was too rapid to be resolved, or 3) the actual number of GFP-GluR1 AMPARs in intracellular pools was too low to detect.
In contrast, GFP-GluR2 exhibited various immobile clusters of fluorescence in dendritic shafts, mainly situated in a perimembrane region. These clusters of GFP-GluR2 were relatively resistant to fluorescence loss in FLIP experiments but did undergo slow bleaching. We observed that GFP-GluR2 fluorescence was lost more rapidly in the center of the dendritic shaft. In FRAP experiments fluorescence rapidly recovered in the shaft of the dendrite to the prebleach low levels and then subsequently accumulated at the perimembrane clusters. Taken together these results suggest that the clusters comprise a more slowly exchangeable pool of GFP-GluR2. A likely explanation is that the GluR2 subunits in the clusters are aggregated and retained by PDZ-interacting proteins such as GRIP or PICK1, which do not interact with GluR1.
Trafficking into Dendritic Spines
In FRAP experiments on neurons with well defined dendritic spines GFP-GluR1 was transported into the spines at rates indistinguishable to that for the dendritic shaft under non-stimulated, basal conditions. In contrast, for GFP-GluR2 there was a slight difference in fluorescence recovery between spines and dendritic shafts. We propose that this difference reflects the fact that a greater proportion of the GFP-GluR2 present in spines is clustered and, therefore, less mobile. These results appear to differ from a model proposed for cultured hippocampal slice preparations infected with GFP-GluR1 (12). In those studies new GFP-GluR1, unlike new GFP-GluR2, was precluded from spines under non-stimulated conditions but entered spines in response to synaptic stimulation. An important difference is that our experiments use dispersed hippocampal cultures, which are highly amenable to imaging. The spontaneous activity in dispersed cultures is relatively high compared with slices (16), and this increased activity may facilitate spine access for GluR1. However, we saw no effect on the delivery of GFP-GluR1 to spines in the presence of antagonists to block spontaneous ionotropic glutamatergic synaptic activity.
Rates of AMPAR Transport
The initial rate of fluorescence recovery after bleaching for GFP-GluR1 was rapid, with ~70% recovery within 1–2 min. The subsequent recovery to prebleach fluorescence levels took considerably longer (20–40 min). This could be due to the rapid movement of GFP-GluR1 through the dendroplasm of the area subjected to bleaching, accounting for the initial recovery, whereas the return to prebleach levels requires the migration and/or insertion of GFP-GluR1 into the plasma membrane. Indeed there is electrophysiological evidence that extrasynaptic AMPARs are present all over the plasma membrane of neurons (33), but these are present at too low density to be detected by conventional immunostaining techniques. Furthermore, a recent study demonstrates the diffusion of AMPARs within the plasma membrane (34). The initial rate of FRAP for GFP-GluR2 was significantly (3–4 times) lower than for GFP-GluR1. We attribute this difference to a relatively high proportion of GFP-GluR2 (up to 80–90%) residing in comparatively immobile clusters. The smaller population of non-clustered GFP-GluR2 had similar rates of transport to GFP-GluR1 (0.028–0.53 μm·s−1 and up to 2.2 ± 0.6 μm·s−1) are in line with rates for other proteins and vesicles in cultured hippocampal neurons. For example, RNA/RNA-binding protein-containing granules translocate at 0.05–0.3 μm·s−1 (35). Vesicles containing transferrin receptors are transported at 0.2–2.8 μm·s−1 (36, 37), and similar dynamics (1–2 μm·s−1) have been shown for granules containing tissue plasminogen activator in neurites of differentiated PC12 cells (38) and for vesicular trans-Golgi network-to-plasma membrane transport along microtubule tracks in PtK2 cells (~0.7 μm·s−1) (39).
Dendrites contain high concentrations of microtubules that, as well as acting as cytoskeletal and anchoring elements, have been implicated in the vesicle-mediated transport of ion channels. It has been reported recently that the infusion of monoclonal antibodies that inactivate the motor proteins dynein or kinesin substantially reduced AMPAR-mediated responses in hippocampal CA1 pyramidal cells (13). Similar levels of inhibition were observed with an actin inhibitor (phalloidin) or the peptide inhibitor, pep2m (16, 40), of the N-ethylmaleimidesensitive factor-GluR2 interaction. These inhibitors, alone or in combination reduced AMPAR-mediated transmission to ~30% of base-line level (13). Another study has shown that brefeldin A, fungal toxin that inhibits protein trafficking between the Golgi apparatus and cell membranes, decreased N-methyl-d-aspartate-induced potentiation and completely prevented any N-methyl-d-aspartate-induced increase in GluR1 levels in isolated membrane fractions (41).
Activity-independence of AMPAR Transport
Neither activation nor blockade of ionotropic receptors had any effect on the rates of fluorescence recovery of GFP-GluR1 or GFP-GluR2 in dendrites or spines. Furthermore, complete inhibition of synaptic transmission with a mixture of inhibitors failed to alter FRAP in dendritic spines or shafts. Therefore, because it is well established that synaptic AMPAR surface expression is highly controlled by activity, our results indicate that the stage in the secretory pathway in which regulation, at least over the ~ 30 min time course of our experiments, occurs is downstream of the long distance transport processes, most likely at exocytosis.
The addition of 200 μM glycine evokes a rapid (<2 min) increase in the surface expression of AMPARs and LTP (15). This glycine LTP induction protocol caused no change in either GFP-GluR1 or GFP-GluR2 FRAP, suggesting that acute changes in the number of surface-expressed AMPARs do not immediately alter the rates of new receptor delivery. This in turn suggests that the sufficient numbers of AMPARs are normally available by constitutive transport and/or local stores to accommodate physiological changes in the levels of surface expression.
In conclusion, here we report using rapid imaging techniques that homomeric assemblies of GluR1 or GluR2 have distinctly different transport and clustering properties in neurons but that trafficking of both is activity-independent. These results provide novel insight into the cellular mechanisms by which AMPARs are made available for synaptic and extrasynaptic surface expression.
Acknowledgments
We thank Prof. George Banting for helpful advice on FLIP and FRAP in the early stages of this project and Potikha Nikolay for advising us in the mathematical aspects of this paper.
Footnotes
This work was supported by European Commission Framework V, the Wellcome Trust, and the Medical Research Council. The costs of publication of this article were defrayed in part by the payment of page charges. This article must therefore be hereby marked “advertisement” in accordance with 18 U.S.C. Section 1734 solely to indicate this fact.
- AMPAR
- α-amino-3-hydroxy-5-methyl-4-isoxazole propionic acid receptor
- FRAP
- fluorescence recovery after photobleach
- FLIP
- fluorescence loss in photobleach
- GFP
- green fluorescent protein
- LTP
- long-term potentiation
- NBQX
- 2,3-dihydro-6-nitro-7-sulfamoylbenzo(f)quinoxaline.
REFERENCES
- 1.Bliss T, Collingridge G. Nature. 1993;361:31–39. doi: 10.1038/361031a0. [DOI] [PubMed] [Google Scholar]
- 2.Dingledine R, Borges K, Bowie D, Traynelis SF. Pharmacol. Rev. 1999;51:7–61. [PubMed] [Google Scholar]
- 3.Luscher C, Nicoll RA, Malenka RC, Muller D. Nat. Neurosci. 2000;3:545–550. doi: 10.1038/75714. [DOI] [PubMed] [Google Scholar]
- 4.Hall RA, Hansen A, Andersen PH, Soderling TR. Neuroscience. 1997;68:625–630. doi: 10.1046/j.1471-4159.1997.68020625.x. [DOI] [PubMed] [Google Scholar]
- 5.Archibald JM, Perry MJ, Molnar E, Henley JM. Neuropharmacology. 1998;37:1345–1353. doi: 10.1016/s0028-3908(98)00135-x. [DOI] [PubMed] [Google Scholar]
- 6.Baude A, Molnar E, Latawiec D, Mcilhinney RAJ, Somogyi P. J. Neurosci. 1994;14:2830–2843. doi: 10.1523/JNEUROSCI.14-05-02830.1994. [DOI] [PMC free article] [PubMed] [Google Scholar]
- 7.Richmond SA, Irving AJ, Molnar E, McIlhinney RA, Michelangeli F, Henley JM, Collingridge GL. Neuroscience. 1996;75:69–82. doi: 10.1016/0306-4522(96)00217-5. [DOI] [PubMed] [Google Scholar]
- 8.Huh KH, Wenthold RJ. Soc. Neurosci. Abstr. 1997;23:371–373. [Google Scholar]
- 9.Mammen AL, Huganir RL, O’Brien RJ. J. Neurosci. 1997;17:7351–7358. doi: 10.1523/JNEUROSCI.17-19-07351.1997. [DOI] [PMC free article] [PubMed] [Google Scholar]
- 10.Kirov SA, Sorra KE, Harris KM. J. Neurosci. 1999;19:2876–2886. doi: 10.1523/JNEUROSCI.19-08-02876.1999. [DOI] [PMC free article] [PubMed] [Google Scholar]
- 11.Matus A. Science. 2000;290:754–758. doi: 10.1126/science.290.5492.754. [DOI] [PubMed] [Google Scholar]
- 12.Shi S, Hayashi Y, Esteban JA, Malinow R. Cell. 2001;105:331–343. doi: 10.1016/s0092-8674(01)00321-x. [DOI] [PubMed] [Google Scholar]
- 13.Kim CH, Lisman JE. J. Neurosci. 2001;21:4188–4194. doi: 10.1523/JNEUROSCI.21-12-04188.2001. [DOI] [PMC free article] [PubMed] [Google Scholar]
- 14.Shi S, Hayashi Y, Petralia R, Zaman S, Wenthold R, K S, Malinow R. Science. 1999;284:1811–1816. doi: 10.1126/science.284.5421.1811. [DOI] [PubMed] [Google Scholar]
- 15.Lu W, Man H, Ju W, Trimble WS, MacDonald JF, Wang YT. Neuron. 2001;29:243–254. doi: 10.1016/s0896-6273(01)00194-5. [DOI] [PubMed] [Google Scholar]
- 16.Noel J, Ralph GS, Pickard L, Williams J, Molnar E, Uney JB, Collingridge GL, Henley JM. Neuron. 1999;23:365–376. doi: 10.1016/s0896-6273(00)80786-2. [DOI] [PubMed] [Google Scholar]
- 17.Sans N, Racca C, Petralia RS, Wang YX, McCallum J, Wenthold RJ. J. Neurosci. 2001;21:7506–7516. doi: 10.1523/JNEUROSCI.21-19-07506.2001. [DOI] [PMC free article] [PubMed] [Google Scholar]
- 18.Braithwaite SP, Meyer G, Henley JM. Neuropharmacology. 2000;39:919–930. doi: 10.1016/s0028-3908(99)00171-9. [DOI] [PubMed] [Google Scholar]
- 19.Frey U, Morris RGM. Nature. 1997;385:533–536. doi: 10.1038/385533a0. [DOI] [PubMed] [Google Scholar]
- 20.Hampson DR, Huang XP, Oberdorfer MD, Goh JW, Auyeung A, Wenthold RJ. Neuroscience. 1992;50:11–22. doi: 10.1016/0306-4522(92)90378-f. [DOI] [PubMed] [Google Scholar]
- 21.Martin LJ, Blackstone CD, Levey AI, Huganir RL, Price DL. Neuroscience. 1993;53:327–358. doi: 10.1016/0306-4522(93)90199-p. [DOI] [PubMed] [Google Scholar]
- 22.Pickard L, Noel J, Henley JM, Collingridge GL, Molnar E. J. Neurosci. 2000;20:7922–7931. doi: 10.1523/JNEUROSCI.20-21-07922.2000. [DOI] [PMC free article] [PubMed] [Google Scholar]
- 23.Craig AM, Blackstone CD, Huganir RL, Banker G. Neuron. 1993;10:1055–1068. doi: 10.1016/0896-6273(93)90054-u. [DOI] [PubMed] [Google Scholar]
- 24.Rao A, Kim E, Sheng M, Craig AM. J. Neurosci. 1998;18:1217–1229. doi: 10.1523/JNEUROSCI.18-04-01217.1998. [DOI] [PMC free article] [PubMed] [Google Scholar]
- 25.Baude A, Nusser Z, Molnar E, McIlhinney RAJ, Somogyi P. Neuroscience. 1995;69:1031–1055. doi: 10.1016/0306-4522(95)00350-r. [DOI] [PubMed] [Google Scholar]
- 26.Nusser Z, Lujan R, Laube G, Roberts JDB, Molnar E, Somogyi P. Neuron. 1998;21:545–559. doi: 10.1016/s0896-6273(00)80565-6. [DOI] [PubMed] [Google Scholar]
- 27.Petralia RS, Estaban JA, Wang X-Y, Partridge JG, Zhao H-M, Wenthold RJ, Malinow R. Nat. Neurosci. 1999;2:31–36. doi: 10.1038/4532. [DOI] [PubMed] [Google Scholar]
- 28.Takumi Y, Matsubara A, Rinvik E, Ottersen OP. Ann. N. Y. Acad. Sci. 1999;868:474–482. doi: 10.1111/j.1749-6632.1999.tb11316.x. [DOI] [PubMed] [Google Scholar]
- 29.Luthi A, Chittajallu R, Duprat F, Palmer MJ, Benke TA, Kidd FL, Henley JM, Isaac JT, Collingridge GL. Neuron. 1999;24:389–399. doi: 10.1016/s0896-6273(00)80852-1. [DOI] [PubMed] [Google Scholar]
- 30.Daw MI, Chittajallu R, Bortolotto ZA, Dev KK, Duprat F, Henley JM, Collingridge GL, Isaac JT. Neuron. 2000;28:873–886. doi: 10.1016/s0896-6273(00)00160-4. [DOI] [PubMed] [Google Scholar]
- 31.Perez JL, Khatri L, Chang C, Srivastava S, Osten P, Ziff EB. J. Neurosci. 2001;21:5417–5428. doi: 10.1523/JNEUROSCI.21-15-05417.2001. [DOI] [PMC free article] [PubMed] [Google Scholar]
- 32.Kim CH, Chung HJ, Lee HK, Huganir RL. Proc. Natl. Acad. Sci. U. S. A. 2001;98:11725–11730. doi: 10.1073/pnas.211132798. [DOI] [PMC free article] [PubMed] [Google Scholar]
- 33.Cottrell JR, Dube GR, Egles C, Liu G. J. Neurophysiol. 2000;84:1573–1587. doi: 10.1152/jn.2000.84.3.1573. [DOI] [PubMed] [Google Scholar]
- 34.Serge A, Fourgeaud L, Hemar A, Choquet D. J. Neurosci. 2002;22:3910–3920. doi: 10.1523/JNEUROSCI.22-10-03910.2002. [DOI] [PMC free article] [PubMed] [Google Scholar]
- 35.Kohrmann M, Haubensak W, Hemraj I, Kaether C, Lessmann VJ, Kiebler MA. J. Neurosci. Res. 1999;58:831–835. [PubMed] [Google Scholar]
- 36.Burack MA, Silverman MA, Banker G. Neuron. 2000;26:465–472. doi: 10.1016/s0896-6273(00)81178-2. [DOI] [PubMed] [Google Scholar]
- 37.Silverman MA, Kaech S, Jareb M, Burack MA, Vogt L, Sonderegger P, Banker G. Proc. Natl. Acad. Sci. U. S. A. 2001;98:7051–7057. doi: 10.1073/pnas.111146198. [DOI] [PMC free article] [PubMed] [Google Scholar]
- 38.Lochner JE, Kingma M, Kuhn S, Meliza CD, Cutler B, Scalettar BA. Mol. Biol. Cell. 1998;9:2463–2476. doi: 10.1091/mbc.9.9.2463. [DOI] [PMC free article] [PubMed] [Google Scholar]
- 39.Toomre D, Keller P, White J, Olivo JC, Simons K. J. Cell Sci. 1999;112:21–33. doi: 10.1242/jcs.112.1.21. [DOI] [PubMed] [Google Scholar]
- 40.Nishimune A, Isaac JTR, Molnar E, Noel J, Nash SR, Tagaya M, Collingridge GL, Nakanishi S, Henley JM. Neuron. 1998;21:87–97. doi: 10.1016/s0896-6273(00)80517-6. [DOI] [PubMed] [Google Scholar]
- 41.Broutman G, Baudry M. J. Neurosci. 2001;21:27–34. doi: 10.1523/JNEUROSCI.21-01-00027.2001. [DOI] [PMC free article] [PubMed] [Google Scholar]