

Abstract
Overweight or obese body habitus is associated with cognitive deficits, impaired brain function, gray matter atrophy, and white matter (WM) hyperintensities. However, few diffusion tensor imaging (DTI) studies have assessed WM integrity in relation to overweight or obese status. This study assessed relationships between body mass index (BMI) and values of DTI parameters among 51 normal weight (lean), overweight, and obese participants who were otherwise healthy. BMI correlated negatively with fractional anisotropy and axial eigenvalues (λ1) in the body of corpus callosum (CC), positively with mean diffusivity and radial eigenvalues (λ⟂) in the fornix and splenium of CC, and positively with λ1 in the right corona radiata (CR) and superior longitudinal fasciculus (SLF). These data indicate that BMI correlates negatively with WM integrity in the fornix and CC. Furthermore, the different patterns of BMI‐related differences in DTI parameters at the fornix, body, and splenium of the CC, and the right CR and SLF suggest that different biological processes may underlie BMI‐related impairments of WM integrity in different brain regions. Hum Brain Mapp, 2013. © 2011 Wiley Periodicals, Inc.
Keywords: DTI, obese, overweight, neuroimaging, BMI, brain structure
INTRODUCTION
Overweight or obese body habitus is associated with impaired cognitive function and dementia [Cournot et al., 2006; Fergenbaum et al., 2009; Fitzpatrick et al., 2009; Gunstad et al., 2010]. Relevant to their impaired cognition, overweight or obese research participants exhibit altered brain activation, different neurochemical profiles, reduced volumes of gray matter (GM), and white matter (WM) differences relative to lean participants [Debette et al., 2010; Gazdzinski et al., 2008, 2010; Gunstad et al., 2008; Gustafson et al., 2004b; Jagust et al., 2005; Raji et al., 2010; Taki et al., 2008; Volkow et al., 2011; Walther et al., 2010; Ward et al., 2005]. For example, older adult participants with WM lesions exhibited greater body mass indexes (BMIs) or waist‐hip ratios (WHRs) than those with few or no WM lesions [Anan et al., 2009; Gustafson et al., 2004a; Jagust et al., 2005]. Obese subjects showed greater WM volumes in the temporal lobes, fusiform and parahippocampal gyri, brainstem, and cerebellum relative to lean participants [Haltia et al., 2007]. The same subjects demonstrated partial recovery of WM volumes after dieting for 6 weeks with significant weight reduction [Haltia et al., 2007]. Women exhibited positive correlations between BMI and WM volumes in the frontal, temporal, parietal, and occipital lobes [Walther et al., 2010]. While the last two studies have found increased WM volumes in overweight or obese relative to lean participants, a recent study reported opposite findings. In this study, overweight or obese older adults exhibited smaller WM volumes in the frontal lobes, anterior cingulum, and corona radiata (CR) than did lean comparison participants [Raji et al., 2010]. Taken together, studies assessing the macrostructures of WM provide evidence that being overweight or obese is associated with WM lesions and volume differences, although the precise findings from studies differ.
Diffusion tensor imaging (DTI) has been used to assess integrity of WM microstructures as related to brain function and behavior in healthy participants and those with neuropsychiatric disorders [Agarwal et al., 2010; Sexton et al., 2009]. DTI extracts water diffusivity measures parallel and perpendicular to axons (e.g., axial eigenvalue and radial eigenvalue) by assessing water diffusion in multiple directions [Assaf and Pasternak, 2008]. It generates a fractional anisotropy (FA) value by calculating the normalized standard deviation of axial eigenvalue (λ1) and radial eigenvalue (λ⟂) to index the degree to which the water diffusion deviates from isotropic diffusion in the WM. It also generates a mean diffusivity (MD) value to index the overall diffusivity by averaging diffusivities in three directions [Assaf and Pasternak, 2008; Neil, 2008]. Both FA and MD are regularly used as indexes of WM integrity, and a decreased FA and/or an increased MD value in the WM is usually interpreted as reflecting poorer WM integrity [Alexander et al., 2007]. Based on the equations for calculating FA and MD, we can derive that FA correlates positively with the ratio of λ1 and λ⟂, while MD correlates positively with the sum of λ1 and λ⟂ (see Supporting Information). Therefore, FA and MD are sensitive to different patterns of changes in λ1 and λ⟂. For example, an increase in both λ1 and λ⟂ may significantly increase MD without significantly changing FA, and a decrease in λ1 along with an increase in λ⟂ may significantly decrease FA without significantly changing MD. Furthermore, it has been demonstrated that different neuropathological processes may influence different eigenvalues (i.e., λ1 vs. λ⟂). For example, axonal degeneration mainly associates with altered λ1 values [Concha et al., 2006; Sidaros et al., 2008], while demyelination mainly associates with increased λ⟂ values [Song et al., 2002]. Therefore, assessing changes in λ1 and λ⟂ along with FA and MD and analyzing the relationships among these changes can suggest potential pathophysiological processes underlying WM impairments [Bennett et al., 2010; Burzynska et al., 2010; Zhang et al., 2010].
Three recent DTI studies assessed the relationships between BMI and WM microstructural integrity. The first reported a negative correlation between BMI and FA in the right posterior cingulum of healthy older adults [Marks et al., in press]. The second demonstrated negative correlations between BMI and FA values in the fornix and corpus callosum (CC) of adults who were all healthy with the possible exception of being overweight or obese [Stanek et al., 2011]. The third observed negative correlations between BMI and λ1 in the CC of both male and female participants, and between BMI and FA in the CC of female participants alone [Mueller et al., 2011]. These studies provide initial evidence of negative relationships between overweight or obese body habitus and integrity of WM microstructures. WM mediates communications in the brain and is critical for the integrity of brain function. The knowledge of relationships between BMI and WM integrity will help us to understand how BMI affects the integrity of anatomical connections in the brain related to reward, cognition, and emotion. Considering that only a few DTI studies on BMI and WM integrity have been published, and that the findings from these limited studies are not fully consistent, further DTI studies on relationships between BMI and WM integrity are needed to clarify previous inconsistent findings and develop a biological model of WM integrity in obesity. The aim of this study was to assess the relationships between BMI and the DTI parameters FA, λ1, λ⟂, and MD in 51 participants using a voxel‐wise whole‐brain analysis approach. We predicted that values of BMI would correlate negatively with FA and positively with MD and λ⟂ in the CC, fornix, and cingulum, because previous studies have found negative correlations between BMI and FA in these brain regions [Marks et al., in press; Stanek et al., 2011].
Several recent DTI studies reported different patterns of aging‐related changes in DTI parameters in different brain regions [Bennett et al., 2010; Burzynska et al., 2010; Zhang et al., 2010]. These patterns included increases in both λ1 and λ⟂, increases in λ⟂ with concurrent decreases in λ1, increases in λ⟂ only, decreases in FA only, and simultaneous decreases in λ1 and MD. The different patterns were hypothesized to reflect different neuropathological processes underlying WM impairment [Bennett et al., 2010; Burzynska et al., 2010; Zhang et al., 2010]. Inspired by these studies, we also assessed correlations between BMI and four DTI parameters and expected that different brain regions would show different patterns of BMI‐related changes in DTI parameters.
METHODS
Participants
We acquired both DTI and BMI from 56 lean, overweight, or obese adults who were otherwise healthy. Individuals were recruited by media advertisements and provided written informed consent to participate in the protocol that was approved by the Yale Human Investigations Committee. Participants were screened using the Structured Clinical Interview (SCID) [First et al., 1996, 1997] and provided urine samples to assess recent use of cocaine, opioids, stimulants, marijuana, and benzodiazepines. Participants were excluded if any metabolites of these substances were positive in their urine samples. Handedness was assessed by asking participants which hand they usually used, and left‐handed individuals were excluded. Other exclusionary criteria included pregnancy, current psychiatric diagnoses, or unstable medical conditions, hypertension, and diabetes. No participants reported sleep apnea. Two postdoctoral associates, both with MRI training and experience and who were blind to the identity of DTI images, independently examined the quality of each image in the original space. Images from five participants were rated as poor quality due to excessive noise by both investigators and were excluded from further analysis. The final sample included 51 adults and their demographic information is presented in Table I. BMI was calculated using formula BMI = mass (lb) × 4.88/[height (ft)]2. The body weight and height were acquired via self‐report.
Table I.
Demographic information
| All participants (n = 51) | Participants with BMI < 25 (n = 22) | Participants with BMI ≥ 25 (n = 29) | P value | |
|---|---|---|---|---|
| BMI*, mean (SD) | 27.4 (5.3) | 23.0 (1.4) | 30.8 (4.7) | <0.001 |
| Age*: mean years (SD) | 29.6 (10.0) | 26.2 (9.1) | 32.1 (9.8) | 0.035 |
| Gender, female | 21 | 10 | 29 | 0.59 |
| Education, mean years (SD) | 15.0 (2.0) | 15.1 (2.0) | 14.9 (2.0) | 0.67 |
| Race: | 0.22 | |||
| Caucasian | 35 | 16 | 19 | |
| African American | 12 | 3 | 9 | |
| Native American | 2 | 1 | 1 | |
| Asian | 2 | 2 | 0 |
indicates significant differences (P < 0.05) between group of participants with BMI < 25 and group with BMI ≥ 25. Two sample t‐test was used to assess BMI, age, and education, while chi‐square test used for assessing gender and race.
Scanning Procedures
DTI data were acquired with a 3.0T Siemens Trio scanner at the Yale Magnetic Resonance Research Center. Diffusion sensitizing gradients were applied along 32 directions using b values of 1,000 s/mm2 (TR = 7,400, TE = 115, matrix = 128 × 128, FOV = 256 × 256 mm2). An additional image with b value of 0 (b 0 image) was acquired. Forty contiguous slices parallel to the AC–PC line were acquired, and each slice was 3.0‐mm thick [Xu et al., 2010]. Two repetitions were acquired for averaging. A high‐resolution T1 image was routinely acquired and examined by a neuroradiologist to identify any structural anomalies. Visual inspection of T1 images from all participants did not reveal any noticeable lesions in either white or GM.
Image Processing
The procedure for DTI processing was described recently [Xu et al., 2010]. FMRIB's Diffusion Toolbox (FDT 2.0) and Tract‐Based Spatial Statistics (TBSS 1.2) [Smith, 2004, 2006; Smith et al., 2007] from FMRIB's Software Library [FSL 4.1.4, Smith et al., 2004; Woolrich et al., 2009; http://www.fmrib.ox.ac.uk/fsl/] were used for image analyses. A set of mean images was created by aligning and averaging the two image sets from each subject and was used to construct the diffusion tensor using FDT. FDT typically generates maps of FA, axial (λ1), mean diffusivity (MD), lamda_2 (λ2), and lamda_3 (λ3). The map of the radial eigenvalue (λ⟂) was generated by averaging the maps of λ2 and λ3.
TBSS was used to register the FA map of each subject into Montreal Neurological Institute (MNI) template space. A mean FA map was created by averaging registered FA images from all subjects, and a mean FA skeleton was created by thinning the mean FA image and using 0.2 as FA threshold [Smith, 2004; Smith et al., 2006, 2007]. The aligned FA data of each participant were projected onto the mean skeleton by searching the area around the skeleton in the direction perpendicular to each tract, finding the highest local FA value, and assigning this value to the skeleton. The transformation matrices created for FA map registration were used to register λ1, λ⟂, and MD maps. Skeletons for λ1, λ⟂, and MD were created using the same procedures for creating the FA skeleton.
We performed voxel‐wise whole‐brain analyses for assessing the correlations between values of BMI and DTI parameters FA, λ1, λ⟂, and MD while using participants' gender and age as covariates. Image analyses were executed using the “randomise” program with 5,000 permutations. The “randomise” program uses permutation‐based, nonparametric inferences to perform voxel‐wise cross‐subject statistics [Nichols and Holmes., 2002]. Statistical thresholds for all image analyses were voxel‐level t > 2.0 and cluster P < 0.05, FWE‐corrected for multiple comparisons of the voxel‐wise whole‐brain analysis. JHU ICBM‐DTI‐81 White‐Matter Labels and JHU White‐Matter Tractography Atlas provided by FSLVIEW (3.1.2) were used to identify the anatomical location of significant clusters in the brain [Mori et al., 2008, 2009]. The function “fslmeants” from FSL was used to extract means of FA, λ1, λ⟂, and MD from each significant cluster surviving correction for multiple comparisons during whole‐brain analysis. These means were used in figures for demonstrating correlations between BMI and DTI parameters. Between‐group (obese/overweight versus normal weight) analyses were also performed (see Supporting Information). Forty‐seven participants performed a continuous performance task and they did not show significant correlations between task performance and values of any DTI parameters (see Supporting Information).
RESULTS
The clusters showing significant correlations between values of BMI and DTI parameters after controlling for age and gender are listed in Table II.
Table II.
Significant correlations between BMI and DTI parametersa
| L/R | Size | t‐valueb | MNI coordinates | |||
|---|---|---|---|---|---|---|
| Voxels | x | y | z | |||
| FA—negative | ||||||
| CC body | R | 431 | 3.7 | 10 | −8 | 29 |
| CC body | L | 383 | 4.6 | −16 | −3 | 35 |
| λ1—positive | ||||||
| CR & SLF | R | 479 | 4.4 | 34 | −17 | 36 |
| λ1—negative | ||||||
| CC Body | L | 355 | 5.0 | −11 | −4 | 30 |
| λ⟂—positive | ||||||
| CC Splenium, Posterior cingulum | R | 590 | 5.2 | 23 | −42 | 25 |
| CC Splenium, Posterior cingulum | L | 359 | 5.7 | −20 | −44 | 23 |
| Fornix | L/R | 327 | 4.8 | −7 | −21 | 13 |
| MD—positive | ||||||
| CC Splenium, Posterior cingulum | R | 636 | 5.4 | 23 | −42 | 25 |
| CC Splenium, Posterior cingulum | L | 574 | 6.6 | −20 | −44 | 23 |
| Fornix | L/R | 307 | 4.8 | −7 | −21 | 13 |
All clusters survived voxel level t > 2.0 and cluster P < 0.05, FWE‐corrected for multiple comparisons of voxel‐wise whole brain analysis.
t value of the peak voxel in each significant cluster.
Abbreviations: CC = corpus callosum; CR = corona radiata; L = left hemisphere; MNI = Montreal Neurological Institute; R = right hemisphere; SLF = superior longitudinal fasciculus.
FA Map
In the FA map, two clusters, each at left and right body of CC, correlated negatively with BMI (Fig. 1).
Figure 1.
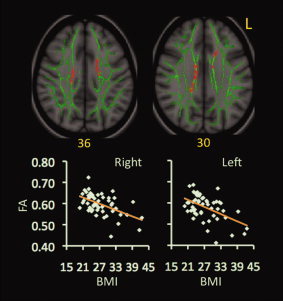
Correlations between BMI and FA values. Red‐yellow color on MNI T1 template indicates brain regions exhibiting significant correlations between BMI and FA values. Scatter‐plots demonstrate correlations between BMI values (x‐axis) and mean values of FA (y‐axis) within the indicated clusters. The green color shows the “group mean_FA_skeleton,” the number below each brain image indicates Z coordinates in MNI space, and only clusters surviving voxel level t > 2.0 and cluster P < 0.05, FWE‐corrected for multiple comparisons of voxel‐wise whole‐brain analysis are shown. Mean values of DTI parameters were calculated from all voxels in each significant cluster for each participant. Abbreviation: L = left.
λ1 Map
In the λ1 map, one cluster at the right CR and superior longitudinal fasciculus (SLF) correlated positively with BMI (Fig. 2). Another cluster at the left CC body correlated negatively with BMI (Fig. 2). This cluster overlapped extensively with the significant cluster at the left CC body in the FA map.
Figure 2.
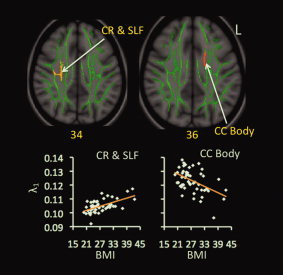
Correlations between BMI and λ1 values. Red‐yellow color on MNI T1 template indicates brain regions exhibiting significant correlations between BMI and λ1 values. The green color shows the “group mean_FA_skeleton,” the number below each brain image indicates Z coordinates in MNI space, and only clusters surviving voxel level t > 2.0 and cluster P < 0.05, FWE‐corrected for multiple comparisons of voxel‐wise whole‐brain analysis are shown. Scatter‐plots demonstrate correlations between BMI values (x‐axis) and mean values of λ1 (y‐axis) within each indicated cluster. Abbreviations: CC = corpus callosum; CR = corona radiata; L = left; SLF = superior longitudinal fasciculus.
λ⟂ Map
In the λ⟂ map, three clusters correlated positively with BMI. One involved the fornix, while the remaining two involved the right and left splenium of CC, respectively (Fig. 3).
Figure 3.
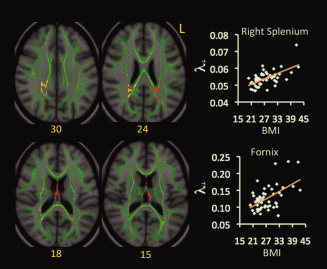
Correlations between BMI and λ⟂ values. Red‐yellow color on MNI T1 template indicates brain regions exhibiting significant correlations between BMI and λ⟂ values. The green color shows the “group mean_FA_skeleton,” the number below each brain image indicates Z coordinates in MNI space, and only clusters surviving voxel level t > 2.0 and cluster P < 0.05, FWE‐corrected for multiple comparisons of voxel‐wise whole‐brain analysis are shown. Scatter‐plots demonstrate correlations between BMI values (x‐axis) and mean values of λ⟂ (y‐axis) within each indicated cluster. Different ranges are used on the y‐axes of scatter plots given range differences in λ⟂ values for the fornix and splenium. Abbreviation: L = left.
MD Map
In the MD map, three clusters correlated positively with BMI. One involved the fornix. The remaining two involved the right and left splenium of CC, respectively (Fig. 4). These clusters overlapped with the significant clusters at corresponding locations in the λ⟂ map.
Figure 4.

Correlations between BMI and MD values. Red‐yellow color on MNI T1 template indicates brain regions exhibiting significant correlations between BMI and MD values. The green color shows the “group mean_FA_skeleton,” the number below each brain image indicates Z coordinates in MNI space, and only clusters surviving voxel level t > 2.0 and cluster P < 0.05, FWE‐corrected for multiple comparisons of voxel‐wise whole‐brain analysis are shown. Scatter‐plots demonstrate the correlations between BMI values (x‐axis) and mean values of MD (y‐axis) within each indicated cluster. Different ranges are used on the y‐axes of scatter plots given range differences in MD values for the fornix and splenium. Abbreviation: L = left.
DISCUSSION
The main aim of this study was to examine the relationships between BMI and WM integrity. The analyses indicate that BMI correlates: (1) negatively with FA and λ1 in the CC body, (2) positively with λ1 in the right CR and SLF, and (3) positively with MD and λ⟂ in the fornix and CC splenium. These data indicate that elevated BMI is associated with poorer WM integrity in the CC and fornix, and that different pathological processes may underlie this relationship in different brain regions. These findings support our a priori hypotheses, and their implications are discussed below.
Relationships Between BMI and DTI Parameters
Two recent studies reported negative correlations between BMI and WM integrity in the fornix and CC. One reported negative correlations between BMI and FA in the fornix and CC genu and splenium, and lower FA in the fornix and CC genu, body, and splenium among overweight or obese participants relative to lean ones [Stanek et al., 2011]. The other showed a negative correlation between BMI and λ1 in the entire CC [Mueller et al., 2011]. The present finding of negative correlations between BMI and FA and λ1 in the CC body and positive correlations between BMI and MD and λ⟂ in the fornix and splenium indicates that obesity associates with low WM integrity. This finding corroborates with previous findings regarding the relationships between BMI and WM integrity. However, the findings from the three studies are not fully consistent in specific DTI parameters showing significant correlations with BMI at specific WM locations. This difference could in part relate to different methods and participants used in these studies and should be addressed in future studies using larger sample size. Furthermore, the several participants (≈6) with the highest BMI values showed large variability in FA and λ1 values as compared with other participants (see scatter plots in Figs. 1 and 2). These data suggest that BMI may differentially relate to WM integrity in different individuals. This issue should be investigated in future studies with larger samples.
The fornix is the main output of the hippocampus, while the splenium consists of commissural fibers originating from the temporal and parietal cortices [Di Paola et al., 2010; Hofer and Frahm., 2006; Zarei et al., 2006]. Therefore, the present findings of negative correlations between BMI and WM integrity in the fornix and splenium complement previous observations of negative correlations between BMI or WHR and volumes of the hippocampus, temporal and parietal cortices [Gustafson et al., 2004a, b; Ho et al., 2010; Jagust et al., 2005; Pannacciulli et al., 2006; Raji et al., 2010; Taki et al., 2008]. In line with these current and previous data, spectroscopy studies have reported that BMI correlates negatively with concentrations of N‐acetylaspartate (NAA) in the frontal, temporal, and parietal WM, and of choline‐containing compounds (Cho) in the frontal WM. Lower NAA suggests lower axonal density in the WM, whereas lower Cho suggests altered axonal membrane and/or myelin [Gazdzinski et al., 2008, 2010]. Furthermore, preclinical studies found that relative to lean mice, obese mice showed less brain myelin and altered composition of myelin fatty acids [Sena et al., 1985], reduced density of dendritic spines in the hippocampus [Stranahan et al., 2008], and greater axonal degeneration after neurotoxin administration [Sriram et al., 2002]. While the exact mechanisms for why these WM factors associate with overweight/obese status are not clear at present, it has been reported that overweight/obesity is associated with brain inflammation which may be mediated by fat‐rich diets and increased blood levels of free fatty acids, leptin, and other chemicals associated with energy metabolism [Bruce‐Keller et al., 2009; Cazettes et al., 2011; Pistell et al., 2010]. Therefore, the currently observed BMI‐related WM findings could be due to overweight/obesity‐related loss of myelin and/or axons. Future studies concurrently obtaining DTI and other neuronal integrity measures are needed to better understand the nature of the observed BMI‐related WM findings.
Relationships Among BMI‐Related Differences in DTI Parameters
This study found four patterns of BMI‐related differences in DTI measures. The first pattern was exhibited in the WM at the fornix and splenium. These WM regions showed BMI‐related increases in both λ⟂ and MD, but no significant correlations between BMI and FA and λ1. This pattern of increased diffusivity has been observed during chronic stages following corpus callosotomy or tramautic brain injury [Concha et al., 2006; Sidaros et al., 2008] and was hypothesized to reflect increased extracellular space after the loss of axons and myelin [Bennett et al., 2010; Burzynska et al., 2010]. Such a hypothesis might be considered with respect to the smaller volumes of the hippocampus and parietal and temporal cortices reported in overweight and obese as compared with lean individuals [Gustafson et al., 2004a, b; Ho et al., 2010; Jagust et al., 2005; Pannacciulli et al., 2006; Raji et al., 2010; Taki et al., 2008]. That is, it is tempting to hypothesize that hippocampal or cortical atrophy may relate to WM tract integrity, and that linked changes in GM structures and the WM tract with which they communicate relate to the processes underlying being overweight or obese. This hypothesis is consistent with spectroscopy data indicating negative correlations between BMI and NAA in the temporal and parietal WM, with lower NAA suggesting lower axonal density in the WM. It is also consistent with the preclinical data of obese relative to lean mice showing more axonal degeneration after neurotoxin administration [Sriram et al., 2002]. This hypothesis could be tested by analyzing relationships between BMI‐related differences in WM and GM in future studies.
A second pattern was exhibited in the WM at the left CC body. This WM region showed BMI‐related decreases in both FA and λ1. This pattern of changes in DTI parameters was observed within days after stroke or corpus callosotomy [Pierpaoli et al., 2001; Song et al., 2003; Thomalla et al., 2004] and was hypothesized to reflect acute axonal degeneration [Bennett et al., 2010; Burzynska et al., 2010]. Therefore, this pattern suggests that elevated BMI might involve acute axonal degeneration in the CC body. This hypothesis is consistent with the previous findings of greater axonal degeneration in obese mice relative to lean mice after neurotoxin treatment [Sriram et al., 2002]. However, future studies are needed to examine this possibility.
The third pattern was exhibited by the cluster involving the right CC body. This cluster showed a BMI‐related decrease in FA, but not other DTI parameters. It has been suggested that reductions in FA alone might reflect mild microstructural changes including minor fiber loss without gross tissue changes [Burzynska et al., 2010]. The final pattern was exhibited in the cluster at the right CR and SLF. This cluster showed a BMI‐related increase in λ1, but no significant relationship to other DTI parameters. Increases in λ1 from its initial injury‐related decrease without concurrent changes in other DTI parameters was observed after traumatic brain injury (TBI) and was hypothesized to reflect axonal recovery, axonal regrowth, or reorganization of local WM microstructures, because the increase in λ1 in some brain regions positively correlated with cognitive function and clinical outcome of patients [Kinnunen et al., 2011; Sidaros et al., 2008]. Therefore, the current fourth pattern may indicate axonal reorganization in the right CR and SLF related to BMI status. This and other possibilities warrant direct examination, particularly in longitudinal studies.
LIMITATIONS
An important limitation of this study is that the BMI was calculated based on self‐reported body weight and height. Participants in other studies tended to over‐report height and under‐report weight [Gorber et al., 2007; Griebeler et al., 2011; Hill and Roberts., 1998]. Therefore, the BMI was probably higher than estimated for some participants. A second limitation is related to the ability to interpret current findings with respect to underlying biological processes. Factors other than axonal degeneration and demyelination can affect DTI eigenvalues, including directions and patterns of crossing fibers, local axon packing density, and glial infiltration [Bennett et al., 2010; Burzynska et al., 2010; Jbabdi et al., 2010; Wheeler‐Kingshott and Cercignani., 2009]. Therefore, the relationships between DTI eigenvalues and pathological processes should be further examined (e.g., in animal studies in which cellular examination is more feasible), particularly as DTI measures exhibit some interdependency. A third limitation is that the spatial resolution used in this study is not optimal for assessing the fornix. The fornix is a small structure and flanked by cerebral spinal fluid (CSF). Partial volume effects may contribute to the increases in λ⟂ and MD of the fornix. Using a voxel size smaller than the current size may reduce the partial volume effect on the fornix [Fujiwara et al., 2008]. A fourth limitation involves the lack of images sensitive to WM hyperintensity (such as high‐resolution T2 images), and this absence limits the ability to detect WM lesions at macroscopic levels. Finally, this study did not assess nutrition, physical activity, obesity history, aerobic fitness (e.g., VO2 max), and metabolic factors of participants. Lack of these data prevents us from analyzing the potential relationships between these factors and BMI and WM integrity. Therefore, these data should be acquired in future studies.
CONCLUSIONS
We used DTI to assess the relationships between BMI and WM integrity among 51 lean, overweight, or obese adults who were otherwise healthy. These participants showed negative correlations between BMI and WM integrity in the fornix, CC body and splenium, CR and SLF, as evidenced by negative correlations between BMI and FA and λ1 and positive correlations between BMI and MD and λ⟂. Furthermore, different WM locations exhibited different patterns of BMI‐related differences in DTI parameters, such as BMI‐related increases in both MD and λ⟂ in the fornix and CC splenium and decreases in both FA and λ1 in the left CC body. These different patterns of BMI‐related differences in DTI parameters suggest different biological processes may underlie the relationships between elevated BMI and WM integrity in different brain regions.
Abbreviations
- BMI
body mass index
- CC
corpus callosum
- CR
corona radiata
- DTI
diffusion tensor imaging
- FA
fractional anisotropy
- GM
gray matter
- MNI
Montreal Neurological Institute
- NAA
N‐acetylaspartate
- SLF
superior longitudinal fasciculus
- WHR
waist‐hip ratio
- WM
white matter
Supporting information
Additional Supporting Information may be found in the online version of this article.
Supporting Information
Dr. Potenza has consulted for and advised Boehringer Ingelheim; He has financial interests in Somaxon; He has received research support from the National Institutes of Health, Veteran's Administration, Mohegan Sun Casino, the National Center for Responsible Gaming, and its affiliated Institute for Research on Gambling Disorders, and Forest Laboratories and Psyadon pharmaceuticals; He has participated in surveys, mailings, or telephone consultations related to drug addiction, impulse control disorders or other health topics; He has consulted for law offices on issues related to addictions or impulse control disorders; He has provided clinical care in the Connecticut Department of Mental Health and Addiction Services Problem Gambling Services Program; He has performed grant reviews for the National Institutes of Health and other agencies; He has given academic lectures in grand rounds, CME events and other clinical or scientific venues; and has generated books or book chapters for publishers of mental health texts.
REFERENCES
- Alexander AL, Lee JE, Lazar M, Field AS ( 2007): Diffusion tensor imaging of the brain. Neurotherapeutics 4: 316–329. [DOI] [PMC free article] [PubMed] [Google Scholar]
- Anan F, Masaki T, Eto T, Iwao T, Shimomura T, Umeno Y, Eshima N, Saikawa T, Yoshimatsu H. ( 2009): Visceral fat accumulation is a significant risk factor for white matter lesions in Japanese type 2 diabetic patients. Eur J Clin Invest 39: 368–374. [DOI] [PubMed] [Google Scholar]
- Assaf Y, Pasternak O ( 2008): Diffusion tensor imaging (DTI)‐based white matter mapping in brain research: a review. J Mol Neurosci 34: 51–61. [DOI] [PubMed] [Google Scholar]
- Bennett IJ, Madden DJ, Vaidya CJ, Howard DV, Howard JH Jr ( 2010): Age‐related differences in multiple measures of white matter integrity: a diffusion tensor imaging study of healthy aging. Hum Brain Mapp 31: 378–390. [DOI] [PMC free article] [PubMed] [Google Scholar]
- Bruce‐Keller AJ, Keller JN, Morrison CD ( 2009): Obesity and vulnerability of the CNS. Biochim Biophys Acta 1792: 395–400. [DOI] [PMC free article] [PubMed] [Google Scholar]
- Burzynska AZ, Preuschhof C, Backman L, Nyberg L, Li SC, Lindenberger U, Heekeren HR. ( 2010): Age‐related differences in white matter microstructure: region‐specific patterns of diffusivity. NeuroImage 49: 2104–2112. [DOI] [PubMed] [Google Scholar]
- Cazettes F, Cohen JI, Yau PL, Talbot H, Convit A ( 2011): Obesity‐mediated inflammation may damage the brain circuit that regulates food intake. Brain Res 1373: 101–109. [DOI] [PMC free article] [PubMed] [Google Scholar]
- Concha L, Gross DW, Wheatley BM, Beaulieu C ( 2006): Diffusion tensor imaging of time‐dependent axonal and myelin degradation after corpus callosotomy in epilepsy patients. Neuroimage 32: 1090–1099. [DOI] [PubMed] [Google Scholar]
- Cournot M, Marquie JC, Ansiau D, Martinaud C, Fonds H, Ferrières J, Ruidavets JB. ( 2006): Relation between body mass index and cognitive function in healthy middle‐aged men and women. Neurology 67: 1208–1214. [DOI] [PubMed] [Google Scholar]
- Debette S, Beiser A, Hoffmann U, Decarli C, O'Donnell CJ, Massaro JM, Au R, Himali JJ, Wolf PA, Fox CS, Seshadri S. ( 2010): Visceral fat is associated with lower brain volume in healthy middle‐aged adults. Ann Neurol 68: 136–144. [DOI] [PMC free article] [PubMed] [Google Scholar]
- Di Paola M, Spalletta G, Caltagirone C ( 2010): In vivo structural neuroanatomy of corpus callosum in Alzheimer's disease and mild cognitive impairment using different MRI techniques: a review. J Alzheimers Dis 20: 67–95. [DOI] [PubMed] [Google Scholar]
- Fergenbaum JH, Bruce S, Lou W, Hanley AJ, Greenwood C, Young TK ( 2009): Obesity and lowered cognitive performance in a Canadian First Nations population. Obesity (Silver Spring) 17: 1957–1963. [DOI] [PubMed] [Google Scholar]
- First MB, Spitzer RL, Gibbon M, Williams J ( 1996): Structured Clinical Interview for DSM‐IV Axis I Disorders—Patient Edition (SCID‐IP, Version 2.0). New York, NY: Biometrics Research Department, New York State Psychiatric Institute. [Google Scholar]
- First MB, Gibbon M, Spitzer RL, Williams JBW, Benjamin LS ( 1997): Structured Clinical Interview for DSM‐IV Axis II Personality Disorders (SCID‐II): User's Guide. Washington, DC: American Psychiatric Press. [Google Scholar]
- Fitzpatrick AL, Kuller LH, Lopez OL, Diehr P, O'Meara ES, Longstreth WT Jr, Luchsinger JA. ( 2009): Midlife and late‐life obesity and the risk of dementia: cardiovascular health study. Arch Neurol 66: 336–342. [DOI] [PMC free article] [PubMed] [Google Scholar]
- Fujiwara S, Sasaki M, Kanbara Y, Inoue T, Hirooka R, Ogawa A ( 2008): Feasibility of 1.6‐mm isotropic voxel diffusion tensor tractography in depicting limbic fibers. Neuroradiology 50: 131–136. [DOI] [PubMed] [Google Scholar]
- Gazdzinski S, Kornak J, Weiner MW, Meyerhoff DJ ( 2008): Body mass index and magnetic resonance markers of brain integrity in adults. Ann Neurol 63: 652–657. [DOI] [PMC free article] [PubMed] [Google Scholar]
- Gazdzinski S, Durazzo TC, Mon A, Meyerhoff DJ ( 2010): Body mass index is associated with brain metabolite levels in alcohol dependence—a multimodal magnetic resonance study. Alcohol Clin Exp Res 34: 2089–2096. [DOI] [PMC free article] [PubMed] [Google Scholar]
- Gorber SC, Tremblay M, Moher D, Gorber B ( 2007): A comparison of direct vs. self‐report measures for assessing height, weight and body mass index: a systematic review. Obes Rev 8: 307–326. [DOI] [PubMed] [Google Scholar]
- Griebeler ML, Levis S, Beringer LM, Chacra W, Gomez‐Marin O ( 2011): Self‐reported versus measured height and weight in Hispanic and non‐Hispanic menopausal women. J Womens Health (Larchmt) 20: 599–604. [DOI] [PMC free article] [PubMed] [Google Scholar]
- Gunstad J, Lhotsky A, Wendell CR, Ferrucci L, Zonderman AB. 2010. Longitudinal examination of obesity and cognitive function: results from the Baltimore longitudinal study of aging. Neuroepidemiology 34: 222–229. [DOI] [PMC free article] [PubMed] [Google Scholar]
- Gunstad J, Paul RH, Cohen RA, Tate DF, Spitznagel MB, Grieve S, Gordon E. ( 2008): Relationship between body mass index and brain volume in healthy adults. Int J Neurosci 118: 1582–1593 [DOI] [PubMed] [Google Scholar]
- Gustafson D, Lissner L, Bengtsson C, Bjorkelund C, Skoog I ( 2004a) A 24‐year follow‐up of body mass index and cerebral atrophy. Neurology 63: 1876–1881. [DOI] [PubMed] [Google Scholar]
- Gustafson DR, Steen B, Skoog I ( 2004b) Body mass index and white matter lesions in elderly women. An 18‐year longitudinal study. Int Psychogeriatr 16: 327–336. [DOI] [PubMed] [Google Scholar]
- Haltia LT, Viljanen A, Parkkola R, Kemppainen N, Rinne JO, Nuutila P, Kaasinen V. ( 2007): Brain white matter expansion in human obesity and the recovering effect of dieting. J Clin Endocrinol Metab 92: 3278–3284. [DOI] [PubMed] [Google Scholar]
- Hill A, Roberts J ( 1998): Body mass index: a comparison between self‐reported and measured height and weight. J Public Health Med 20: 206–210. [DOI] [PubMed] [Google Scholar]
- Ho AJ, Raji CA, Becker JT, Lopez OL, Kuller LH, Hua X, Lee S, Hibar D, Dinov ID, Stein JL, Jack CR Jr, Weiner MW, Toga AW, Thompson PM; Cardiovascular Health Study; ADNI . ( 2010): Obesity is linked with lower brain volume in 700 AD and MCI patients. Neurobiol Aging 31: 1326–1339. [DOI] [PMC free article] [PubMed] [Google Scholar]
- Hofer S, Frahm J ( 2006): Topography of the human corpus callosum revisited—comprehensive fiber tractography using diffusion tensor magnetic resonance imaging. Neuroimage 32: 989–994. [DOI] [PubMed] [Google Scholar]
- Jagust W, Harvey D, Mungas D, Haan M ( 2005): Central obesity and the aging brain. Arch Neurol 62: 1545–1548. [DOI] [PubMed] [Google Scholar]
- Jbabdi S, Behrens TE, Smith SM ( 2010): Crossing fibres in tract‐based spatial statistics. Neuroimage 49: 249–256. [DOI] [PubMed] [Google Scholar]
- Kinnunen KM, Greenwood R, Powell JH, Leech R, Hawkins PC, Bonnelle V, Patel MC, Counsell SJ, Sharp DJ. ( 2011): White matter damage and cognitive impairment after traumatic brain injury. Brain 134: 449–463. [DOI] [PMC free article] [PubMed] [Google Scholar]
- Marks B, Katz L, Styner M, Smith J: Aerobic fitness and obesity: relationship to cerebral white matter integrity in the brain of active and sedentary older adults. Br J Sports Med (in press). [DOI] [PubMed] [Google Scholar]
- Mori S, Oishi K, Jiang H, Jiang L, Li X, Akhter K, Hua K, Faria AV, Mahmood A, Woods R, Toga AW, Pike GB, Neto PR, Evans A, Zhang J, Huang H, Miller MI, van Zijl P, Mazziotta J. ( 2008): Stereotaxic white matter atlas based on diffusion tensor imaging in an ICBM template. Neuroimage 40: 570–582. [DOI] [PMC free article] [PubMed] [Google Scholar]
- Mori S, Oishi K, Faria AV ( 2009): White matter atlases based on diffusion tensor imaging. Curr Opin Neurol 22: 362–369. [DOI] [PMC free article] [PubMed] [Google Scholar]
- Mueller K, Anwander A, Moller HE, Horstmann A, Lepsien J, Busse F, Mohammadi S, Schroeter ML, Stumvoll M, Villringer A, Pleger B. ( 2011): Sex‐dependent influences of obesity on cerebral white matter investigated by diffusion‐tensor imaging. PLoS One 6: e18544. [DOI] [PMC free article] [PubMed] [Google Scholar]
- Neil JJ ( 2008): Diffusion imaging concepts for clinicians. J Magn Reson Imaging 27: 1–7. [DOI] [PubMed] [Google Scholar]
- Nichols TE, Holmes AP ( 2002): Nonparametric permutation tests for functional neuroimaging: a primer with examples. Hum Brain Mapp 15: 1–25. [DOI] [PMC free article] [PubMed] [Google Scholar]
- Pannacciulli N, Del Parigi A, Chen K, Le DS, Reiman EM, Tataranni PA ( 2006): Brain abnormalities in human obesity: a voxel‐based morphometric study. Neuroimage 31: 1419–1425. [DOI] [PubMed] [Google Scholar]
- Pierpaoli C, Barnett A, Pajevic S, Chen R, Penix LR, Virta A, Basser P. ( 2001): Water diffusion changes in Wallerian degeneration and their dependence on white matter architecture. Neuroimage 13: 1174–1185 [DOI] [PubMed] [Google Scholar]
- Pistell PJ, Morrison CD, Gupta S, Knight AG, Keller JN, Ingram DK, Bruce‐Keller AJ. ( 2010): Cognitive impairment following high fat diet consumption is associated with brain inflammation. J Neuroimmunol 219: 25–32. [DOI] [PMC free article] [PubMed] [Google Scholar]
- Raji CA, Ho AJ, Parikshak NN, Becker JT, Lopez OL, Kuller LH, Hua X, Leow AD, Toga AW, Thompson PM. ( 2010): Brain structure and obesity. Hum Brain Mapp 31: 353–364. [DOI] [PMC free article] [PubMed] [Google Scholar]
- Sena A, Sarlieve LL, Rebel G ( 1985): Brain myelin of genetically obese mice. J Neurol Sci 68: 233–243. [DOI] [PubMed] [Google Scholar]
- Sidaros A, Engberg AW, Sidaros K, Liptrot MG, Herning M, Petersen P, Paulson OB, Jernigan TL, Rostrup E. ( 2008): Diffusion tensor imaging during recovery from severe traumatic brain injury and relation to clinical outcome: a longitudinal study. Brain 131: 559–572. [DOI] [PubMed] [Google Scholar]
- Smith SM ( 2004): Overview of fMRI analysis. Br J Radiol 77( Spec No 2): S167–S175. [DOI] [PubMed] [Google Scholar]
- Smith SM, Jenkinson M, Woolrich MW, Beckmann CF, Behrens TE, Johansen‐Berg H, Bannister PR, De Luca M, Drobnjak I, Flitney DE, Niazy RK, Saunders J, Vickers J, Zhang Y, De Stefano N, Brady JM, Matthews PM. ( 2004): Advances in functional and structural MR image analysis and implementation as FSL. Neuroimage 23( Suppl 1): S208–S219. [DOI] [PubMed] [Google Scholar]
- Smith SM, Jenkinson M, Johansen‐Berg H, Rueckert D, Nichols TE, Mackay CE, Watkins KE, Ciccarelli O, Cader MZ, Matthews PM, Behrens TE. ( 2006): Tract‐based spatial statistics: voxelwise analysis of multi‐subject diffusion data. NeuroImage 31: 1487–1505. [DOI] [PubMed] [Google Scholar]
- Smith S, Jenkinson M, Beckmann C, Miller K, Woolrich M ( 2007): Meaningful design and contrast estimability in FMRI. NeuroImage 34: 127–136. [DOI] [PubMed] [Google Scholar]
- Song SK, Sun SW, Ramsbottom MJ, Chang C, Russell J, Cross AH ( 2002): Dysmyelination revealed through MRI as increased radial (but unchanged axial) diffusion of water. NeuroImage 17: 1429–1436. [DOI] [PubMed] [Google Scholar]
- Song SK, Sun SW, Ju WK, Lin SJ, Cross AH, Neufeld AH ( 2003): Diffusion tensor imaging detects and differentiates axon and myelin degeneration in mouse optic nerve after retinal ischemia. NeuroImage 20: 1714–1722. [DOI] [PubMed] [Google Scholar]
- Sriram K, Benkovic SA, Miller DB, O'allaghan JP ( 2002): Obesity exacerbates chemically induced neurodegeneration. Neuroscience 115: 1335–1346. [DOI] [PubMed] [Google Scholar]
- Stanek KM, Grieve SM, Brickman AM, Korgaonkar MS, Paul RH, Cohen RA, Gunstad JJ. ( 2011): Obesity is associated with reduced white matter integrity in otherwise healthy adults. Obesity (Silver Spring) 19: 500–504. [DOI] [PubMed] [Google Scholar]
- Stranahan AM, Norman ED, Lee K, Cutler RG, Telljohann RS, Egan JM, Mattson MP. ( 2008): Diet‐induced insulin resistance impairs hippocampal synaptic plasticity and cognition in middle‐aged rats. Hippocampus 18: 1085–1088. [DOI] [PMC free article] [PubMed] [Google Scholar]
- Taki Y, Kinomura S, Sato K, Inoue K, Goto R, Okada K, Uchida S, Kawashima R, Fukuda H. ( 2008): Relationship between body mass index and gray matter volume in 1,428 healthy individuals. Obesity (Silver Spring) 16: 119–124. [DOI] [PubMed] [Google Scholar]
- Thomalla G, Glauche V, Koch MA, Beaulieu C, Weiller C, Rother J ( 2004): Diffusion tensor imaging detects early Wallerian degeneration of the pyramidal tract after ischemic stroke. Neuroimage 22: 1767–1774. [DOI] [PubMed] [Google Scholar]
- Volkow ND, Wang GJ, Baler RD ( 2011): Reward, dopamine and the control of food intake: implications for obesity. Trends Cogn Sci 15: 37–46. [DOI] [PMC free article] [PubMed] [Google Scholar]
- Walther K, Birdsill AC, Glisky EL, Ryan L ( 2010): Structural brain differences and cognitive functioning related to body mass index in older females. Hum Brain Mapp 31: 1052–1064. [DOI] [PMC free article] [PubMed] [Google Scholar]
- Ward MA, Carlsson CM, Trivedi MA, Sager MA, Johnson SC ( 2005): The effect of body mass index on global brain volume in middle‐aged adults: a cross sectional study. BMC Neurol 5: 23. [DOI] [PMC free article] [PubMed] [Google Scholar]
- Wheeler‐Kingshott CA, Cercignani M ( 2009): About “axial” and “radial” diffusivities. Magn Reson Med 61: 1255–1260. [DOI] [PubMed] [Google Scholar]
- Woolrich MW, Jbabdi S, Patenaude B, Chappell M, Makni S, Behrens T, Beckmann C, Jenkinson M, Smith SM. ( 2009): Bayesian analysis of neuroimaging data in FSL. NeuroImage 45: S173–S186. [DOI] [PubMed] [Google Scholar]
- Zarei M, Johansen‐Berg H, Smith S, Ciccarelli O, Thompson AJ, Matthews PM ( 2006): Functional anatomy of interhemispheric cortical connections in the human brain. J Anat 209: 311–320. [DOI] [PMC free article] [PubMed] [Google Scholar]
- Zhang Y, Du AT, Hayasaka S, Jahng GH, Hlavin J, Zhan W, Weiner MW, Schuff N. ( 2010): Patterns of age‐related water diffusion changes in human brain by concordance and discordance analysis. Neurobiol Aging 31: 1991–2001. [DOI] [PMC free article] [PubMed] [Google Scholar]
Associated Data
This section collects any data citations, data availability statements, or supplementary materials included in this article.
Supplementary Materials
Additional Supporting Information may be found in the online version of this article.
Supporting Information