Abstract
Amyloids are insoluble fibrous protein aggregates which, when abnormally accumulated in the body, can result in amyloidosis and various neurodegenerative diseases. In this work, we describe a new approach to the asymptotic solution of the master equation of amyloid fiber aggregations. It is found that four distinct and successive stages (lag phase, exponential growth phase, breaking phase and static phase) dominate the fiber formation process. Based on the distinctive power-law dependence of the half-time and apparent growth rate of the fiber formation on the initial protein concentration, we propose a novel classification for amyloid proteins theoretically.
Keywords: amyloid fiber, master equation, fiber aggregate, amyloidosis
INTRODUCTION
Abnormal accumulation of amyloid fiber in organs is closely associated with various neurodegenerative ailments, including Alzheimer's and Huntington's diseases.1–3 Uncovering the mechanism of amyloid fiber formation will provide an important step forward in identifying the onset of the amyloid-related diseases and in developing new antifibrotic treatments.4–5 Throughout the last decade, a number of processes have been experimentally identified in the amyloid fiber formation, including protein unfolding and refolding,6–8 on- and off-pathway competition,9 homo- or hetero-geneous nucleation,10–11 autocatalytic surface growth,12 elongation,13 merging,14 fragmentation,15–16 branching,17 and thickening14,18–19 etc. Despite extensive studies, a general mechanism to account for the various amyloid aggregation processes still remains to be elucidated.
Protein unfolding and refolding are prerequisite steps for amyloid fiber formation. Prior to fibrillation, the tertiary structure of amyloid proteins is either globular or intrinsically disordered with the secondary structure of the precursor proteins changing in the α-helix and β-sheet contents. After fibrillation, however, all protein fibrils share a unified morphology -- twisted and rope-like with a filamentous substructure where continuous β-sheets are formed with the β-strands running perpendicular to the vertical axis of the fibrils.20 The initial formation of a critical nucleus is believed to be a central step for the onset of amyloid fibrillation,21–25 but the actual function of the nucleation process is yet to be fully understood. One difficulty is the complex oligomers with different size formed simultaneously in the system which engenders serious difficulties in the identification of the critical nucleation events. In addition, the traditional monomer-concerned nature of the primary nucleation cannot provide a reasonable answer to current agitating studies, which have in fact highlighted the necessity of a fibril-dependent secondary nucleation.15–16 Fragmentation events may serve as a key process for monomer-independent secondary nucleation, helping to explain the exponential growth elements of the sigmoidal curve.26–29 Another crucial aspect in amyloid fiber formation is elongation, a process by which small oligomers or protofibrils grow into the characteristic long mature fibrils upon the linear addition of monomers to their terminal ends. The importance of other processes (including branching, merging, thickening etc.) may vary from protein to protein. For instance, glucagon fibrils have been observed branching continuously, while the fibril growth of Aβ(1–40) remains strictly linear.17
Another difficulty in the treatment of amyloid fibril diseases is the lack of a clear and complete physical description encompassing the entire process of amyloid fiber formation. Although some empirically defined characteristic stages have been proposed, such as the lag and exponential growth phases, there lacks of mathematical verifications supported by quantitative data. For example, what are the quantitative differences between different aggregation phases? Is there a general mechanism governing different processes? To answer these questions, a quantitative description and classification of the amyloid fibrillation process is demanded.
Knowles et al. recently presented a chemical master-equation based model, which involves three steps of amyloid fiber formation:30 primary nucleation, elongation and fragmentation. The modeling results were found in agreement with several aspects of experimental data, which partly validated the general assumptions regarding to the mechanisms of fibril formation. However, a qualitative explanation of the fibrillation process is not straightforward from the approximate solutions obtained via the fixed-point analysis by Knowles et al. Meanwhile, their solutions are not applicable to the static state.
In this work, we aim at presenting a complete and quantitative description for the formation of amyloid fibers. We first explore the Knowles et al. model through asymptotic analysis, an approximation method based on the mathematical analysis of partial differential equations within different time scales, which thereby provides a quantitative dissection of the kinetic process of amyloid fiber formation. Second, based on the analytical solutions of the half-time and apparent growth rate of fiber formation, in particular their distinctive power-law dependence on the initial soluble protein concentration, we propose a new classification of amyloid proteins.
MATERIALS AND METHODS
A. Basic Equations
We consider three fundamental processes of fibrous aggregations which can be expressed through following chemical reactions:
| (1) |
where B stands for a monomer and Bj for filaments with length j. We have assumed 1 ≤i<j, j≥nc, where nc ≥ 2 is the minimum size of filaments. Here for modeling facility, we have only included the forward reactions, but no corresponding backward reactions. Though this may be a reasonable approximation for the fiber growth phase, it will lead to some unrealistic predictions when we are dealing with a genuine thermodynamic equilibrium. Besides we have also assumed there is no preference position for fiber breakage, and the fiber breaking rate is independent of fiber length. Yet both experiments and theoretical analysis by Hill49 showed that filaments can be more easily broken in the middle; and short filaments are much harder to break than long ones. These limitations will be amended in our future studies.
If we define f(t, j) as the concentration of filaments in the system with length j at time t and m(t) as the concentration of monomers, we can use the master equations to describe the time evolution of f(t, j) in the processes of Eq. 1:30
| (2) |
The first term on the right side of above equation is related with fiber elongation; the second and third one with fiber fragmentation52; and the last one stands for the nucleation process. The summations of Eq. 2 will result in the evolution master equations of the total filament number and mass concentrations:
| (3) |
where is the total number of filaments in the system, is the mass concentration, kn, k+ and k− are the reaction rates for primary nucleation, elongation and fragmentation, respectively, as defined in Eq. 1. We also have m(t)=mtot−M(t) according to the mass conservation law, where mtot is the total protein concentration, given that the contributions from oligomers with size 1<n<nc are negligible.
B. Empirical Formula for Amyloid Fibrillation
Experimental values for the apparent fiber growth rate kapp and the half-time of fiber formation t1/2 are usually determined through the following empirical equation
| (4) |
which can best fit the measured time evolutionary curves for the ThT fluorescence intensity during amyloid fibrillation.31 Here, F(t) is the ThT fluorescence intensity at time t, F(0) is the background ThT fluorescence intensity at the starting time, and A is a constant.
C. Determination of Model Parameters
The unknown reaction rates of elongation, fragmentation and nucleation (k+, k−, kn) in Eq. 1) can be determined by
| (5) |
where the intermediate variables κ, α and σ are expected to be correlated with the half-time of fiber formation t1/2, the apparent fiber growth rate kapp and the equilibrium mass fraction of monomers χ through:
| (6) |
These relationships50 can be summarized into an automated procedure for the model parameter determination, i.e. (t1/2,kapp, χ) → (α,κ,σ) → (k+,k−,kn). As shown in Figure S2, the estimated model parameters by this procedure and the experimental data are highly correlated with a Pearson correlation coefficient ~0.95.
RESULTS
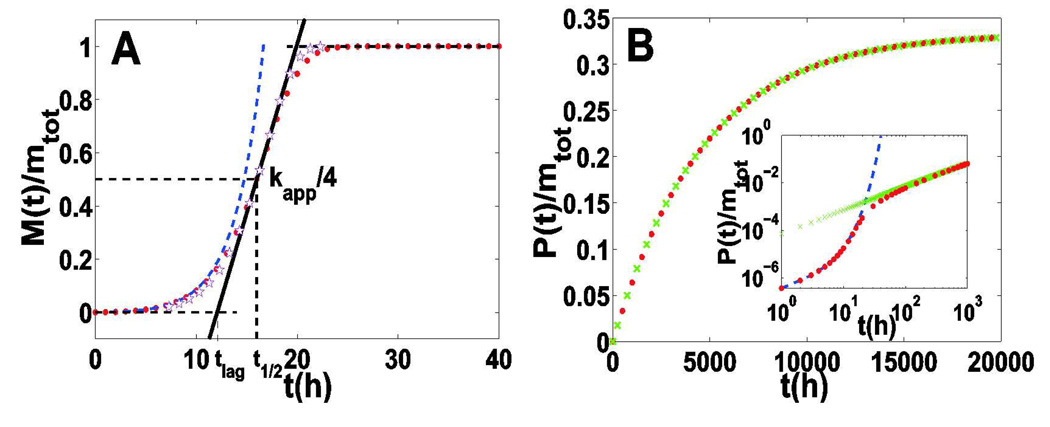
The typical evolutionary of P(t) and M(t) based on Eq. 3 is shown in Figure 1. We can identify three distinguishable phases from the sigmoidal curve of M(t) -- an initial lag phase (nucleation dominated), an intermediate stage with rapid increase (the exponential growth phase), followed by a final plateau phase. Compared to the time evolution of P(t), the plateau phase can be further subdivided into two different parts: the first with constant M(t) and increasing P(t) (the breaking phase), and the second with constant P(t) and M(t) (the final static phase). Therefore, the whole process of amyloid fiber formation can be formally divided into four successive stages: an initial lag phase, an exponential growth phase, a continuously breaking phase and a final static phase. Each stage is characterized by its particular time scale, along with the number and mass concentrations of filaments.
Figure 1.
Comparison of asymptotic solutions and numerical solutions of Eq. 3. The red dots represent the numerical solutions of Eq. 3; the dashed blue line represents asymptotic solutions for the nucleation phase obtained through Eq. 7; the pink stars show the asymptotic solution for the exponential growth phase obtained through Eq. 10; while the green crosses show the asymptotic solution for the breaking phase obtained through Eq. 12. Here we set nc=2, k+=5×10⁴M−1s−1, k−=2×10⁻⁸s−1, kn=2×10⁻⁵M−1s−1, mtot=5×10⁻⁶M.
In the following sections, we will further validate these four stages through detailed mathematical analysis. We will focus on the half-time and apparent growth rate of fiber formation, which have been widely used in the empirical interpretation of experimental data for amyloid fibrillation. The scaling relationships among the half-time of fiber formation, the apparent fiber growth rate, and the initial protein concentration are fully explored, which results in a tentative classification of amyloid proteins based on the differences in their dominant nucleation mechanisms.
A. Lag Phase
For the experiments on amyloid fiber formation without seeding, we can observe a long initial time period (referred as “lag-time”), in which most amyloid proteins remain in the soluble monomer form and very few oligomers or filaments can be detected.32 Within this lag-time, the combination process of multiple monomers into stable or unstable nuclei dominates. Since m(t) ≅ mtot, we can neglect the fragmentation terms involving P(t), and replace m(t) by mtot in Eq. 3, i.e.
| (7) |
which gives
| (8) |
where
| (9) |
From this solution, we can have Ṁ (0) ≈ 2mtotk+P(0) = 2mtotk+M (0) / L0 under the condition of “seeding” where L0 is the initial average length of filaments. This indicates that the initial growth rate of a seeded fibrillation reaction is proportional to the initial concentrations of soluble proteins and seeds.
B. Exponential Growth Phase
After certain accumulation of fiber nuclei , the mass concentration of filaments M(t) enters a phase of exponential growth. The major contribution to this rapid increase comes from two aspects: one is elongation, which quickly promotes short filaments into longer ones via monomer addition; another is fragmentation, which provides new seeds through the spontaneous breaking of long filaments into shorter ones. The former aspect provides a polynomial increase in the mass concentration of filaments, while the latter engenders the exponential growth.33 As the changes in the mass concentration of filaments M(t) is usually much faster than the number concentration of filaments P(t) in current stage (see Figure 1), we can adopt the method of variable separation, and assume that the slow variable P(t) still obeys the equation P(t) = σ[(κ + nck−)eκt − (κ − nck−)e−κt − 2nck−] /(4k+) obtained in the nucleation stage, while the fast variable M(t) satisfies
| (10) |
by only keeping the elongation term. The solution is given as M (t) = mtot {1 − exp[−σ(1 + nck− / κ)eκt / 2 − σ(1 − nck− / κ)e−κt / 2 + nck−σt + σ]}.
In the current study, two quantities are most interested: one is the half-time of fiber formation, which refers to the time point when mass concentration reaches 50% of the final value, i.e. M(t1/2)/M(∞)=50%. The other is the apparent fiber growth rate -- given by four times of the slope of sigmoid curve at the half-time normalized by initial protein concentration,32 i.e.
| (11) |
These equations can be further simplified as , which offers a direct theoretical basis for our later classification of amyloid proteins in Section E.
C. Breaking Phase
Following the exponential growth phase, the mass concentration of filaments reaches almost constant with M(t)≈mtot[1−1/(2α)], where α=k+mtot/[k−nc(nc−1)]. The number concentration of filaments increases until P(t)≈M(t)/(2nc−1). As a result, the average length of filaments M(t)/P(t) decreases continuously from the maximum value κ/k− in the exponential growth phase to the final value 2nc−1. The governing equation for the number concentration of filaments in this stage can be approximated as
| (12) |
which gives P(t) = mtot[1 − 1/(2α)][1 − e−(2nc−1)k−t] /(2nc −1) (see Figure 1). In fact, this equation is consistent with the numerical solution of P(t) in nearly the whole time range.
From Eq. 12, the time scale of the breaking phase is given by tb≈ 1 /[(2nc −1)k−], which is usually much larger than the half-time of fiber formation. For instance, the parameters that best fit the kinetic curve of WW domain fibrillation34 at the initial concentration mtot=50µM, are estimated to be nc=2, k+=1.94×10⁴M−1s−1, k−=9.7×10⁻⁹s−1, kn=1.2×10⁻⁷M−1s−1. We obtained t1/2≈15.1 hours and tb≈1.1 years, showing that the time scale of breaking phase is six hundred times longer than the half-time of fiber formation. Although there are still lots of controversies, we guess such a large time scale for the fiber breaking phase may correlate with the long latent period of amyloid-related diseases. It has been suggested by many experimental studies that small oligomers and protofilaments are more toxic to cells than larger mature filaments.16,34 Due to the influence of fiber breaking process, more small oligomers will bring increasing damage to cells, which eventually leads to clinically observed symptoms.2–3
D. Static Phase
Finally, the system will reach a static state with constant values of P(t) and M(t). Letting t→∞, the asymptotic behaviors of Eq. 3 become
| (13) |
where m(∞) and P(∞) indicate the static values of m(t) and P(t) when t → ∞.
If we define χ = m(∞) / mtot as the static mass fraction of monomers in the system, Eq. 13 can be written as a closed algebraic function of χ, i.e.
| (14) |
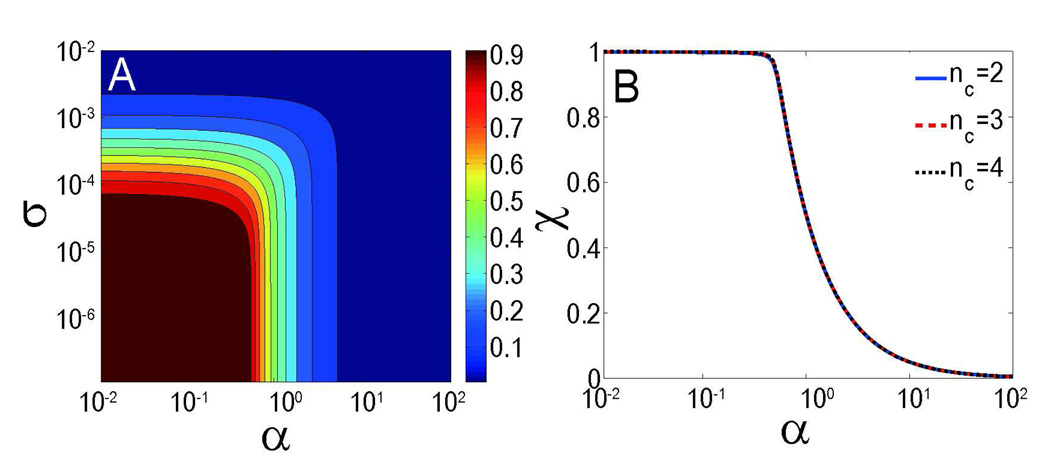
The typical dependence of the static mass fraction of monomers χ on parameters α and σ is illustrated in Figure 2A, with nc=2. For larger values of nc, the basic pattern of the contour plot of χ does not change, except for a barely perceptible shift towards a larger value of nc. Although Eq. 14 involves three parameters (α, σ, nc), we demonstrate that χ depends mainly on α for physiologically relevant parameters, provided that σ≪1. In the mathematical limit of nc≫2, the first two terms of Eq. 14 can be neglected (since χ<1), leading to a simple solution χ=min[1/(2α), 1]. Therefore the static mass fraction of monomers does not depend on σ and nc in this limit. Our detailed numerical calculations further verify that this independence persists in the whole range of nc, provided σ≪1 (see Figure 2B).
Figure 2.
(A) Contour plot of the static mass fraction of monomers χ as a function of parameters α and σ with nc=2. (B) Dependence of the static mass fraction of monomers χ on parameter α. All of the curves with various nucleus size nc converge into the same line.
From Eq. 13, we can also obtain the static number concentration of filaments as P(∞)=mtot(1-χ)/[nc+(nc−1)2αχ]≈mtot(1-χ)/(2nc−1), and the static average size of filaments as M(∞)/P(∞)≈2nc−1.
Thus, given the initial soluble protein concentration mtot and critical nucleus size nc, the static number and mass concentrations of filaments would mainly depend on the fiber elongation rate k+ and the fragmentation rate k− through a simple dimensionless form α=k+mtot/[k−nc(nc−1)]. This means the final static state has no apparent dependence on the nucleation process (except for the critical nucleus size nc), which coincides with the general intuition about the thermodynamic systems.35
It must be noted that the static average size of filaments (2nc−1) predicted above is inconsistent with general experimental results, in which much longer filaments and fibrils can be observed stable for days and even months. This discrepancy we believe is mainly caused by the unrealistic assumption on the fragmentation process in current model, where we suppose the fibrils can break at any positions with equal probability and short fibrils can still break with significant probability. Yet both experiments and theoretical analysis49 show that filaments can be more easily broken in the middle; and short filaments are much harder to break than long ones. Therefore further efforts are needed before the model can be applied to describe the end-stage of fibrillation.
In summary, the above outlined four successive phases (i.e. the initial lag phase, an exponential growth phase, a continuously breaking phase and the final static phase) provide a complete description of the formation of amyloid fiber. The former two stages have been studied extensively over the course of the past decade, while far less attention has been paid to the latter two. However, as we have noted here, the breaking phase may play a key role in the nosogenesis and aggravation of many amyloid-related diseases.
E. Classification of Amyloid Proteins
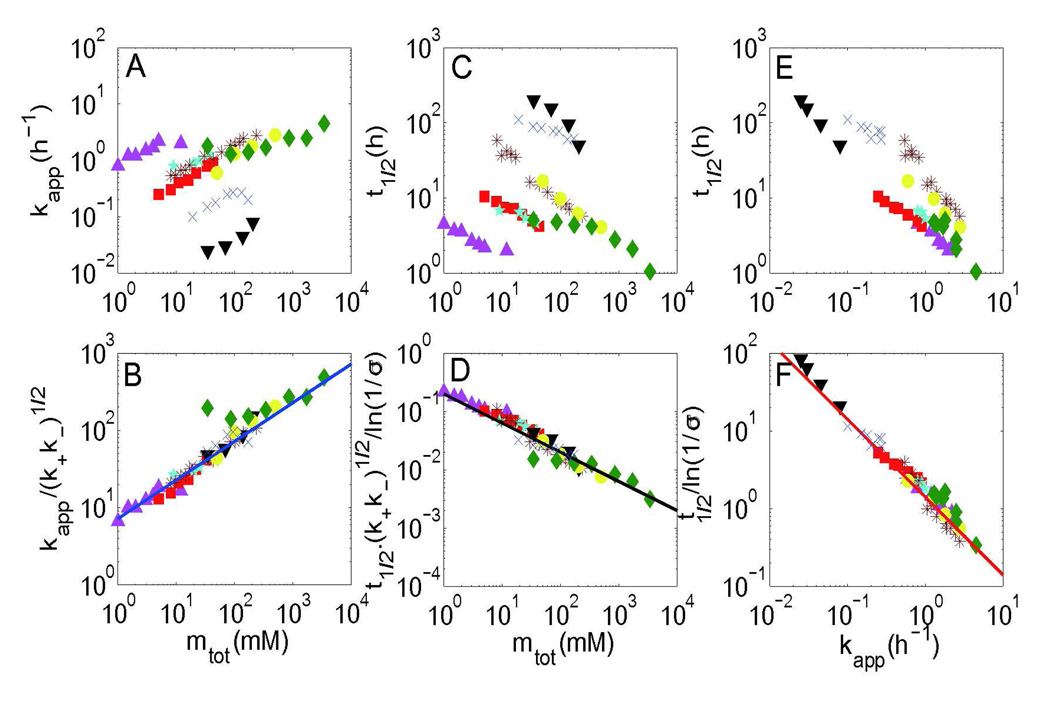
From the analysis of the exponential growth phase (Eq. 11), we can obtain a power-law dependence for the half-time and apparent growth rate of fiber formation on the initial protein concentration, i.e. . When the secondary nucleation is much stronger than the primary nucleation (σ≪1), we have μ=ν=1/2 (see Eq. 11). Such weak dependencies have been observed in many amyloid proteins, including the yeast prion Sup35 NW region,13 WW domain,36 Csg Btrunc,37 Ure2 protein,38 β2-microglobulin,39 stefin B,40 α-synucleins31 and insulin,41 as demonstrated in Figure 351. If we compare the equations for the apparent growth rate and half-time of fiber formation, an inverse relationship will be obtained (Figures 3E and 3F), which has been experimentally verified in many amyloid proteins regardless of the pH, temperature and denaturant conditions.42 Similar results could also be obtained for the lag-time.
Figure 3.
Scaling relationships between kapp, t1/2 and mtot for different kinds of amyloid proteins, whose scaling exponent does not depend on the critical nucleus size. Original data and corrected data by considering the factors predicted by the model are shown separately. (A) and (B) show the relationship between the apparent fiber growth rate kapp and initial protein concentration mtot before and after correction; (C) and (D) show the relationship between half-time of fiber formation t1/2 and initial protein concentration mtot before and after correction; (E) and (F) show the inverse relationship between the apparent fiber growth rate kapp and the half-time of fiber formation t1/2 before and after correction. Here the data is obtained from eight different amyloid proteins, i.e. the yeast prion Sup35 NW region (purple triangles up), Csg Btrunc (red squares), Ure2 protein (cyan pentacles), β2-microglobulin (brown stars), stefin B (blue cross), α-synucleins (black triangles down), WW domain (yellow circles), and insulin (green diamonds). The blue fitting line is given by y=7.2x1/2; the black line is y=0.2x−1/2; and the red line is .
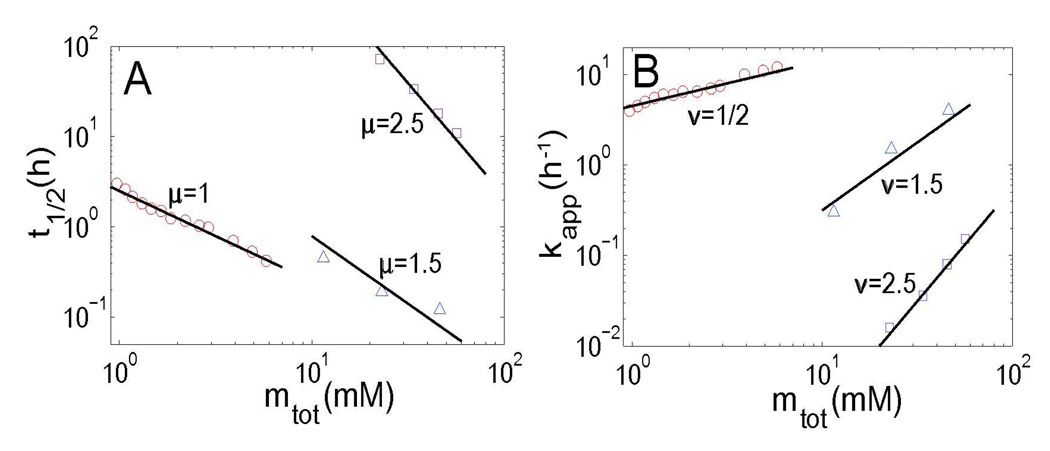
However, we note that the scaling exponents μ and ν may show large deviations from 1/2 for certain amyloid proteins. As shown in Figure 4, μ=ν=1.5 for γC-crystallin,44 and μ=ν=2.5 for Apo C-II.45 In fact, these values correspond to another limit case of our model at σ≫1, in which fragmentation is not as effective as the primary nucleation in providing seeds. Thus we have μ=ν=nc/2, both depending on the size of critical nucleus.
Figure 4.
Scaling relationships between t1/2, kapp and mtot are shown for three amyloid proteins, whose scaling exponent depends on the critical nucleus size. (A) shows the relationship between the half-time of fiber formation t1/2 and initial protein concentration mtot; (B) shows the relationship between the apparent fiber growth rate kapp and initial protein concentration mtot. Here the data is collected for Aβ(M1–42) (red circles), γC-crystallin (blue triangles), and Apo C-II (purple rectangles). The slope of each fitting curve is noted by the plot separately.
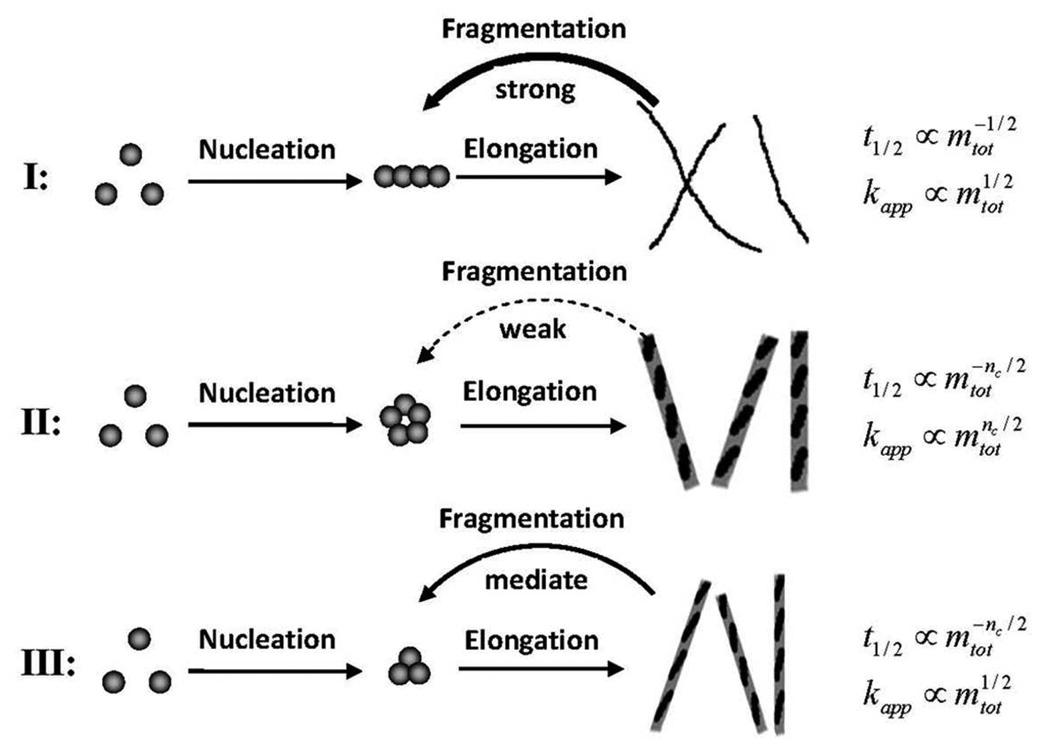
As a result, it is natural to classify amyloid proteins into different groups based on the dimensionless parameter σ, which characterizes the effectiveness of primary nucleation against monomer-independent secondary nucleation (fragmentation) during the fibrillation process. More specifically, Type-I with σ≪1 corresponds to the case where protofilaments and mature filaments are both easily broken, so that fragmentation plays a key role in providing fiber seeds in the whole process. Most amyloid proteins in our study belong to this group. We have μ=ν=1/2 which are independent of the critical nucleus size.
Type II with σ≫1 corresponds to the case where protofilaments and mature filaments are hard to break, and therefore primary nucleation dominates the process of fiber formation. Under this situation, we have μ=ν=nc/2 which depend on the critical nucleus size, e.g. γC-crystallin and Apo C-II.
Type-III with σ~1 corresponds to the case when primary nucleation dominates the initial process, and fragmentation becomes more important in later stages as filaments get easier to break upon elongation. Thus it is an intermediate type between Type I and II, with μ≈nc/2 and ν≈1/2 (e.g. Aβ(M1–42), μ=1, ν=1/2 obtained from the numerical fitting of experimental data in Ref.46).
In fact, Types I and II of amyloid proteins follow the Oosawa theory35 and the monomer-independent secondary nucleation models developed by Ferrone,47 Miranker,48 Dobson30 and others, while Type III is new. A summary of above classifications is illustrated in Figure 5.
Figure 5.
Illustration of the classification of amyloid proteins based on their different dominant nucleation mechanisms.
It should be noted that in nature high powers of the scaling exponents may not necessarily correspond to the systems that are dominated by primary nucleation. As shown in the case of sickle hemoglobin polymerization,47–48 such high exponents can also originate from monomer-dependent secondary nucleation, which has not been considered in our model. How to quantitatively distinguish these two types of nucleation mechanisms is still an interesting open problem.
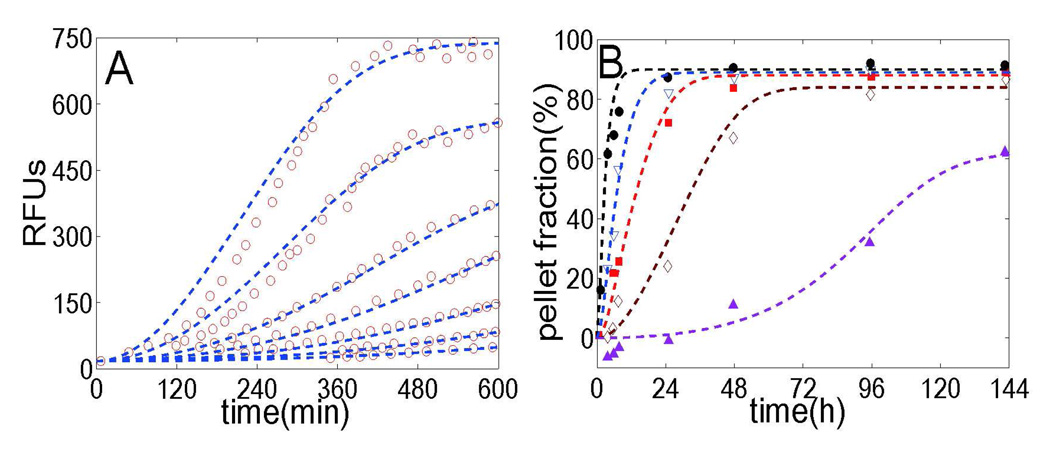
To provide further validation of our model, we take a look at the fibrillation processes of two types of amyloid proteins, Csg Btrunc37 and Apo C-II.45 It can be seen that, with fixed values of model parameters k+, k−, kn and nc, the predicted kinetic curves provide an excellent agreement with the experimental data at low initial protein concentrations. At higher concentrations there is a small difference due to the modest influence of initial protein concentration on model parameters. Therefore we believe that the master equation of Eq. 3 correctly reflects the fundamental kinetic behaviors of amyloid fiber formation, in spite of the disparate governing nucleation mechanisms for different types of amyloid proteins.
SUMMARY AND DISCUSSION
Based on the asymptotic analysis of the master equation, we found that the kinetic process of amyloid fiber formation can be generally divided into four successive stages: lag phase, exponential growth phase, breaking phase and a final static phase. Each stage is characterized by its distinct time scale, the number and mass concentrations of filaments etc. We also emphasized the power-law dependence of the half-time and apparent growth rate of fiber formation on the initial protein concentration, which eventually leads to a tentative classification of amyloid proteins according to their different dominant nucleation mechanisms. We hope that detailed experiments can be conducted to validate the model, in particular the proposed classification of amyloid proteins and their corresponding fibrillation mechanisms in the future.
It was shown that primary nucleation, elongation and fragmentation can be interpreted as the fundamental steps in amyloid fiber formation. However, this does not necessarily mean that other processes lack significance. As we pointed out, protein structure unfolding and refolding (or structure conversion) usually exists as a prerequisite step in the formation of amyloid fibrils. The importance of branching, merging and thickening may vary from case to case. How to take these effects into consideration in our model frame remains to be elucidated. In the supporting materials, we tried to give a possible way to add the processes of protein structure conversion into the model.
Another issue concerns the appropriate determination of model parameters, since in reality the kinetic process of amyloid fiber formation is sensitive to protein sequence, temperature, solvent pH, denaturant concentration and etc. The explicit correlation between fibrillation conditions and model parameters will largely determine the ability of current model in interpreting experimental data and making new predictions. From numerical studies on the kinetic polymerization curves of different amyloid proteins, we found that for secondary nucleation dominated proteins (σ≪1), nc=2 seems work well, probably dues to the insensitivity of secondary nucleation on the critical nucleus size. For primary nucleation dominated proteins (σ≫1), a larger value of nc (usually 5–6) is needed for the correct fitting (see Figures 4 and 6B). In the methodology part, an empirical method for the determination of (k+, k−, kn) based on the time evolutionary curves of amyloid fibrillation is introduced. However, a final solution to this problem requires a detailed microscopic theory, which should take into account the explicit or empirical chemical information regarding to the fibrillation conditions.
Figure 6.
Data analysis for the fibrillation of two different kinds of amyloid proteins: Csg Btrunc and apo C-II. (A) The red circles represent the measured fluorescence intensity of Csg Btrunc at concentrations of 43µM, 33µM, 22µM, 16µM, 11µM, 8µM and 5µM (from top to bottom) which was mixed with the amyloid-specific dye thioflavin T. We note that none of the pellet fractions reach 100% probably due to the way of normalization. Our fits (blue dashed lines) are calculated using Eq. 3 with parameters k+=1×10⁴M−1s−1, k−=2×10⁻⁸s−1, kn=1.8×10⁻⁴M−1s−1 and nc=2. (B) Symbols correspond to the experimental data monitored by a pelleting assay with apo C-II at protein concentrations of 0.15mg/mL (purple triangles up), 0.3mg/mL (brown diamonds), 0.45mg/mL (red squares), 0.6 mg/mL (blue triangles down) and 0.9mg/mL (black circles). Our fits (dashed lines) are obtained with parameters k+=5×10³M−1s−1, k−=1×10⁻⁹s−1, kn=3×10⁸M−1s−1 and critical nucleus nc=5.
Supplementary Material
ACKNOWLEDGMENTS
The authors thank Dr. John Grime for reading the manuscript and valuable suggestions. The project is supported in part by Tsinghua University Initiative Scientific Research Program (20101081751), the Alfred P. Sloan Foundation, NSF Career Award (DBI 0746198), and the National Institute of General Medical Sciences (GM083107 and GM084222).
Footnotes
SUPPORTING INFORMATION
Model inclusion of protein structure conversion and comparison of the estimated model parameters with the experimental data. This material is available free of charge via the Internet at http://pubs.acs.org.
REFERENCE
- 1.Merlini G, Bellotti VN. Engl. J. Med. 2003;349(6):583–596. doi: 10.1056/NEJMra023144. [DOI] [PubMed] [Google Scholar]
- 2.Chiti F, Dobson CM. Annu. Rev. Biochem. 2006;75:333–366. doi: 10.1146/annurev.biochem.75.101304.123901. [DOI] [PubMed] [Google Scholar]
- 3.Harrison RS, Sharpe PC, Singh Y, Fairlie DP. Rev. Physiol. Biochem. Pharmacol. 2007;159:1–77. doi: 10.1007/112_2007_0701. [DOI] [PubMed] [Google Scholar]
- 4.Feng BY, Toyama BH, Wille H, Colby DW, Collins SR, May BC, Prusiner SB, Weissman J, Shoichet BK. Nat. Chem. Biol. 2008;4(3):197–199. doi: 10.1038/nchembio.65. [DOI] [PMC free article] [PubMed] [Google Scholar]
- 5.Roberts BE, Shorter J. Nat. Struct. Mol. Biol. 2008;15(6):544–546. doi: 10.1038/nsmb0608-544. [DOI] [PubMed] [Google Scholar]
- 6.Frieden C. Prot. Sci. 2007;16(11):2334–2344. doi: 10.1110/ps.073164107. [DOI] [PMC free article] [PubMed] [Google Scholar]
- 7.Serio TR, Cashikar AG, Kowal AS, Sawicki GJ, Moslehi JJ, Serpell L, Arnsdorf MF, Lindquist SL. Science. 2000;289(5483):1317–1321. doi: 10.1126/science.289.5483.1317. [DOI] [PubMed] [Google Scholar]
- 8.van der Linden E, Venema P. Curr. Opin. Coll. Interface Sci. 2007;12:158–165. [Google Scholar]
- 9.Powers ET, Powers DL. Biophys. J. 2008;94(2):379–391. doi: 10.1529/biophysj.107.117168. [DOI] [PMC free article] [PubMed] [Google Scholar]
- 10.Lomakin A, Chung DS, Benedek GB, Kirschner DA, Teplow DB. Proc. Natl. Acad. Sci. USA. 1996;93(3):1125–1129. doi: 10.1073/pnas.93.3.1125. [DOI] [PMC free article] [PubMed] [Google Scholar]
- 11.Hills RD, Brooks CL. J. Mol. Biol. 2007;368(3):894–901. doi: 10.1016/j.jmb.2007.02.043. [DOI] [PMC free article] [PubMed] [Google Scholar]
- 12.Morris AM, Watzky MA, Agar JN, Finke RGF. Biochemistry. 2008;47(8):2413–2427. doi: 10.1021/bi701899y. [DOI] [PubMed] [Google Scholar]
- 13.Collins SR, Douglass A, Vale RD, Weissman JS. Plos Biol. 2004;2(10):1582–1590. doi: 10.1371/journal.pbio.0020321. [DOI] [PMC free article] [PubMed] [Google Scholar]
- 14.Pallitto MM, Murphy RM. Biophys, J. 2001;81(3):1805–1822. doi: 10.1016/S0006-3495(01)75831-6. [DOI] [PMC free article] [PubMed] [Google Scholar]
- 15.Hill EK, Krebs B, Goodall DG, Howlett GJ, Dunstan DE. Biomacromolecules. 2006;7(1):10–13. doi: 10.1021/bm0505078. [DOI] [PubMed] [Google Scholar]
- 16.Xue WF, Hellewell AL, Gosal WS, Homans SW, Hewitt EW, Radford SE. J, Biol, Chem. 2009;284(49):34272–34282. doi: 10.1074/jbc.M109.049809. [DOI] [PMC free article] [PubMed] [Google Scholar]
- 17.Andersen CB, Yagi H, Manno M, Martorana V, Ban T, Christiansen G, Otzen DE, Goto Y, Rischel C. Biophys, J. 2009;96(4):1529–1536. doi: 10.1016/j.bpj.2008.11.024. [DOI] [PMC free article] [PubMed] [Google Scholar]
- 18.van Gestel J, de Leeuw SW. Biophys. J. 2006;90(9):3134–3145. doi: 10.1529/biophysj.105.076000. [DOI] [PMC free article] [PubMed] [Google Scholar]
- 19.Manno M, Craparo EF, Podesta A, Bulone D, Carrotta R, Martorana V, Tiana G, San Biagio PL. J. Mol. Biol. 2007;366(1):258–274. doi: 10.1016/j.jmb.2006.11.008. [DOI] [PubMed] [Google Scholar]
- 20.Sunde M, Blake CCF. Quar. Rev. Biophys. 1998;31(1):1. doi: 10.1017/s0033583598003400. + [DOI] [PubMed] [Google Scholar]
- 21.Lomakin A, Teplow DB, Kirschner DA, Benedek GB. Proc. Natl. Acad. Sci. U S A. 1997;94(15):7942–7947. doi: 10.1073/pnas.94.15.7942. [DOI] [PMC free article] [PubMed] [Google Scholar]
- 22.Arnaudov LN, de Vries R. J. Chem. Phys. 2007;126(14):145106. doi: 10.1063/1.2717159. [DOI] [PubMed] [Google Scholar]
- 23.Wetzel R. Acc. Chem. Res. 2006;39(9):671–679. doi: 10.1021/ar050069h. [DOI] [PubMed] [Google Scholar]
- 24.Padrick SB, Miranker AD. Biochemistry. 2002;41(14):4694–4703. doi: 10.1021/bi0160462. [DOI] [PubMed] [Google Scholar]
- 25.Zhang JN, Muthukumar M. J. Chem. Phys. 2009;130(3) doi: 10.1063/1.3050295. - [DOI] [PMC free article] [PubMed] [Google Scholar]
- 26.Lee CC, Nayak A, Sethuraman A, Belfort G, Mcrae GJ. Biophys. J. 2007;92(10):3448–3458. doi: 10.1529/biophysj.106.098608. [DOI] [PMC free article] [PubMed] [Google Scholar]
- 27.Hall D, Edskes H. J. Mol. Biol. 2004;336(3):775–786. doi: 10.1016/j.jmb.2003.12.004. [DOI] [PubMed] [Google Scholar]
- 28.Kunes KC, Cox DL, Singh RR. P. Phys. Rev. E. 2005;72(5) doi: 10.1103/PhysRevE.72.051915. - [DOI] [PubMed] [Google Scholar]
- 29.Smith JF, Knowles TPJ, Dobson CM, MacPhee CE, Welland ME. Proc. Natl. Acad. Sci. USA. 2006;103(43):15806–15811. doi: 10.1073/pnas.0604035103. [DOI] [PMC free article] [PubMed] [Google Scholar]
- 30.Knowles TPJ, Waudby CA, Devlin GL, Cohen SIA, Aguzzi A, Vendruscolo M, Terentjev EM, Welland ME, Dobson CM. Science. 2009;326(5959):1533–1537. doi: 10.1126/science.1178250. [DOI] [PubMed] [Google Scholar]
- 31.Uversky VN, Li J, Fink AL. J. Biol. Chem. 2001;276(47):44284–44296. doi: 10.1074/jbc.M105343200. [DOI] [PubMed] [Google Scholar]
- 32.Librizzi F, Rischel C. Prot. Sci. 2005;14(12):3129–3134. doi: 10.1110/ps.051692305. [DOI] [PMC free article] [PubMed] [Google Scholar]
- 33.Kodaka M. Biophys. Chem. 2004;107(3):243–253. doi: 10.1016/j.bpc.2003.09.013. [DOI] [PubMed] [Google Scholar]
- 34.Ono K, Condron MM, Teplow DB. Proc. Natl. Acad. Sci. USA. 2009;106(35):14745–14750. doi: 10.1073/pnas.0905127106. [DOI] [PMC free article] [PubMed] [Google Scholar]
- 35.Oosawa F, Asakura S. Thermodynamics of the Polymerization of Protein. New York: Academic Press; 1975. [Google Scholar]
- 36.Ferguson N, Berriman J, Petrovich M, Sharpe TD, Finch JT, Fersht AR. Proc. Natl. Acad. Sci. USA. 2003;100(17):9814–9819. doi: 10.1073/pnas.1333907100. [DOI] [PMC free article] [PubMed] [Google Scholar]
- 37.Hammer ND, Schmidt JC, Chapman MR. Proc. Natl. Acad. Sci. USA. 2007;104(30):12494–12499. doi: 10.1073/pnas.0703310104. [DOI] [PMC free article] [PubMed] [Google Scholar]
- 38.Zhu L, Zhang XJ, Wang LY, Zhou JM, Perrett S. J. Mol. Biol. 2003;328(1):235–254. doi: 10.1016/s0022-2836(03)00249-3. [DOI] [PubMed] [Google Scholar]
- 39.Xue WF, Homans SW, Radford SE. Proc. Natl. Acad. Sci. USA. 2008;105(26):8926–8931. doi: 10.1073/pnas.0711664105. [DOI] [PMC free article] [PubMed] [Google Scholar]
- 40.Skerget K, Vilfan A, Pompe-Novak M, Turk V, Waltho JP, Turk D, Zerovnik E. Bioinfo. 2009;74(2):425–436. doi: 10.1002/prot.22156. [DOI] [PubMed] [Google Scholar]
- 41.Nielsen L, Khurana R, Coats A, Frokjaer S, Brange J, Vyas S, Uversky VN, Fink AL. Biochemistry. 2001;40(20):6036–6046. doi: 10.1021/bi002555c. [DOI] [PubMed] [Google Scholar]
- 42.Fandrich M. J. Mol. Biol. 2007;365(5):1266–1270. doi: 10.1016/j.jmb.2006.11.009. [DOI] [PubMed] [Google Scholar]
- 43.Wright CF, Teichmann SA, Clarke J, Dobson CM. Nature. 2005;438(7069):878–881. doi: 10.1038/nature04195. [DOI] [PubMed] [Google Scholar]
- 44.Wang YT, Petty S, Trojanowski A, Knee K, Goulet D, Mukerji I, King J. Invest. Ophth. Vis. Sci. 2010;51(2):672–678. doi: 10.1167/iovs.09-3987. [DOI] [PMC free article] [PubMed] [Google Scholar]
- 45.Binger KJ, Pham CLL, Wilson LM, Bailey MF, Lawrence LJ, Schuck P, Howlett GJ. J. Mol. Biol. 2008;376(4):1116–1129. doi: 10.1016/j.jmb.2007.12.055. [DOI] [PubMed] [Google Scholar]
- 46.Hellstrand E, Boland B, Walsh DM, Linse S. Acs. Chem. Neurosci. 2010;1(1):13–18. doi: 10.1021/cn900015v. [DOI] [PMC free article] [PubMed] [Google Scholar]
- 47.Ferrone FA, Hofrichter J, Eaton WA. J. Mol. Biol. 1985;183(4):611–631. doi: 10.1016/0022-2836(85)90175-5. [DOI] [PubMed] [Google Scholar]
- 48.Ruschak AM, Miranker AD. Proc. Natl. Acad. Sci. USA. 2007;104(30):12341–12346. doi: 10.1073/pnas.0703306104. [DOI] [PMC free article] [PubMed] [Google Scholar]
- 49.Hill TL. Biophys. J. 1983;44:285–288. doi: 10.1016/S0006-3495(83)84301-X. [DOI] [PMC free article] [PubMed] [Google Scholar]
- 50.Eq. 5 can be directly derived from the definitions of κ, σ and α in Eq. 9; while Eq. 6 can be obtained from the asymptotic solutions of t1/2, kapp and χ in Eq. 11.
- 51.We can observe that the data plots for some proteins in Fig. 3 are not so linear, such as insulin and α-synuclein. The main reason is that the fibrillation processes under high protein concentration and low protein concentration can be quite different from each other, which has not been considered in current model.
- 52.A problem with Eq. 2 is the production of fibrils smaller than the critical nucleus during fragmentation. Such fibrils cannot grow by monomer addition because, according to the model, only size i>=nc can grow. They will be frozen in these state if nc>2. In a correct treatment, the second and third terms accounting for fiber fragmentation should be modified as −k−(j−2nc+1)f(t,j) and +2k−Σ i=j+nc f(t,i). However here for easy comparison, we still take the original model as in Knowles et al. paper.
Associated Data
This section collects any data citations, data availability statements, or supplementary materials included in this article.


